
Active vs Passive Monitoring: What's the Difference?
Active vs passive monitoring compared: how synthetic checks and real-traffic observation differ, what each one catches and misses, and why you need both.

Alert Flapping: How to Tame Unstable Up/Down Alerts
What alert flapping is, why monitors flip between up and down, and how to stop the noise with confirmation checks, dampening, and multi-location verification.

Anomaly Detection in Monitoring: Beyond Static Thresholds
What anomaly detection is, how it differs from static thresholds, the techniques behind it, where it helps, and the pitfalls to watch in real monitoring.

Graceful Degradation: Designing Systems That Fail Well
What graceful degradation means, how it differs from fault tolerance, patterns like fallbacks and circuit breakers, and how to monitor a degrading system.

Packet Loss Monitoring: Causes, Detection, and Fixes
What packet loss is, what causes it, how to monitor and measure it, what counts as acceptable, and how to diagnose and fix it before users notice.

Docker Container Unhealthy: How to Debug Health Checks
Why a Docker container shows 'unhealthy', how to read HEALTHCHECK logs, debug docker-compose health checks, and fix the most common causes fast.

Black-Box vs White-Box Monitoring: What's the Difference?
Black-box vs white-box monitoring compared — what each one sees, where each one fails, and why resilient teams run both. A practical guide with examples.

The Four Golden Signals of Monitoring Explained
Latency, traffic, errors, and saturation — what Google's four golden signals mean, why they work, how to measure each one, and how to alert on them.

RED vs USE Method: Monitoring Metrics Frameworks
RED (Rate, Errors, Duration) vs USE (Utilization, Saturation, Errors) — what each method measures, when to use which, and how they fit together.
10 Best Free Uptime Monitoring Tools in 2026 (Compared)
Compare the 10 best free uptime monitoring tools — check intervals, monitor limits, alert channels (email/Slack/SMS), and which free uptime monitor is right for you.
Website Down Checker: How to Check If Your Website Is Down & Fix It
Is your website down or just down for you? Use a website down checker to verify real outages, rule out local DNS/cache issues, and fix common downtime causes in minutes.

3xx Redirect Codes Explained: 301, 302, 303, 307 & 308
What 3xx HTTP redirect codes mean — 301, 302, 303, 307, 308 — how they differ, which to use for SEO, method/cache behavior, and how to monitor redirects.

How to Create a Website Status Report (Template & Metrics)
Build a website status report stakeholders trust: which uptime, performance and incident metrics to include, a reusable template, and how to automate the data.

4xx Client Errors Explained: 400, 401, 403, 404 & 429
What 4xx HTTP client errors mean — 400, 401, 403, 404, 405, 408, 410, 429 — their causes, how they differ from 5xx, and how to monitor and alert on them.

RTO vs RPO Explained: Setting Disaster Recovery Objectives
RTO vs RPO made clear — what each means, how they differ, how to calculate them, how they relate to MTD, MTTR and backups, and how monitoring protects both.

Apdex Score Explained: Measuring App Performance Satisfaction
What Apdex is, how the score is calculated from satisfied, tolerating and frustrated requests, how to set the T threshold, and where Apdex helps or misleads.

HTTP/3 & QUIC Monitoring: What Changes and What to Watch
How HTTP/3 and QUIC change monitoring: UDP 443, 0-RTT, connection migration, fallback to HTTP/2, and the new failure modes and metrics you must watch.

Latency Percentiles Explained: p50, p95, p99 & Why Averages Lie
Understand p50, p95, p99 and p99.9 latency percentiles, why averages hide outages, how to set SLOs on tail latency, and how to alert on the right number.

ActiveRecord Monitoring: N+1, Slow Queries & Pool Exhaustion
Detect ActiveRecord N+1 queries, slow SQL and pool exhaustion in Rails. Bullet, Prosopite, pg slow logs, Sidekiq pool sizing, and HTTP latency as canary.

AI Crawler Monitoring: Track GPTBot, ClaudeBot & PerplexityBot Traffic
Detect and monitor inbound AI crawler traffic from GPTBot, ClaudeBot, PerplexityBot, Google-Extended and more. User-agent IDs, IP ranges, robots.txt and alerts.

Real User Monitoring (RUM) Explained: How It Works & When to Use It
RUM explained from first principles: what it measures, how it captures Core Web Vitals, beacons, sampling, privacy, when to use it and when synthetic wins.

5xx Server Errors Explained: 500, 502, 503, 504 Fix Guide
Diagnose and fix HTTP 5xx server errors. What 500, 502, 503, 504 and Cloudflare 520-526 mean, common causes per code, and how to monitor each.

Is My Website Down? How to Check From Outside in 60 Seconds
Find out if your website is really down or only down for you. Step-by-step external checks: DNS, ping, multi-region, third-party tools, and what to do next.

Uptime Downtime Calculator: 99% to 99.999% Allowed Downtime
How much downtime does each uptime percentage actually allow? Full tables from 99% to 99.999% in seconds, minutes, hours and days per day, month and year.

Cron Dead-Man Switch Monitoring: Catch Missed Jobs Fast
Detect cron and scheduled tasks that silently stop running. Build dead-man switches with last-success timestamps, grace periods, and missed-vs-failed alerts.

Incoming Webhook Monitoring: Retries, Failures & Security
Monitor incoming webhook endpoints from Stripe, GitHub, Clerk, Shopify and more. Catch failed deliveries, signature errors, slow 2xx responses, and partner disablement.

Response Body Validation Monitoring: When 200 OK Lies
HTTP 200 does not mean healthy. Validate response bodies for login pages, empty JSON, error templates, missing fields, and stale builds to catch false-green outages.
Cookie Consent Banner Monitoring: GDPR & CCPA Compliance
Monitor cookie consent banners in production. Catch missing CMP scripts, broken buttons, wrong regions, and analytics firing before consent.
Open Graph Monitoring: Social Cards, OG Images & Link Previews
Monitor Open Graph and Twitter/X card metadata. Catch broken social previews, missing OG images, wrong canonical URLs, and stale share cards.
Site Search Monitoring: Empty Results, 500s & Relevance Drift
Monitor site search endpoints and result pages. Catch empty results, 500s, indexing drift, slow queries, and relevance regressions before users bounce.

DNS Propagation, CAA & DNSSEC Monitoring: Deep Dive
Monitor DNS propagation, CAA records, DNSSEC validation, MX records, nameserver drift, and resolver differences before DNS changes become outages.

Domain Expiry & WHOIS Monitoring: Prevent the Worst Outage
Monitor domain expiry, WHOIS/RDAP records, registrar lock, and nameserver delegation. Prevent the outage that takes down web, email, and trust.

TLS Configuration Monitoring: Cipher, Chain, OCSP & CT Logs
Monitor TLS beyond certificate expiry. Catch weak ciphers, broken chains, OCSP failures, SAN drift, CT log surprises, and HSTS regressions.

HTTP Security Headers Monitoring: CSP, HSTS, CORS Drift
Monitor HTTP security headers in production. Catch CSP, HSTS, CORS, and X-Frame-Options drift on deploy before compliance and XSS gaps open.

Redirect Chain Monitoring: Broken 301s, Loops & SEO Loss
Monitor redirect chains for broken 301s, infinite loops, and SEO equity loss. Catch migration regressions and hop-count drift before traffic drops.

Sitemap & robots.txt Monitoring: Catch SEO Deploy Bugs Fast
Monitor sitemap.xml and robots.txt for deploy regressions. Catch noindex disasters, URL drops, and stale lastmod before Search Console does.

MySQL Production Monitoring: Slow Queries, Replication, Locks
Monitor MySQL in production. Performance Schema, slow query log, InnoDB buffer pool, replication lag, deadlocks, and alert thresholds.
PostgreSQL Production Monitoring: Slow Queries & Replication
Monitor PostgreSQL in production. pg_stat_statements, replication lag, autovacuum bloat, lock trees, connection pools, and alert thresholds.

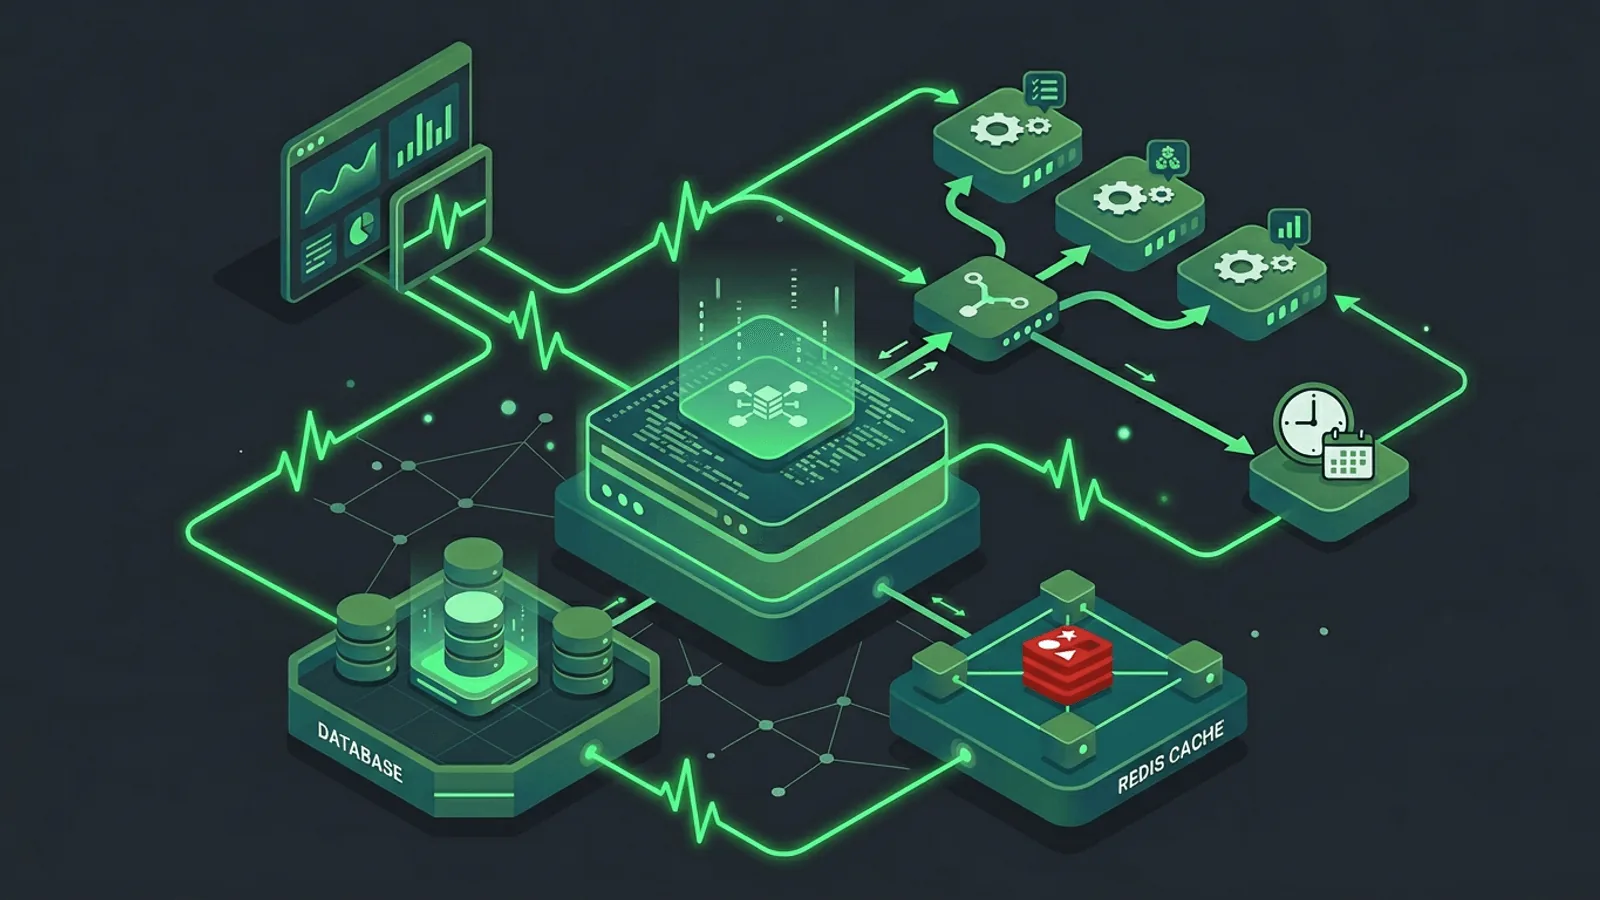
Redis Production Monitoring: Memory, Eviction & Latency
Monitor Redis in production. INFO sections, maxmemory eviction, latency spikes, slowlog, replication, persistence, big keys, and cluster mode.

Track AI Search Visibility: ChatGPT, Perplexity & AI Overviews
Track whether ChatGPT, Perplexity & Google AI Overviews cite your site. GEO/AEO tracking, prompt sets, citation drift & brand-visibility alerts.

JavaScript SEO Monitoring: Is Googlebot Rendering Your SPA?
Detect when Googlebot can't see your SPA. JS rendering checks, hydration mismatches, render-blocking scripts, crawl-vs-user content drift.
Structured Data Monitoring: Schema, JSON-LD & Rich Snippets
Monitor schema.org changes, JSON-LD breakage, and rich snippet eligibility. Catch deploy regressions before Search Console penalizes you.
Cloudflare Workers Monitoring: D1, R2, KV & Edge Errors
Monitor Cloudflare Workers, D1, R2 & KV in production. Catch CPU-time limits, KV hot-key throttling & D1 replica lag before users hit edge errors.
INP Monitoring: Interaction to Next Paint Guide
Monitor Interaction to Next Paint (INP) in production. Catch click and input lag before Core Web Vitals slip and SEO suffers.
Auth0, Okta, Clerk: Identity Provider Monitoring
Monitor Auth0, Okta, Clerk, and other identity providers in production. Catch SSO outages, JWT issues, and login failures before users do.

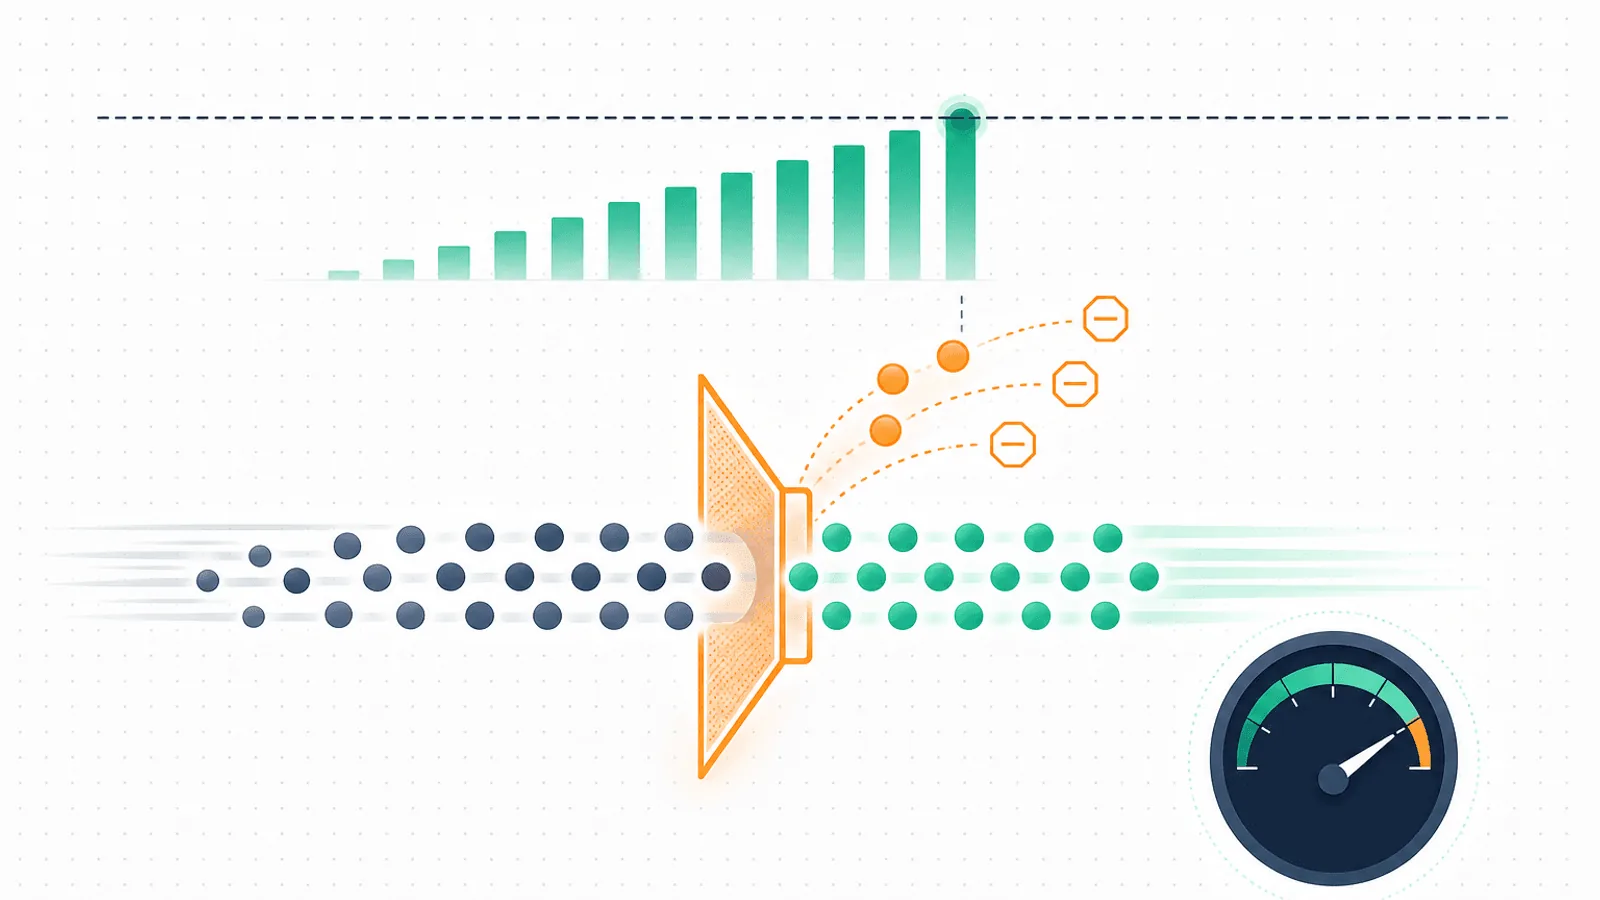
DDoS Monitoring: Detect & Mitigate Traffic Spikes
Monitor DDoS attacks in production. Detect traffic spikes, layer 7 floods, and origin saturation before sites go down.
OpenTelemetry Monitoring: Traces, Metrics, and Logs
Set up OpenTelemetry monitoring in production. Instrument traces, metrics, and logs, then surface incidents without vendor lock-in.
Ruby on Rails Monitoring: Production Uptime Guide
Monitor Ruby on Rails apps in production. Track requests, ActiveRecord, Sidekiq, Action Cable, and deploys before users hit errors.
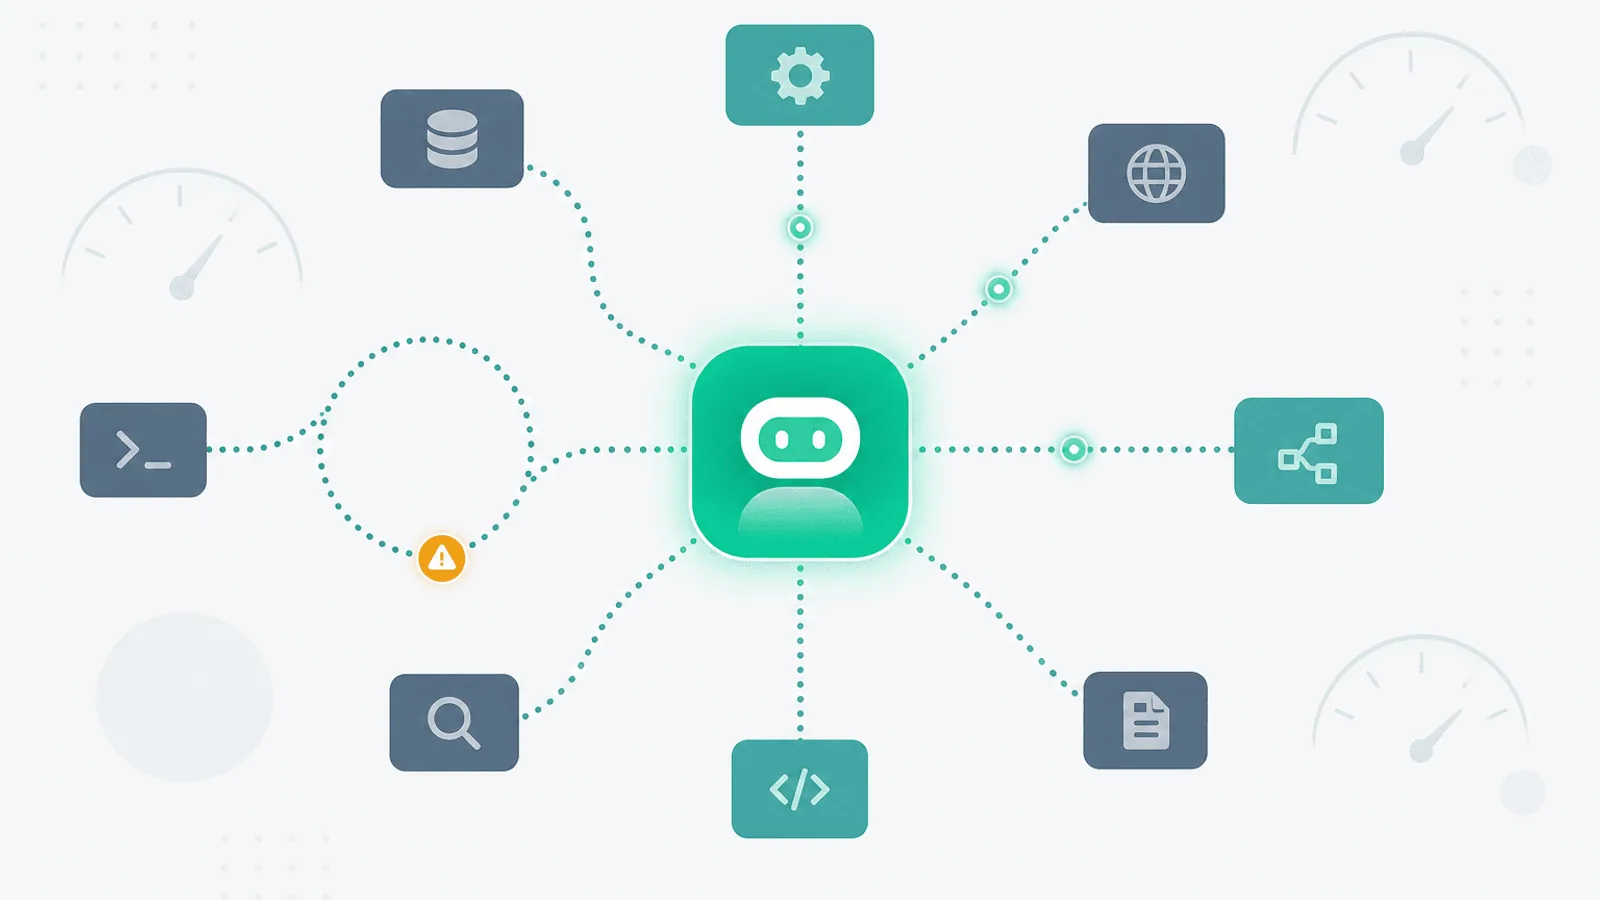
AI Agent Monitoring: Tool Calls, Loops, and Cost
Monitor AI agents in production. Track tool-call success, runaway loops, cost spikes, and trajectory failures before users notice.
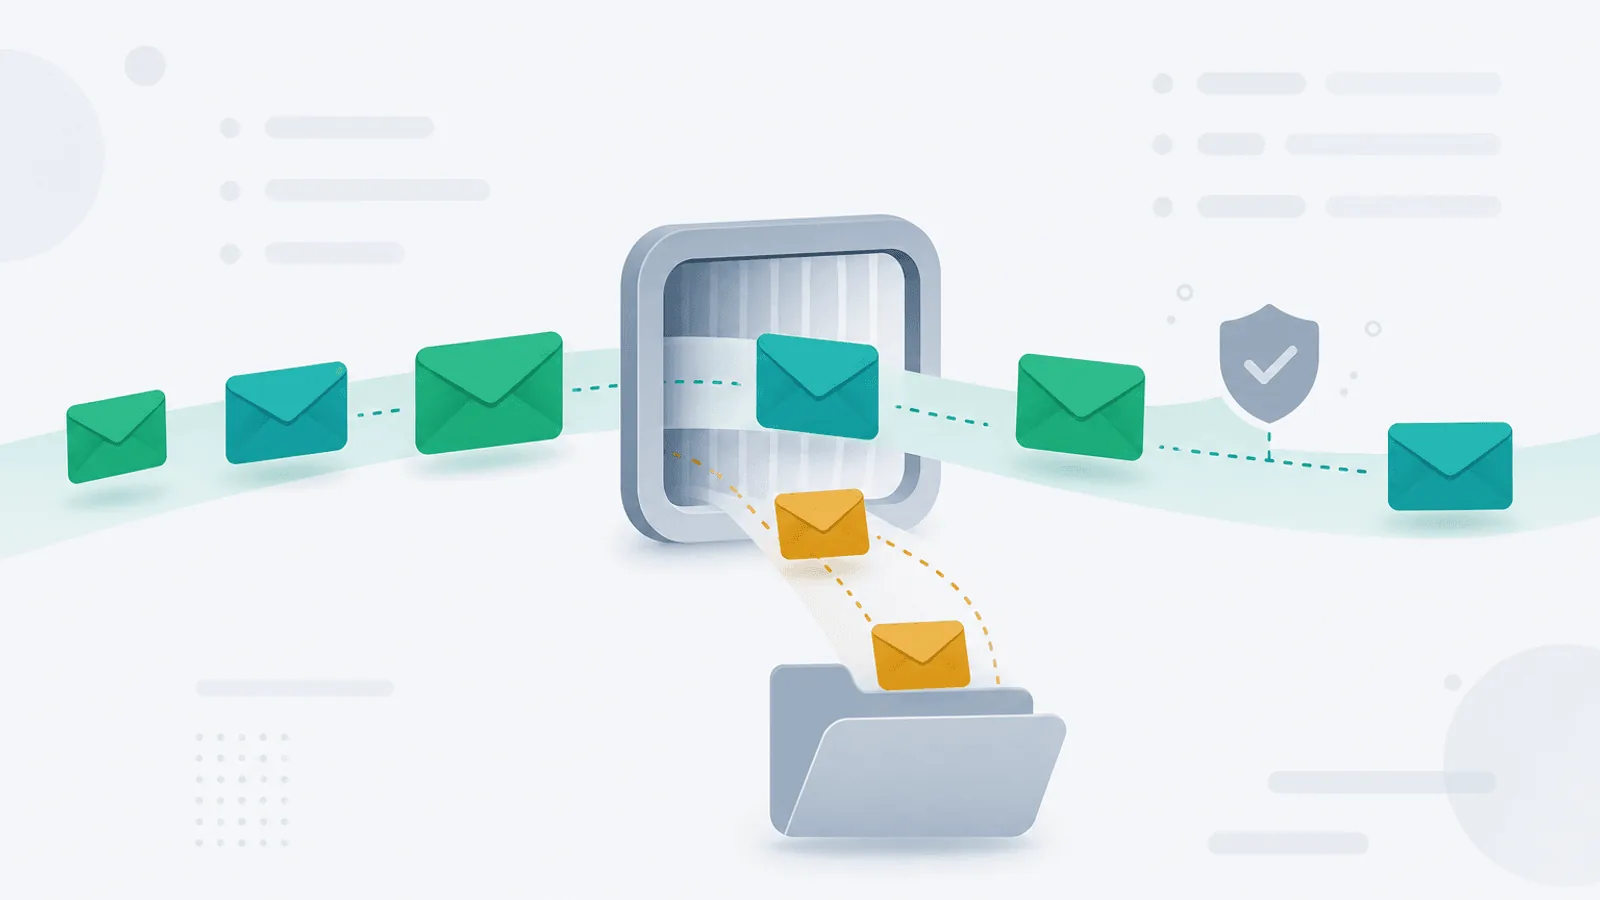
Email Deliverability Monitoring: DMARC, SPF, Bounces
Monitor email deliverability in production. Track DMARC, SPF, DKIM, bounce rates, and sender reputation before campaigns silently fail.
API Rate Limit Monitoring: 429 Errors and Throttling
Monitor API rate limits and 429 throttling errors. Track quota usage, retry-after headers, and avoid surprise outages from third-party caps.
Supabase & Firebase Monitoring: Backend Uptime Guide
Monitor Supabase and Firebase backends in production. Track auth, database, functions, and storage uptime before users hit failures.
5xx Error Rate Monitoring: 500, 502, 503 Alert Guide
Track 5xx server error rates in production. Set alerts on 500, 502, 503 patterns and distinguish app bugs from infrastructure failures.

Vector Database Monitoring: Pinecone, Weaviate, pgvector
Monitor vector databases powering RAG and AI features. Track Pinecone, Weaviate, and pgvector uptime, query latency, and index health.
AI API Monitoring: OpenAI, Anthropic, and Gemini Uptime
Monitor LLM APIs in production. Track OpenAI, Anthropic, and Gemini uptime, latency, rate limits, and failover so AI features stay reliable.
Health Check Endpoints: /health, /livez, /readyz Guide
Design health check endpoints that catch real failures. Learn liveness vs readiness, deep checks, and what to expose to monitors and Kubernetes.
MongoDB Monitoring: Uptime, Replicas, and Clusters
MongoDB fails differently than SQL. Learn to monitor replica sets, sharded clusters, slow queries, and connection pools for production.
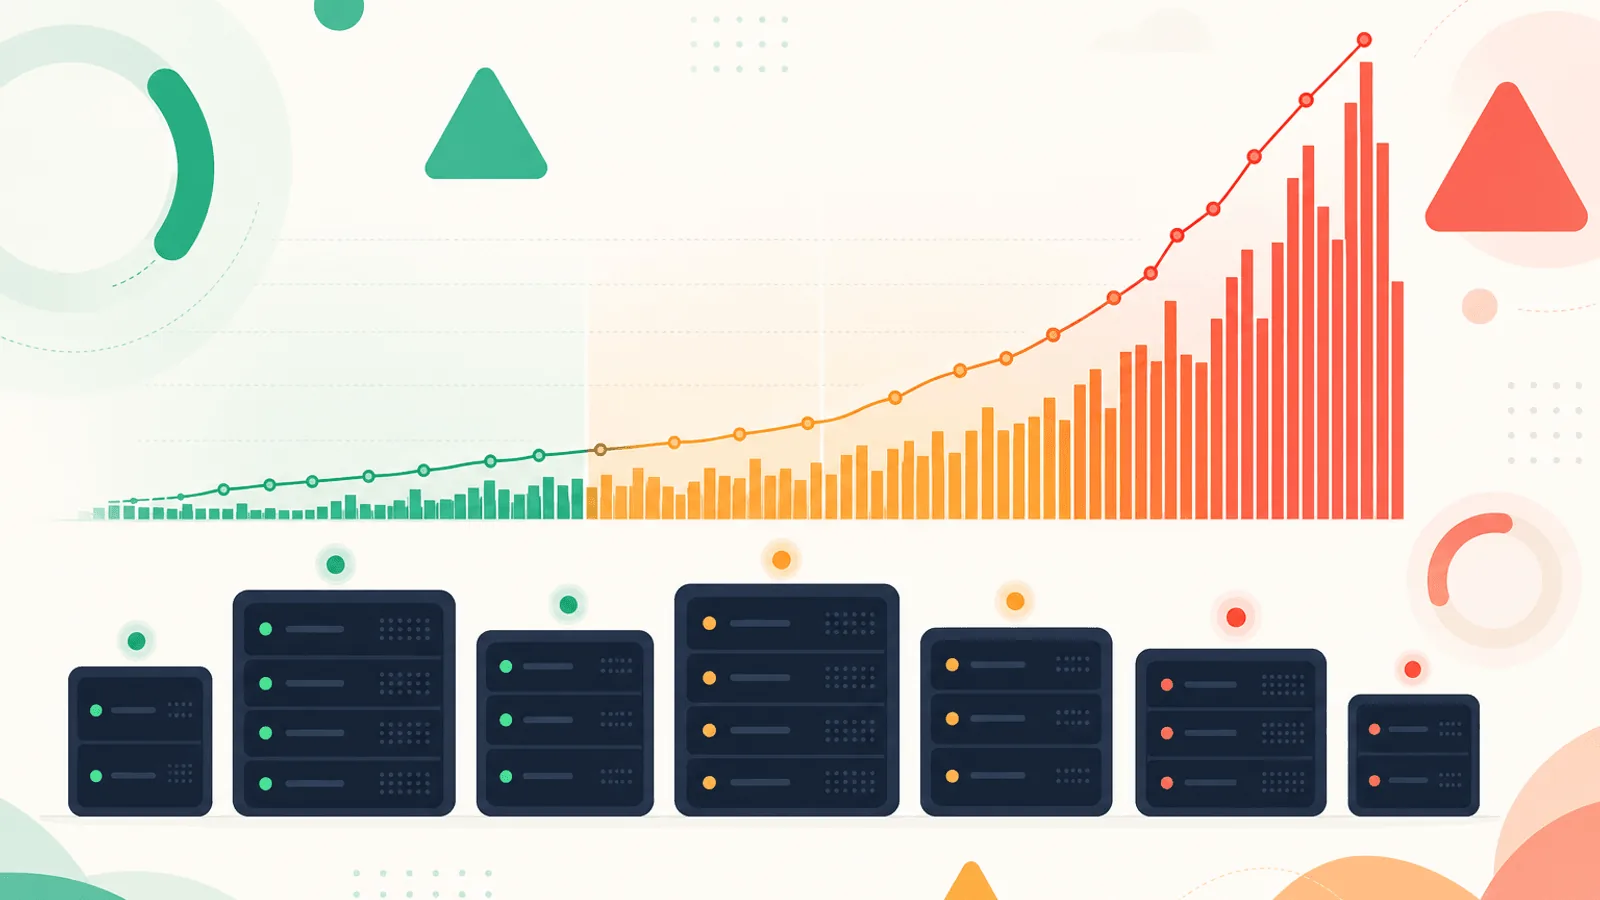
Peak Traffic Monitoring: Black Friday and Launch Days
High-traffic events expose hidden weaknesses. Learn how to prepare monitoring for Black Friday, product launches, and viral traffic spikes.
Job Queue Monitoring: Sidekiq, BullMQ, and SQS
Background jobs fail silently. Learn to monitor queues, dead letter queues, latency, and consumers across Sidekiq, BullMQ, RabbitMQ, and SQS.
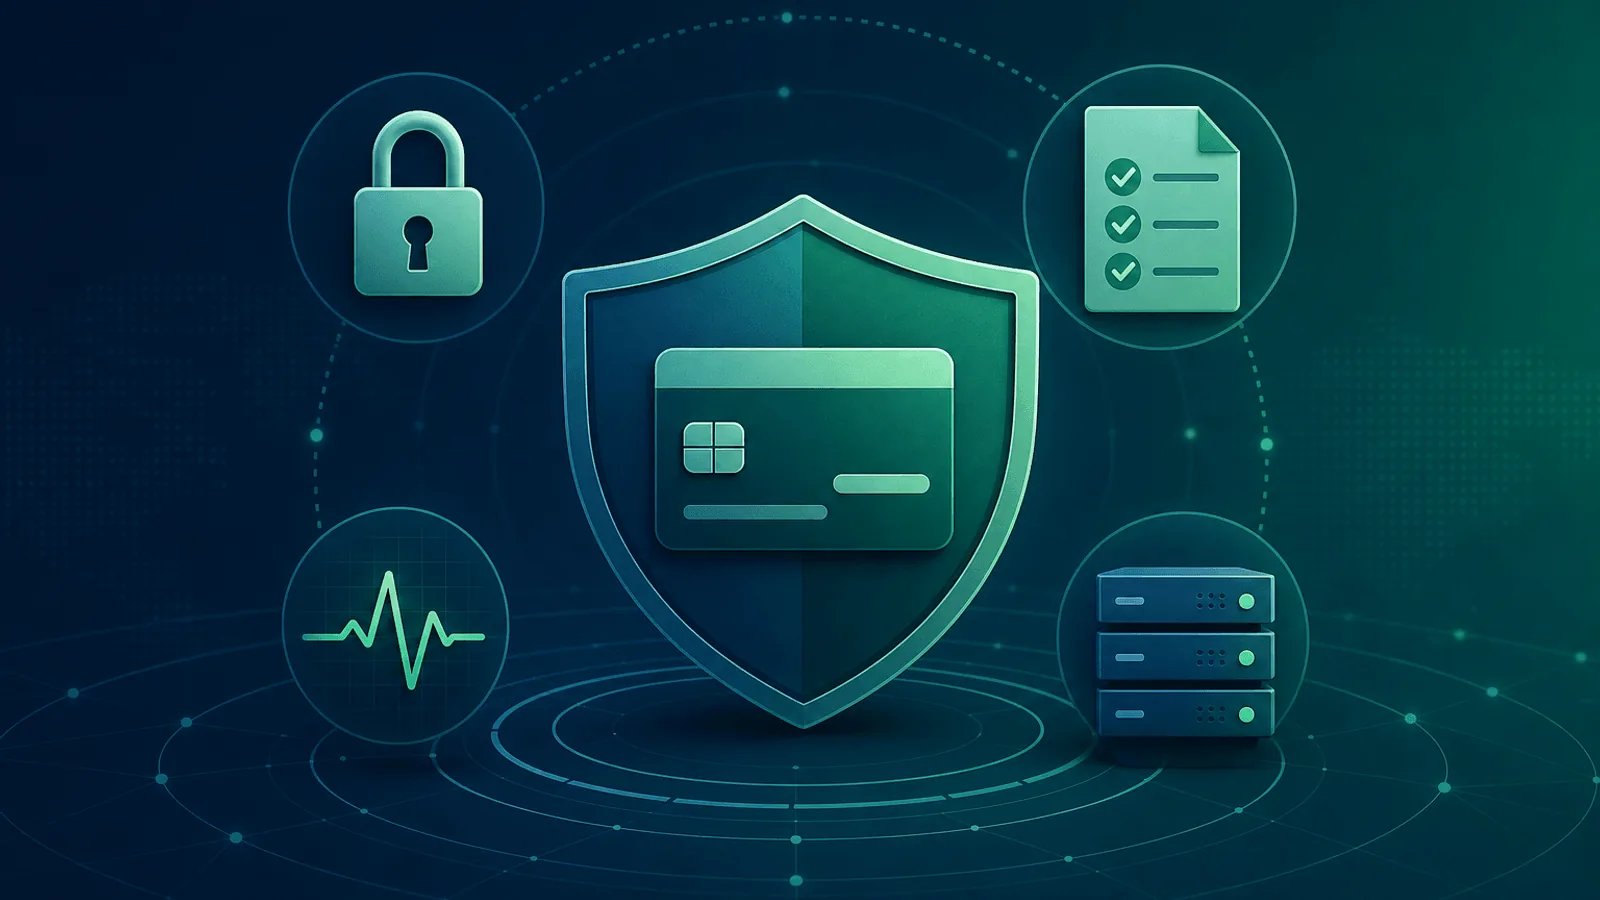
PCI DSS Monitoring: What Compliance Auditors Expect
PCI DSS requires continuous monitoring of payment systems. Learn how monitoring satisfies Requirements 10 and 11 for cardholder data environments.
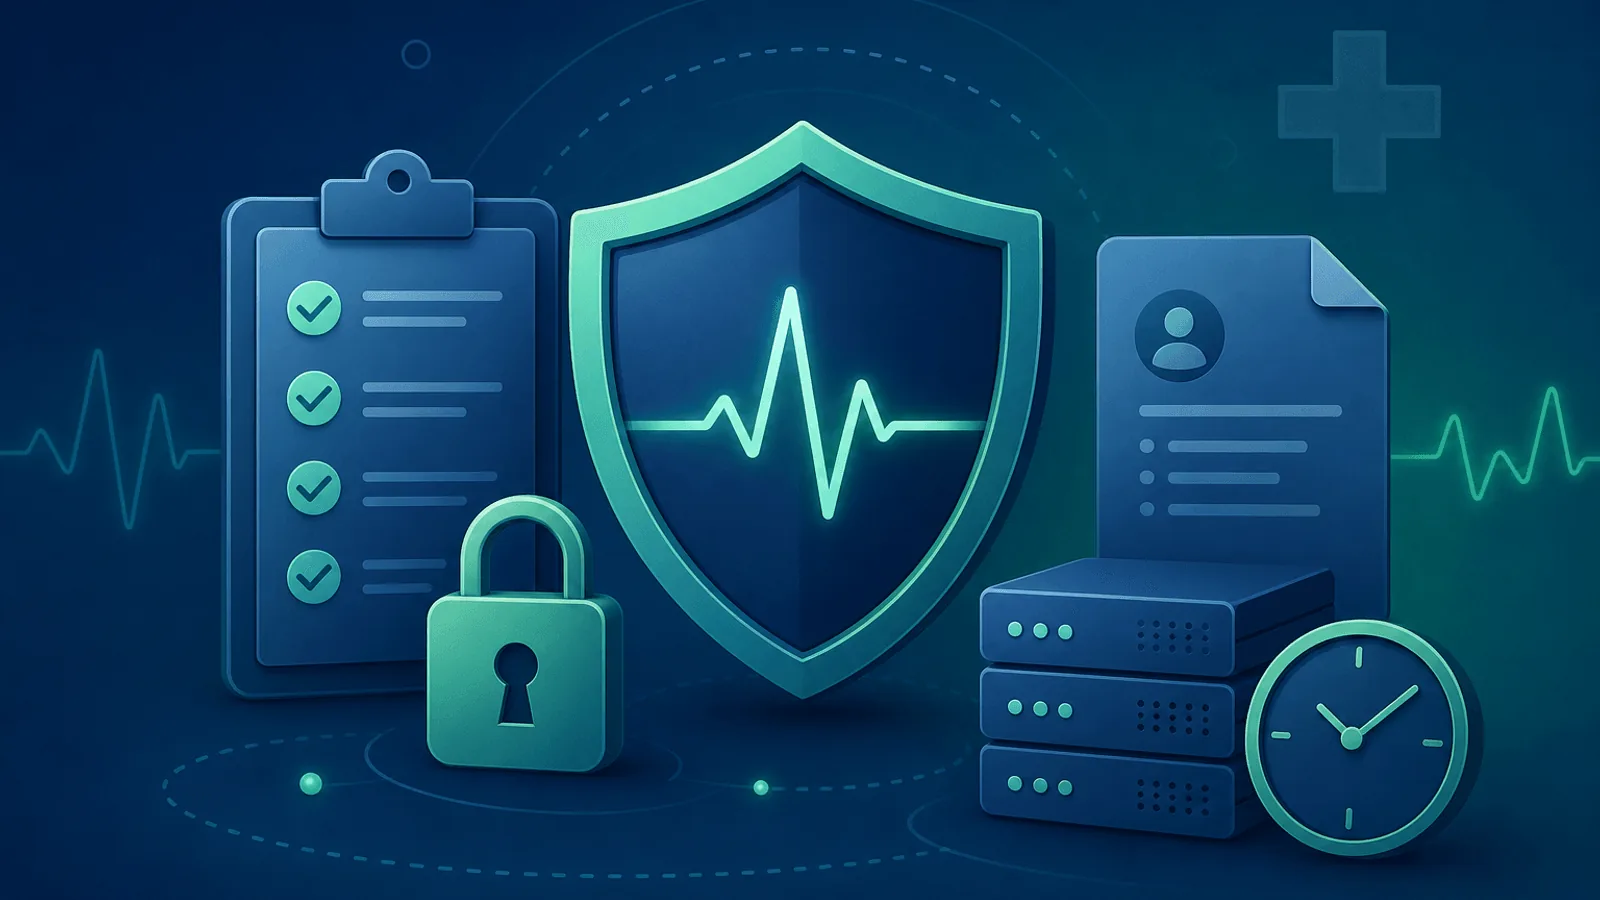
HIPAA Compliance Monitoring: What Auditors Expect
HIPAA requires safeguards for ePHI availability and integrity. Learn how monitoring satisfies the Security Rule and audit requirements.
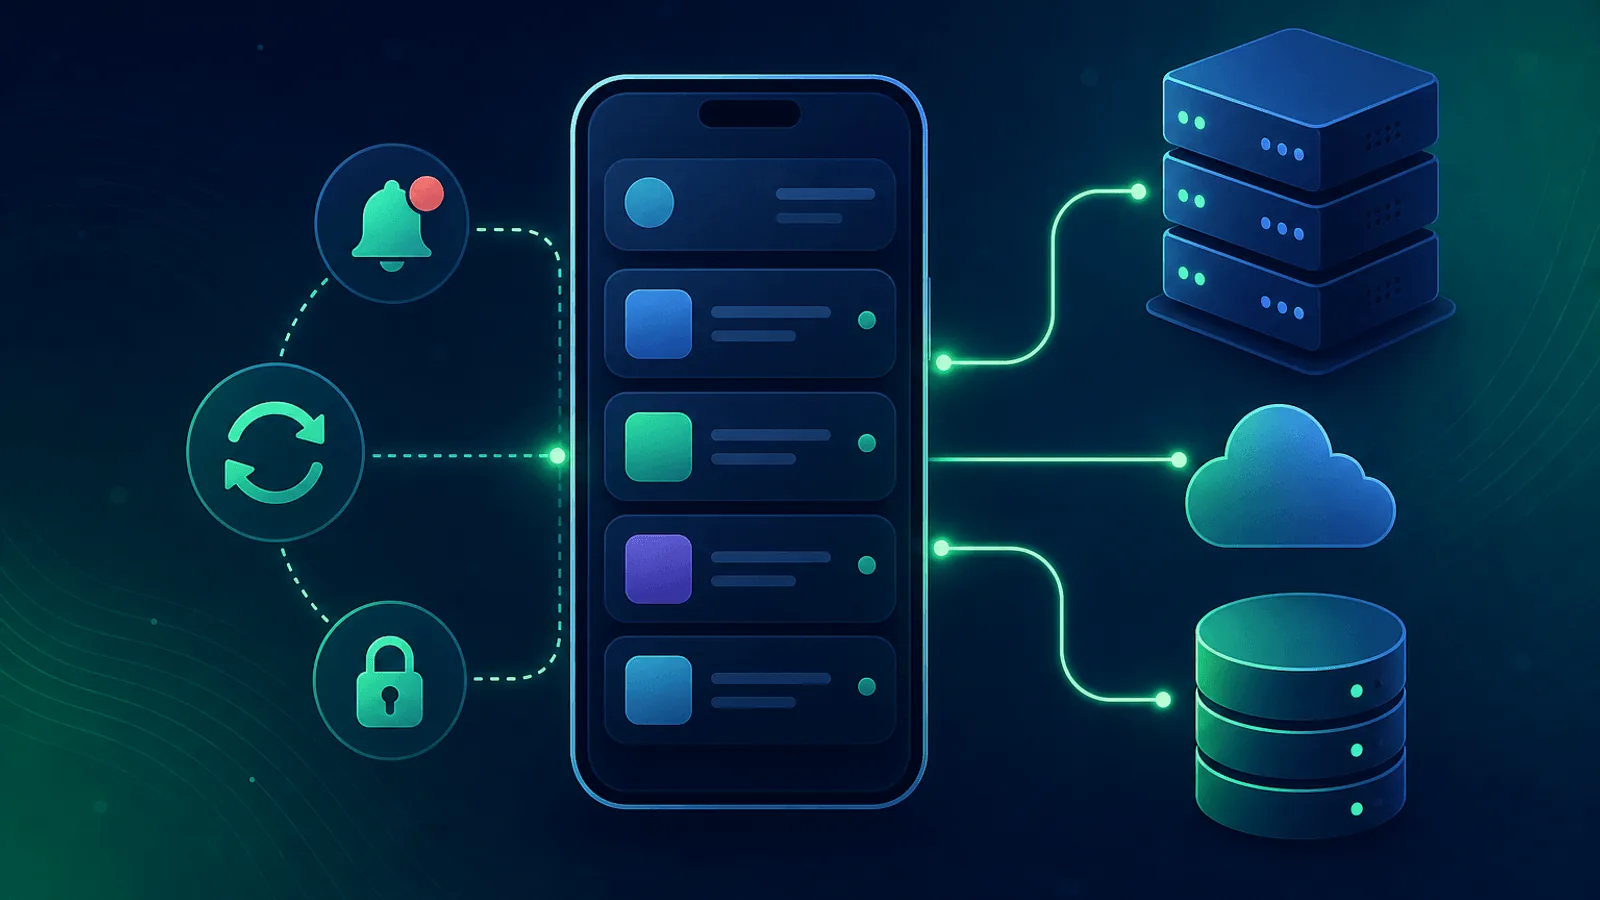
Mobile App Backend Monitoring: API Uptime Guide
Mobile apps fail when the backend fails. Learn how to monitor APIs, push, auth, and offline sync for iOS and Android apps in production.
CDN Monitoring: Catch Edge, Cache, and Origin Failures
Your CDN is your frontline. Learn how to monitor edge nodes, cache hit rates, origin health, and TLS across CloudFront, Fastly, and Cloudflare.
Monitoring for GDPR Compliance: What Auditors Expect
GDPR requires availability and integrity of personal data. Learn how monitoring satisfies Article 32 and the records auditors look for.
gRPC Monitoring: Health Checks for Microservices
gRPC fails differently than REST. Learn how to monitor gRPC health, deadlines, streaming, and TLS across your microservice mesh.
How to Monitor a Magento Store for Downtime
Magento powers high-volume stores. Learn how to monitor checkout, extensions, cron, and Adobe Commerce for revenue-saving uptime.
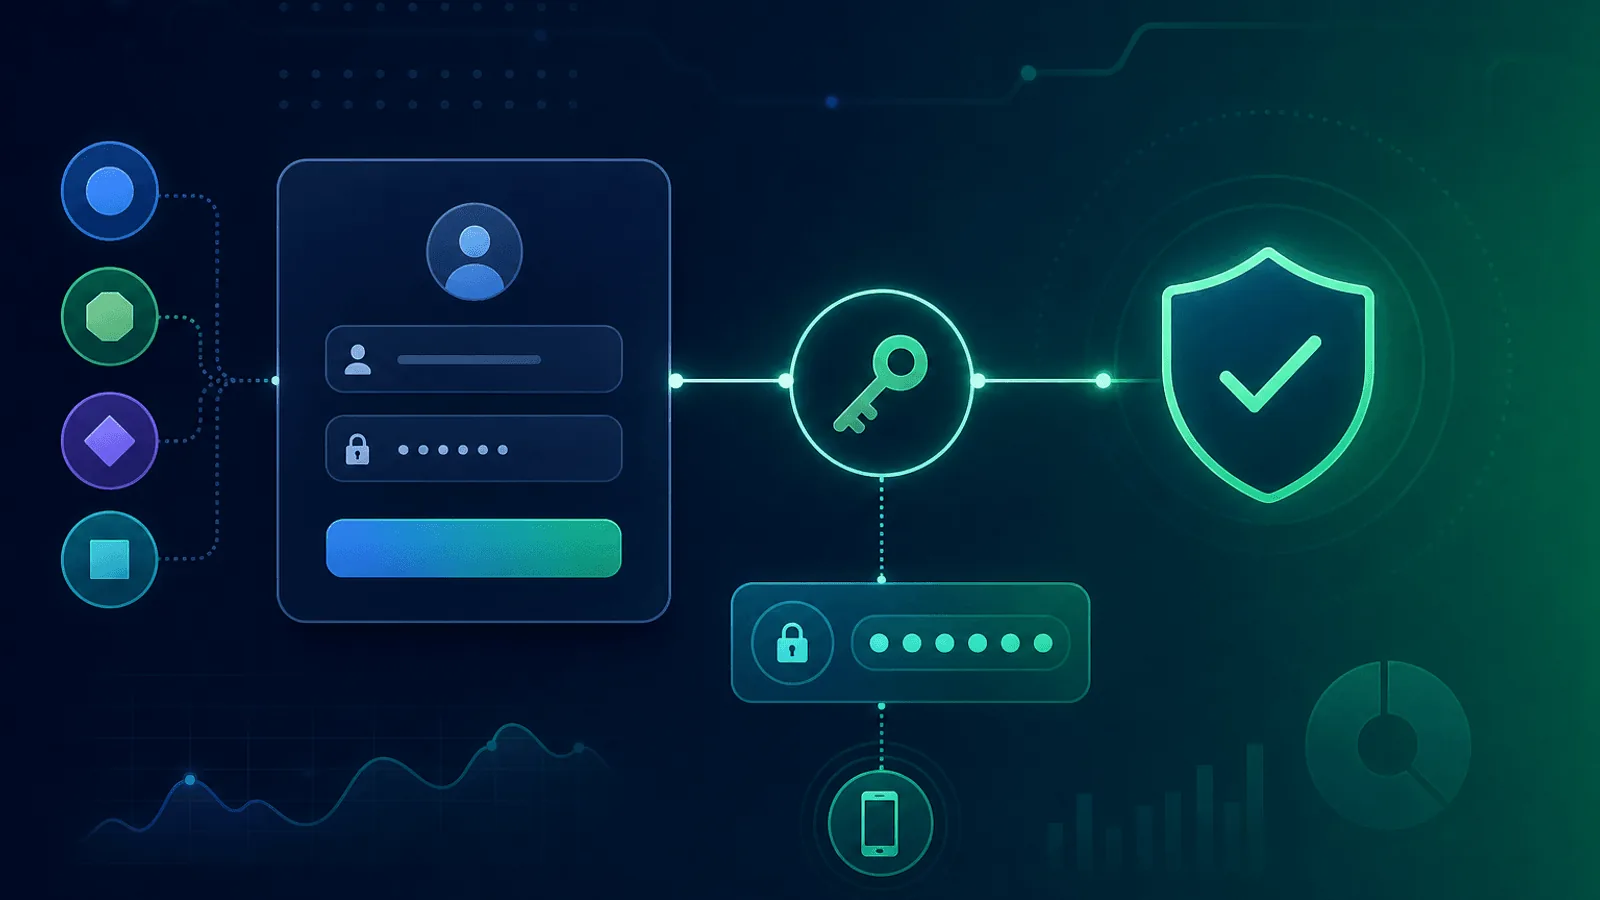
How to Monitor Your Login and Authentication Flow
When login breaks, your whole product breaks. Learn how to monitor sign-in forms, OAuth, SSO, and password reset flows end-to-end.

TTFB Monitoring: Diagnose Slow Server Response Times
Time To First Byte reveals where your site is slow. Learn how to monitor TTFB, what causes high values, and how to fix server-side slowness.
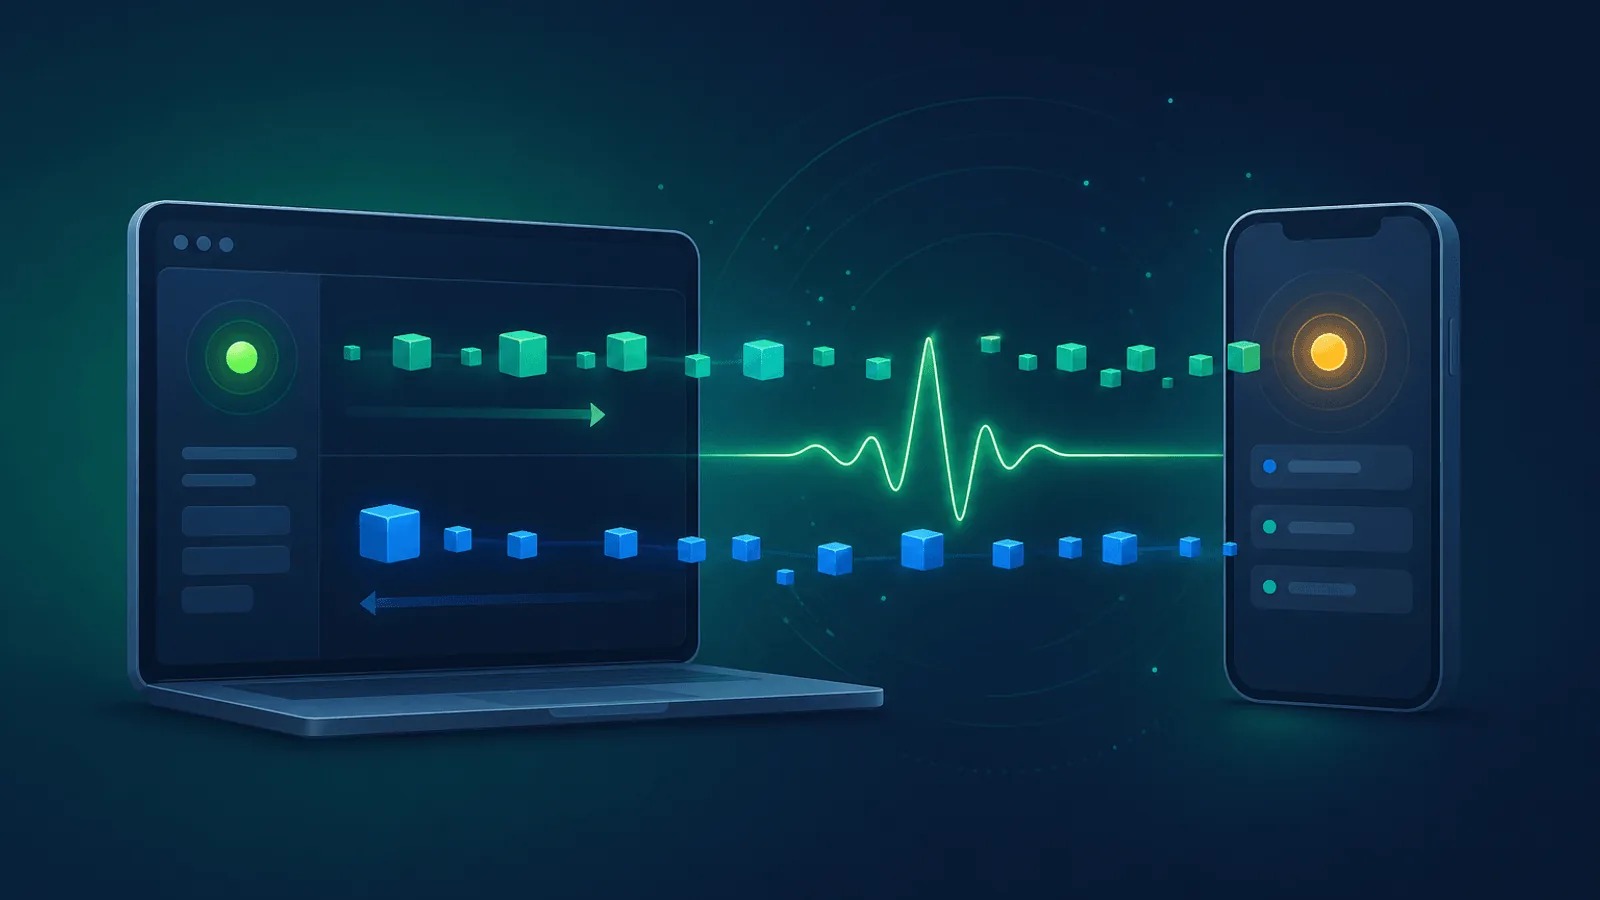
WebSocket Monitoring: Keep Real-Time Features Online
WebSocket connections fail silently. Learn how to monitor handshakes, latency, message delivery, and reconnect logic for real-time apps.
How to Monitor a WooCommerce Store for Downtime
WooCommerce powers millions of stores. Learn how to monitor checkout, plugins, payment gateways, and WordPress for revenue-saving uptime.
How to Monitor a Django App in Production
Django apps fail beyond the web layer. Learn to monitor Celery workers, scheduled tasks, database health, and deployments.
How to Reduce MTTR and Recover from Incidents Faster
Every minute of downtime costs money. Learn the 5 levers that reduce Mean Time to Recovery and how monitoring shortens each one.

Monitoring for SOC 2 Compliance and Audit Requirements
SOC 2 requires continuous availability monitoring and evidence. Learn what auditors look for and how monitoring satisfies the criteria.
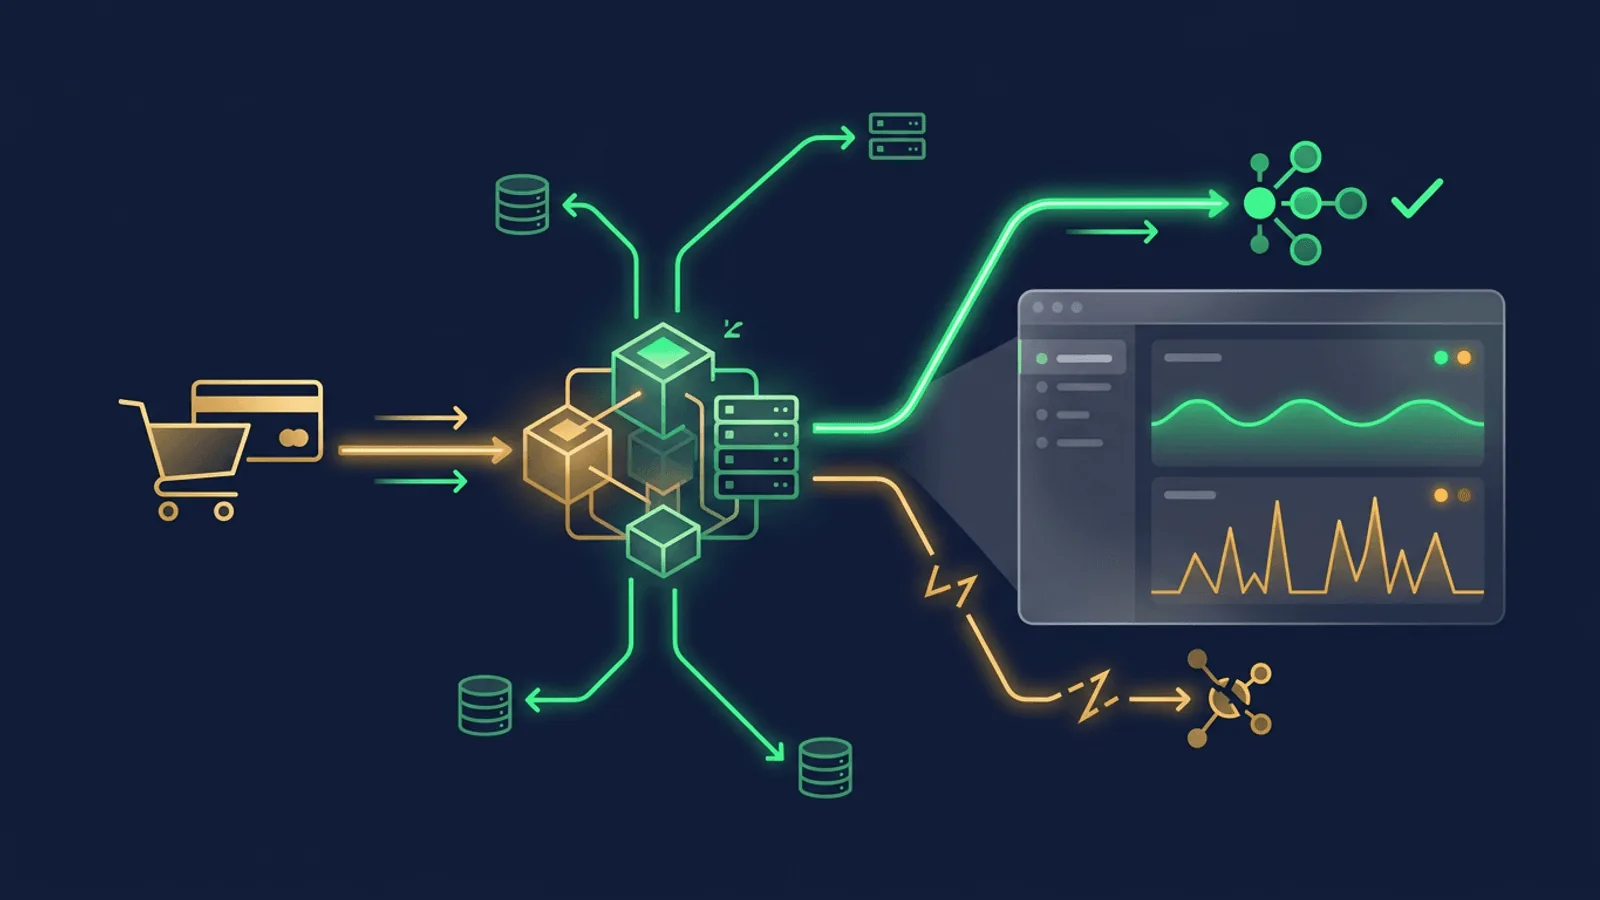
Stripe and Payment Monitoring: Catch Failed Transactions
Payment failures cost revenue and customers. Learn how to monitor Stripe, checkout health, webhooks, and payment APIs before users notice.
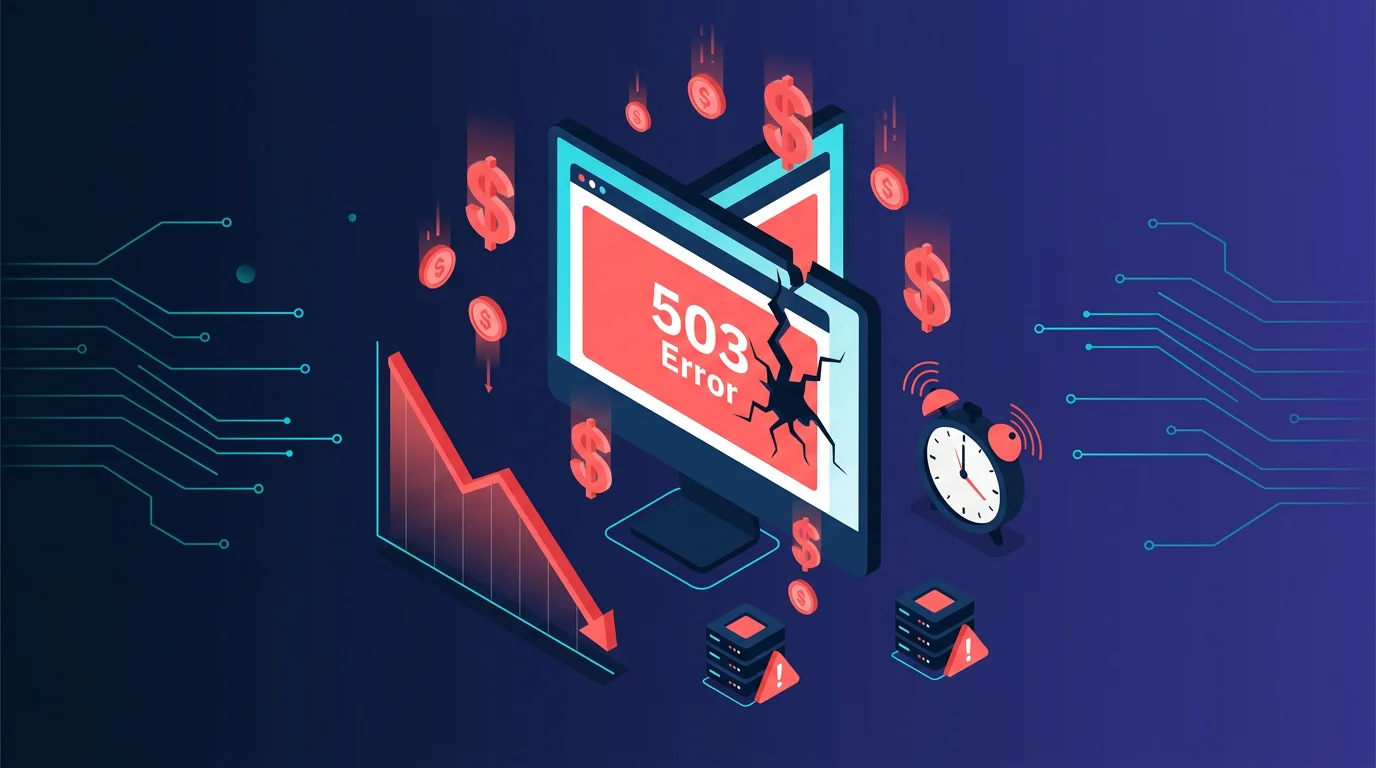
Website Downtime Cost Calculator: What Every Minute Offline Really Costs
Use this downtime cost calculator framework to estimate lost revenue, support load, churn risk, and the real business impact of every minute offline.
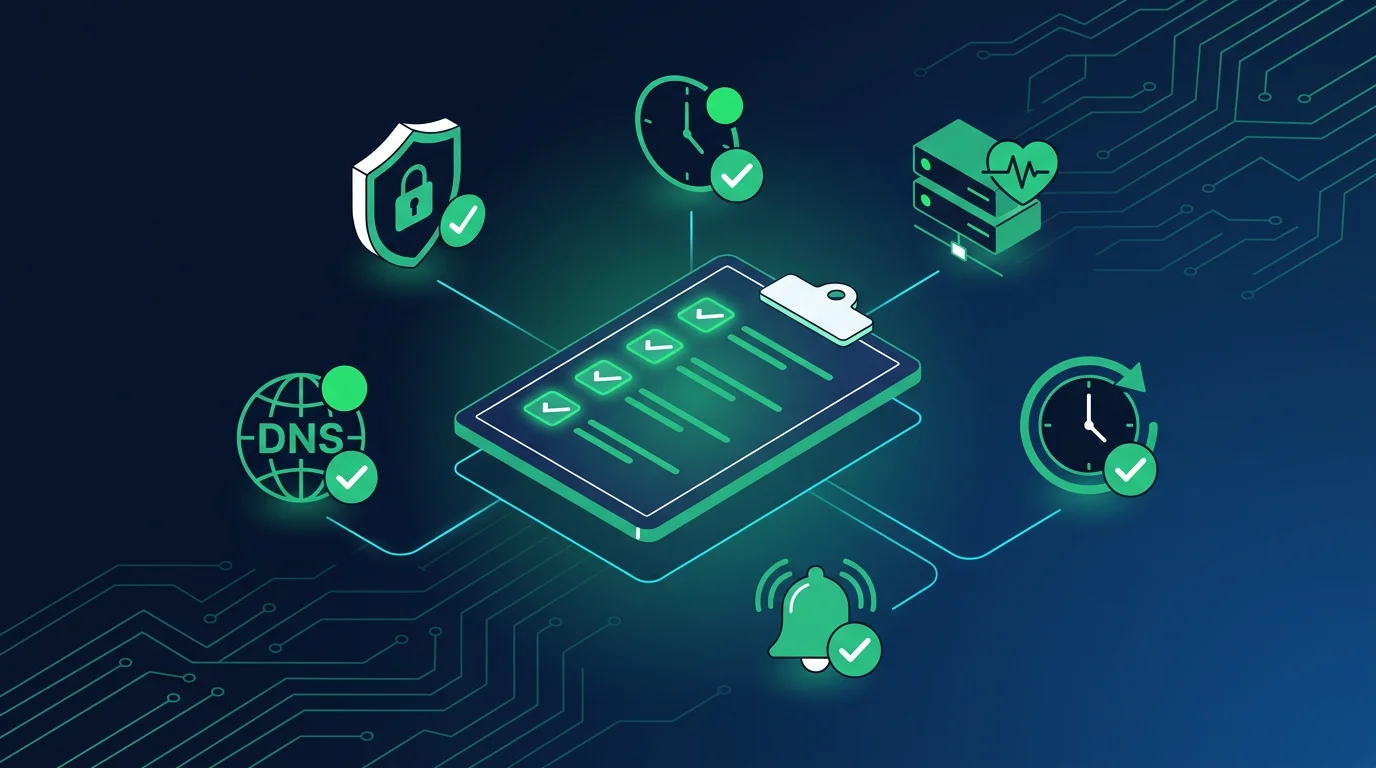
Website Monitoring Checklist: What to Set Up Before an Outage
Use this website monitoring checklist to set up uptime, SSL, DNS, API, cron, alerting, and status page coverage before the next outage.
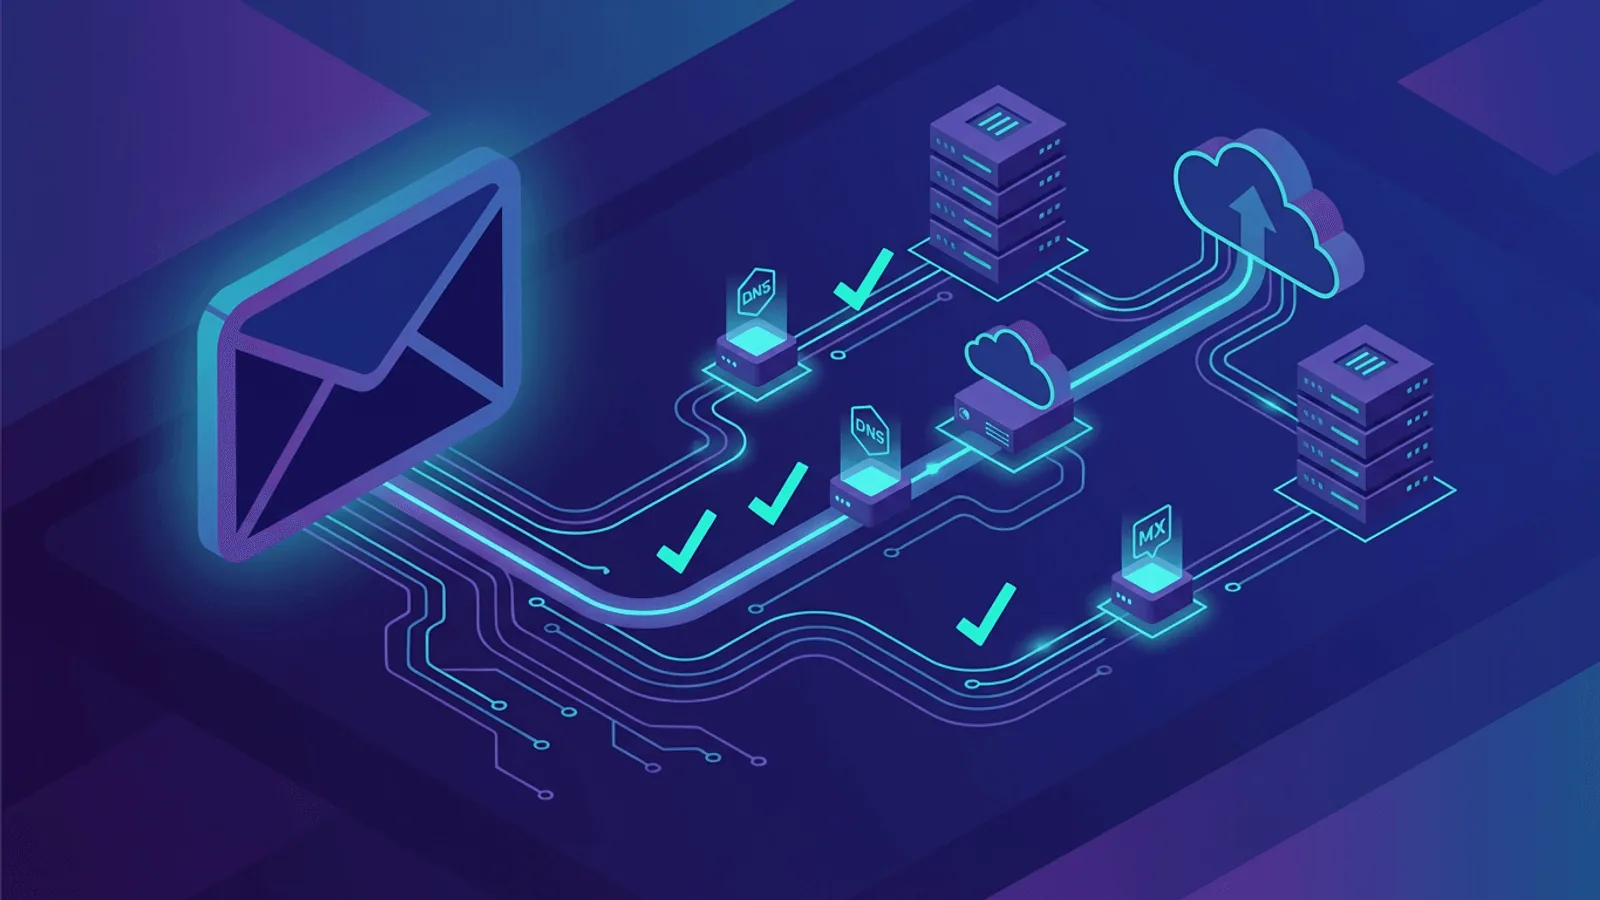
Email and SMTP Monitoring: Ensure Delivery
Broken email delivery means lost resets, invoices, and signups. Learn how to monitor SMTP, MX records, and transactional email health.
How to Monitor a Laravel App in Production
Laravel apps fail in ways that HTTP checks alone miss. Learn how to monitor queues, scheduled tasks, API routes, and deployments.
Post-Incident Monitoring: What to Watch After an Outage
The hours after an incident are the riskiest. Learn what to monitor during recovery to catch regressions and rebuild confidence.
How to Monitor a Shopify Store for Downtime
Shopify outages cost sales every minute. Learn how to monitor your store, checkout flow, and third-party apps for downtime.
Core Web Vitals Monitoring: LCP, INP, and CLS
Google uses Core Web Vitals for rankings. Learn how to monitor LCP, INP, and CLS, detect regressions, and keep your site fast.
Nginx Monitoring: Uptime, Errors, and Performance
Nginx powers a third of the web. Learn how to monitor Nginx for uptime, error rates, slow responses, and misconfigurations before users notice.

How to Monitor a Next.js App in Production
Next.js apps fail differently than traditional sites. Learn how to monitor SSR, API routes, ISR, and edge middleware for real uptime.

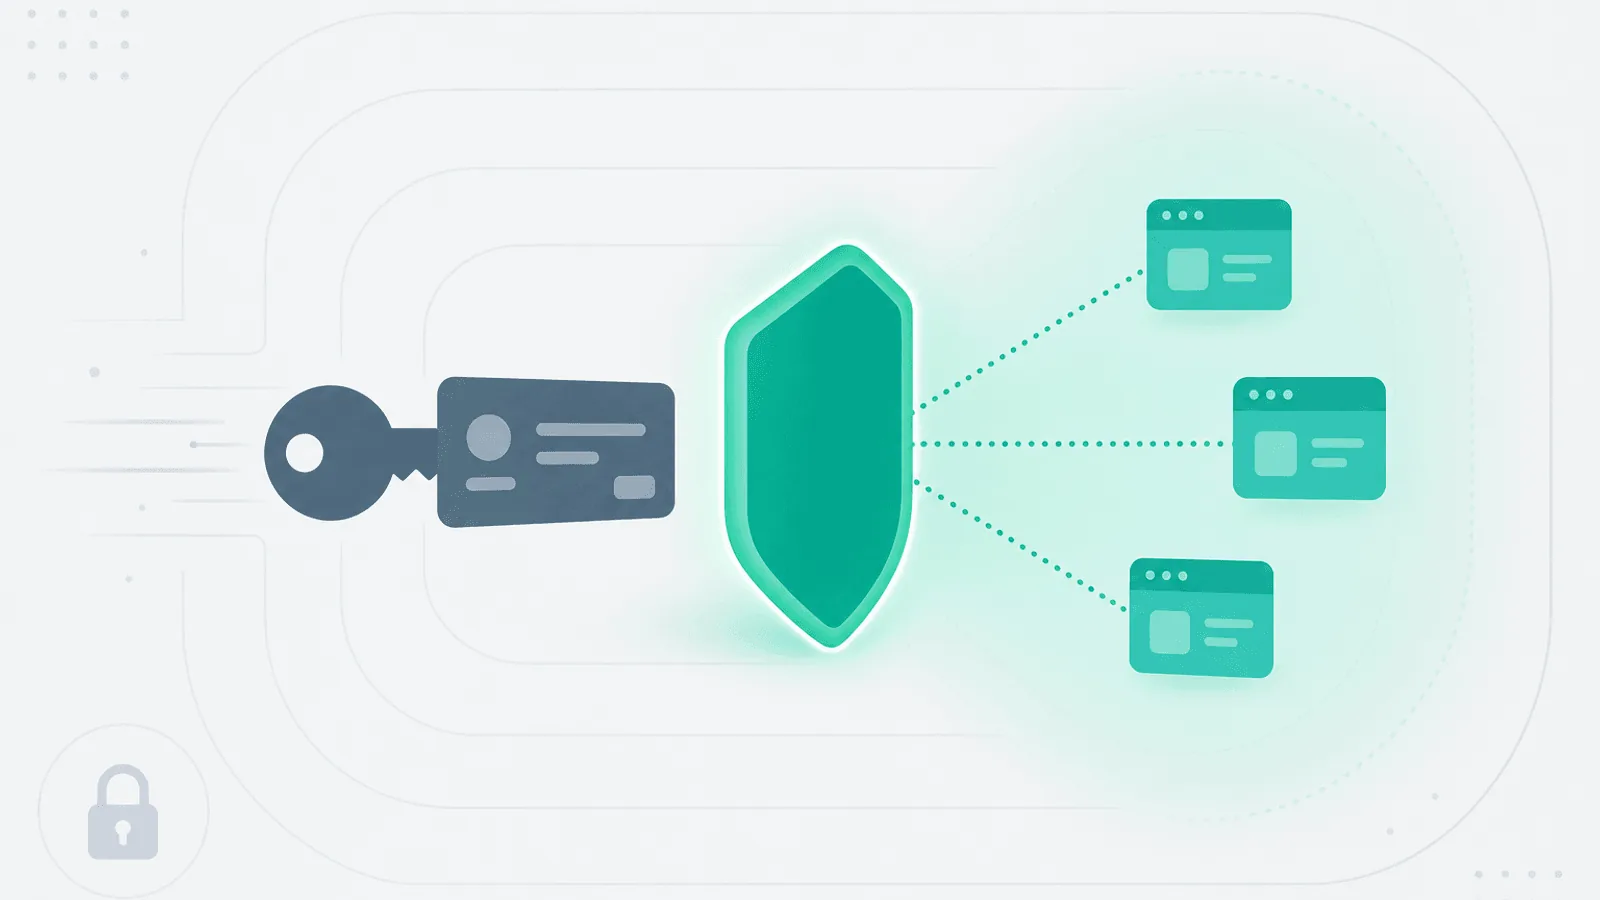
Website Security Monitoring: Detect Threats Fast
Hackers change your site silently. Learn how to detect defacement, malware injection, unauthorized changes, and DNS hijacking with monitoring.
Website Monitoring for Non-Technical Founders and PMs
You don't need to be a developer to monitor your website. Learn what to watch, what alerts mean, and how to keep your site reliable.
Terraform Monitoring: Drift Detection and Deploy Checks
Terraform applies can succeed while infrastructure breaks. Learn how to monitor IaC deployments, detect drift, and validate changes.
Serverless Monitoring: Lambda, Vercel, Edge Functions
Serverless fails silently. Learn how to monitor AWS Lambda, Vercel, and edge functions for timeouts, cold starts, and invocation errors.
PagerDuty Alternative: Monitoring + Alerting Combined
PagerDuty is powerful but complex and expensive. Compare it to Webalert for teams that want monitoring and alerting in one simple tool.
How to Monitor a Single-Page Application (SPA)
SPAs can return 200 OK with a blank screen. Learn how to monitor React, Vue, and Angular apps with checks that catch real failures.
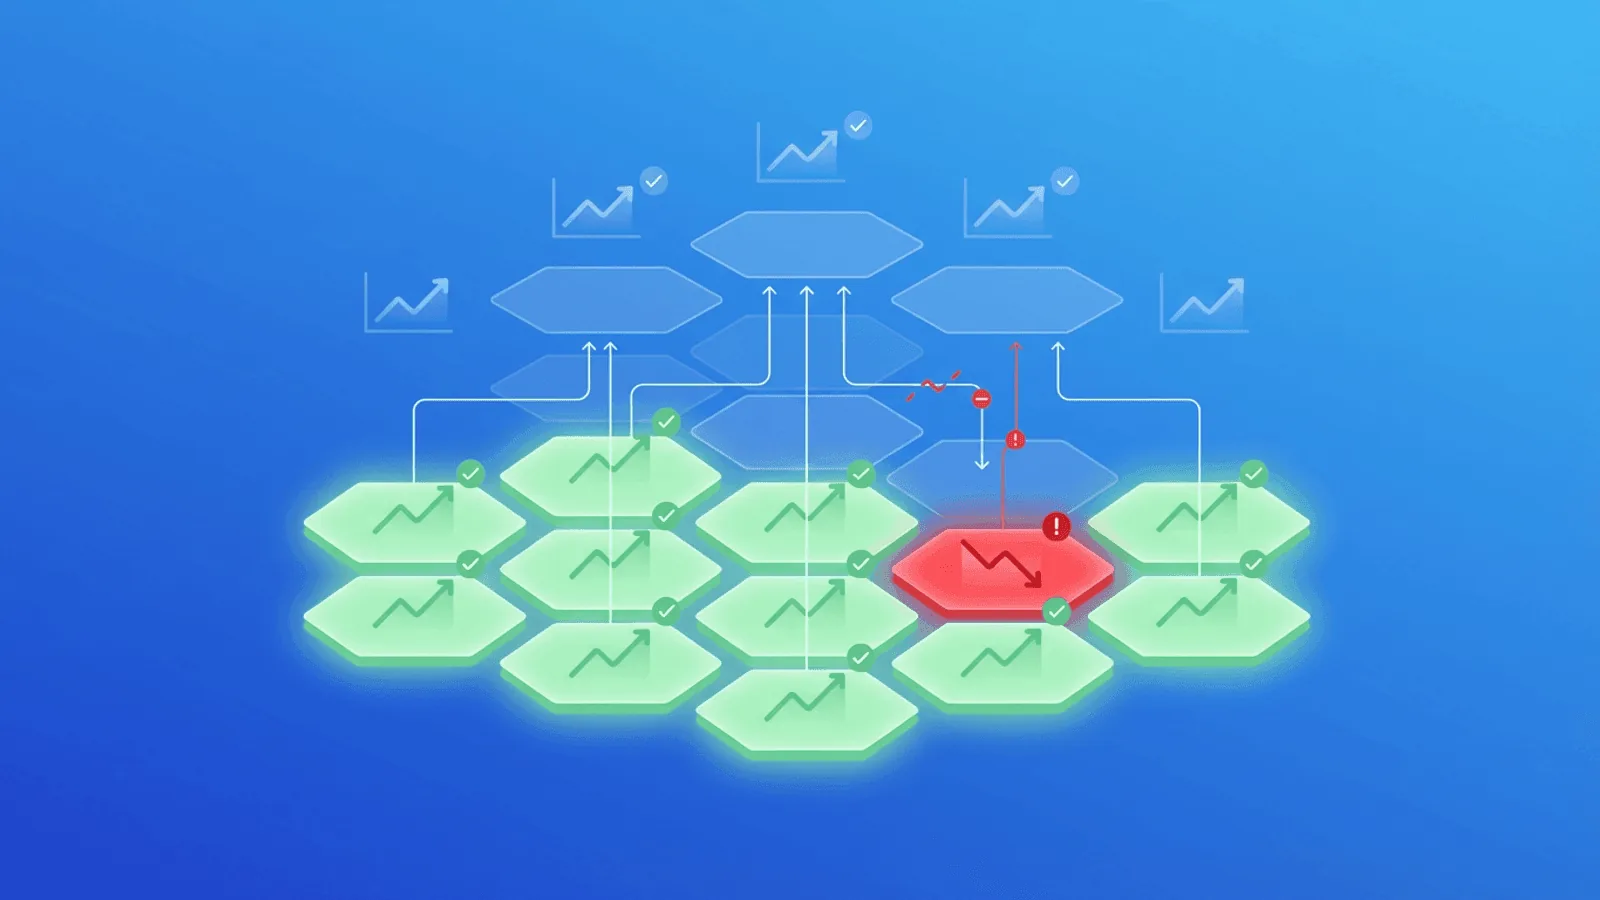
Multi-Tenant SaaS Monitoring: Per-Customer Uptime
Multi-tenant failures are hard to detect with global checks. Learn how to monitor per-customer uptime, isolate noisy neighbors, and alert by tier.
How to Monitor a REST API: Endpoints, Auth, Errors
REST API monitoring goes beyond ping checks. Learn which endpoints to watch, how to validate responses, and when to alert.

Feature Flag Monitoring: Detect Bad Rollouts Before Users Churn
Feature flags reduce release risk, but only with monitoring. Learn how to monitor rollouts, detect regressions fast, and rollback safely.
Cloudflare Monitoring: How to Detect Origin Outages Behind a CDN
Your CDN can mask partial failures. Learn how to monitor Cloudflare-routed websites and detect origin outages before customers report them.
SLO Monitoring Guide: SLI, SLO, and Error Budget Explained
SLOs turn uptime goals into engineering decisions. Learn SLIs, SLOs, and error budgets, plus how to monitor them in production.
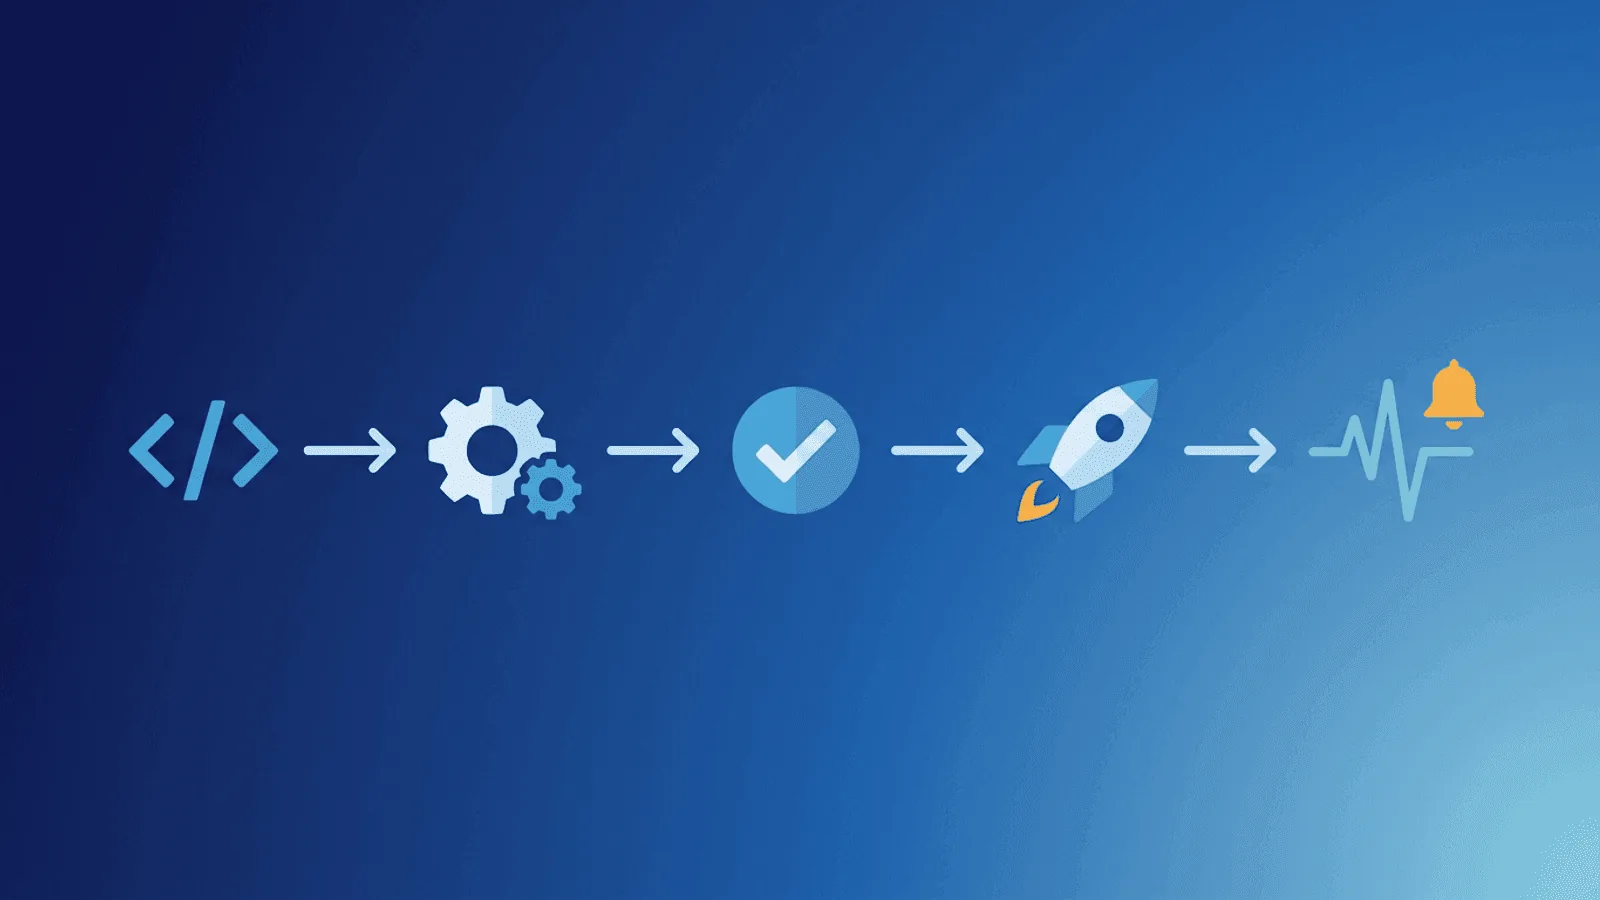
How to Monitor a CI/CD Pipeline: Catch Deployment Failures Fast
Deployments are the riskiest moment for any service. Learn how to monitor your CI/CD pipeline, detect failed deploys, and validate post-deployment health automatically.
Load Testing vs Monitoring: What's the Difference and When Do You Need Each?
Load testing and monitoring solve different problems. Learn when to use each, how they complement each other, and why you need both for reliable systems.
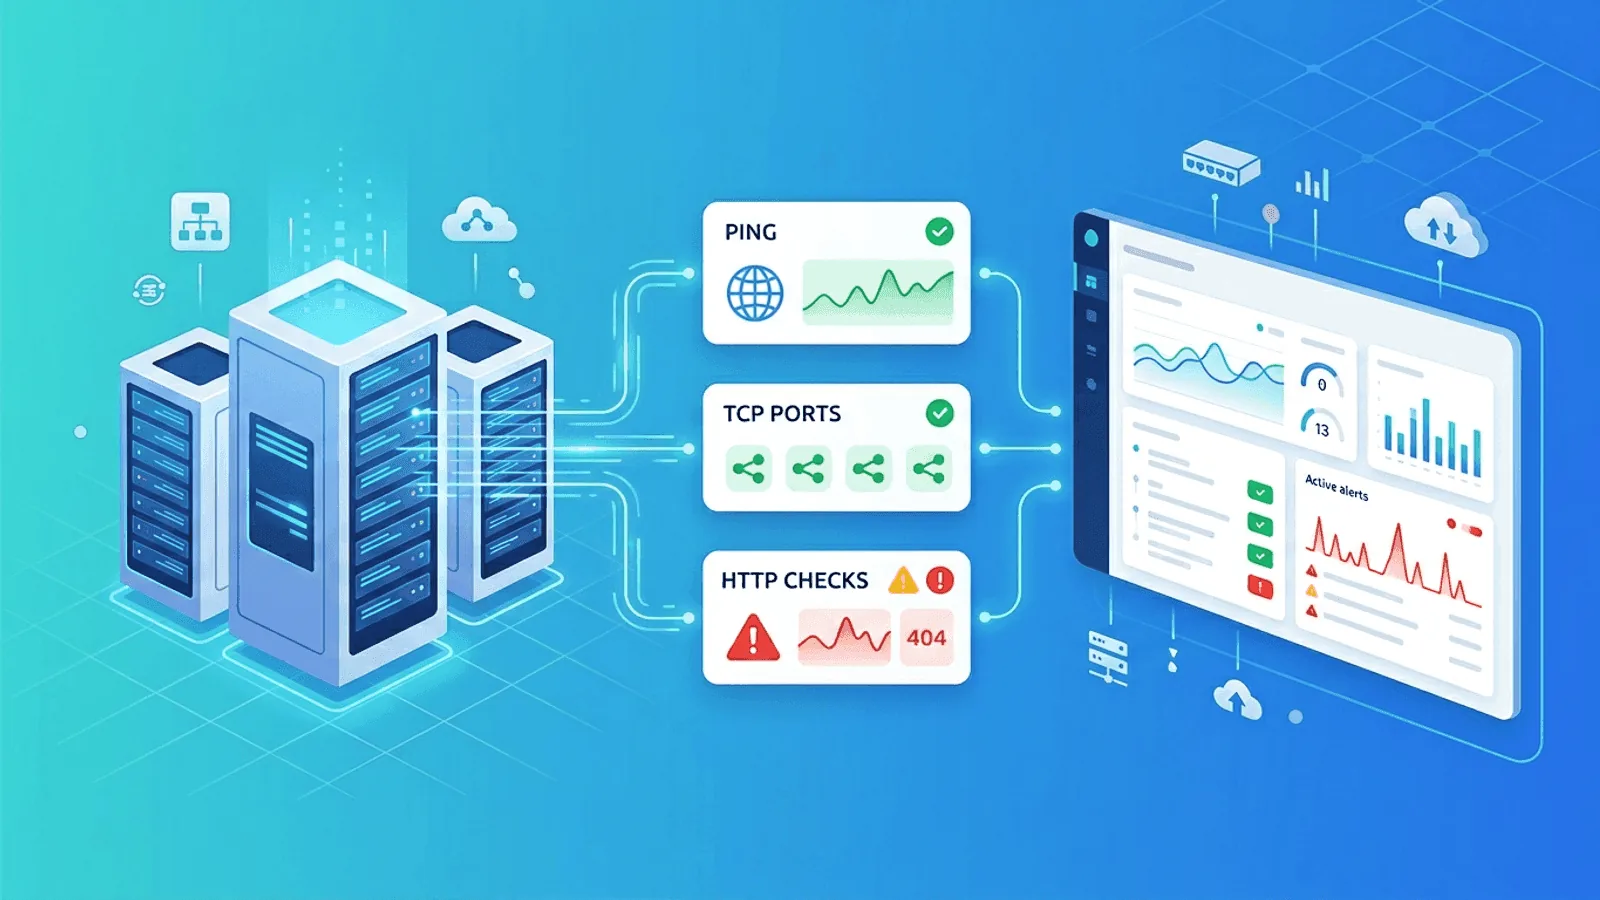
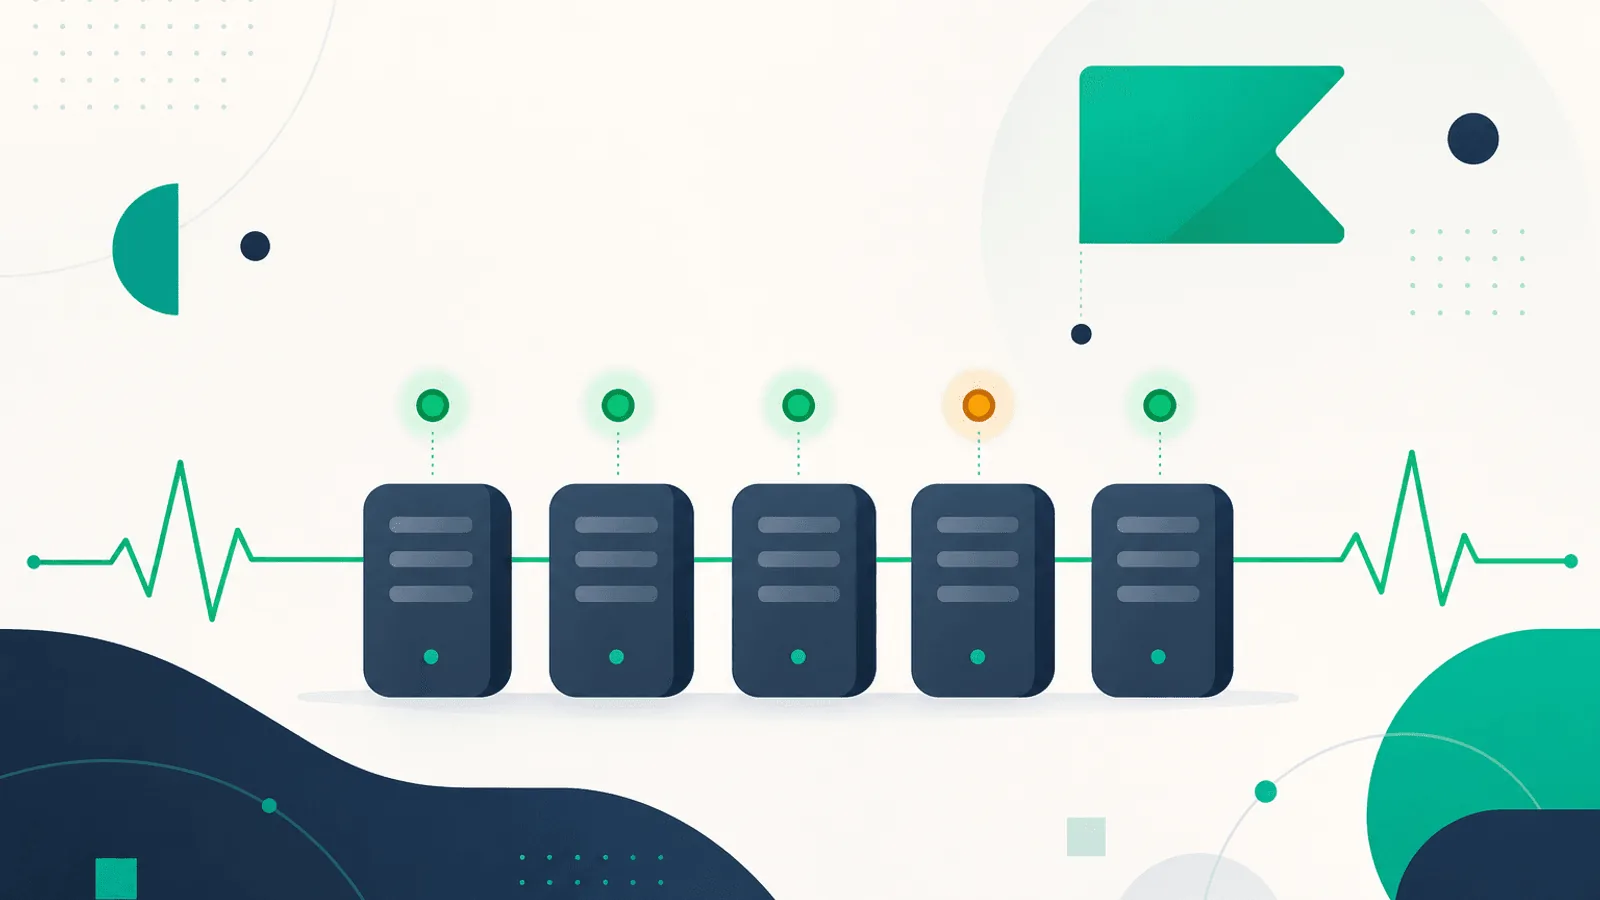
Server Monitoring Basics: Uptime, Reachability, and Response Checks
Server monitoring starts with uptime, reachability, and response checks. Learn what to monitor first and how to catch failures before users notice.
SMS Alerts for Website Downtime: Setup Guide
Get text messages the moment your website goes down. Learn how to set up SMS downtime alerts, reduce false positives, and wake the right person fast.
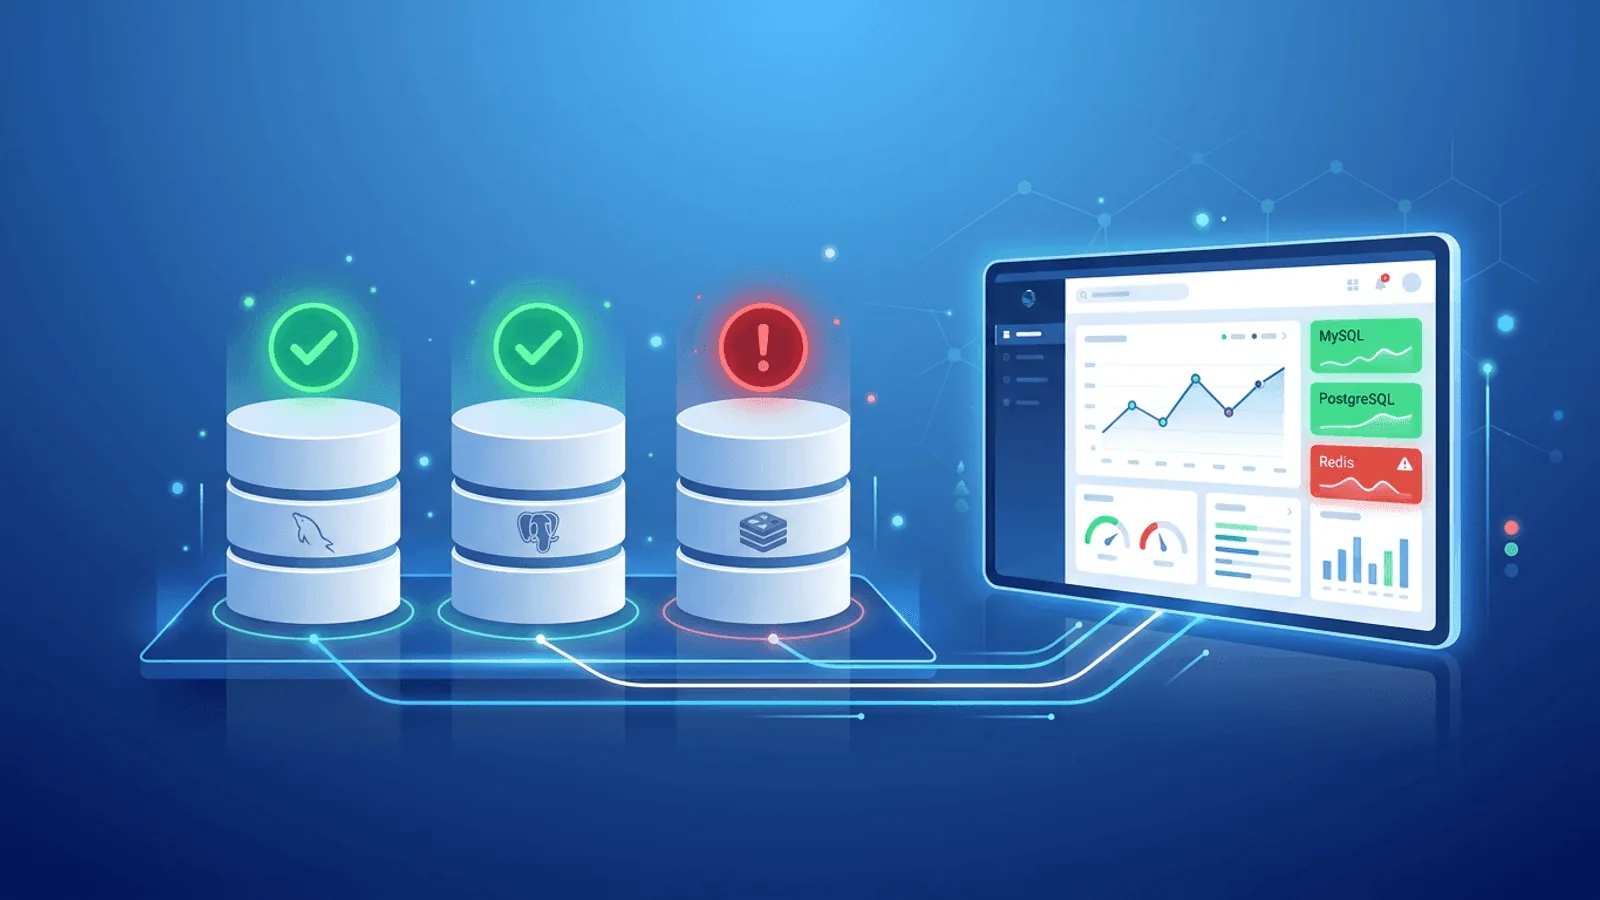
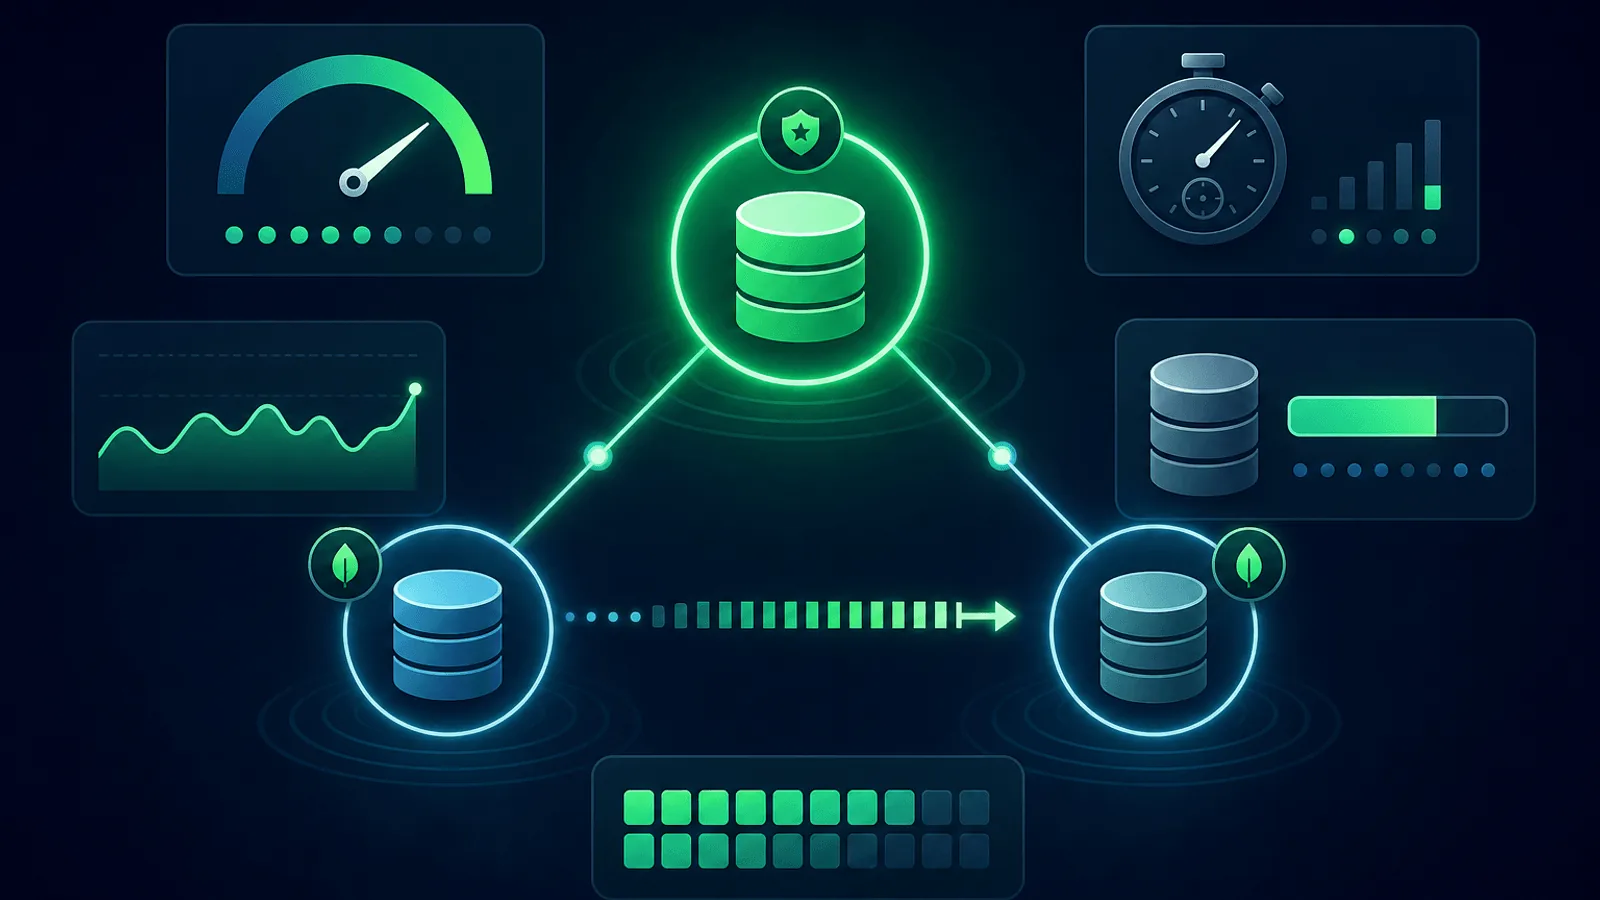
Database Monitoring: How to Monitor MySQL, PostgreSQL, and Redis Uptime
Database downtime brings your entire application down. Learn how to monitor MySQL, PostgreSQL, and Redis uptime, connectivity, and performance from outside.
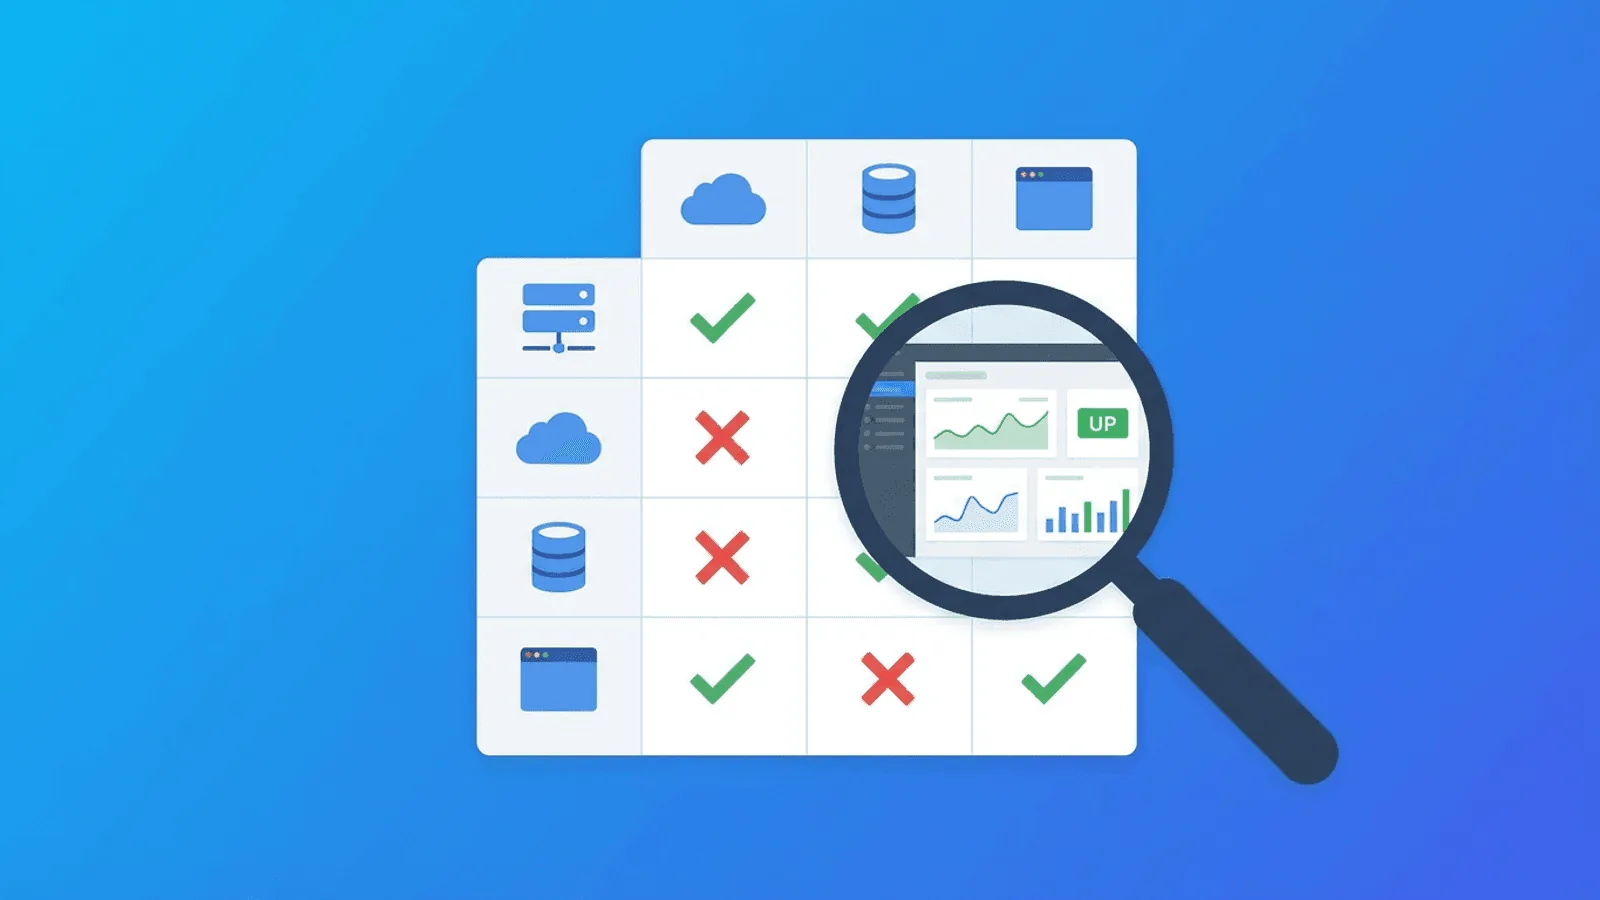
How to Choose a Website Monitoring Tool: The Complete Buyer's Guide
Not all monitoring tools are equal. This buyer's guide covers the features that matter, red flags to avoid, and how to find the right fit for your team.
Docker Container Monitoring: Why HEALTHCHECK Isn't Enough
Docker HEALTHCHECK only sees inside the container. Learn to catch OOMKilled restarts, crash loops & port binding failures with external monitoring.
Kubernetes Monitoring: Health Checks, Pod Uptime, and Alerting
Kubernetes clusters fail in ways that traditional monitoring misses. Learn how to monitor pod health, service endpoints, and set up alerts for K8s downtime.
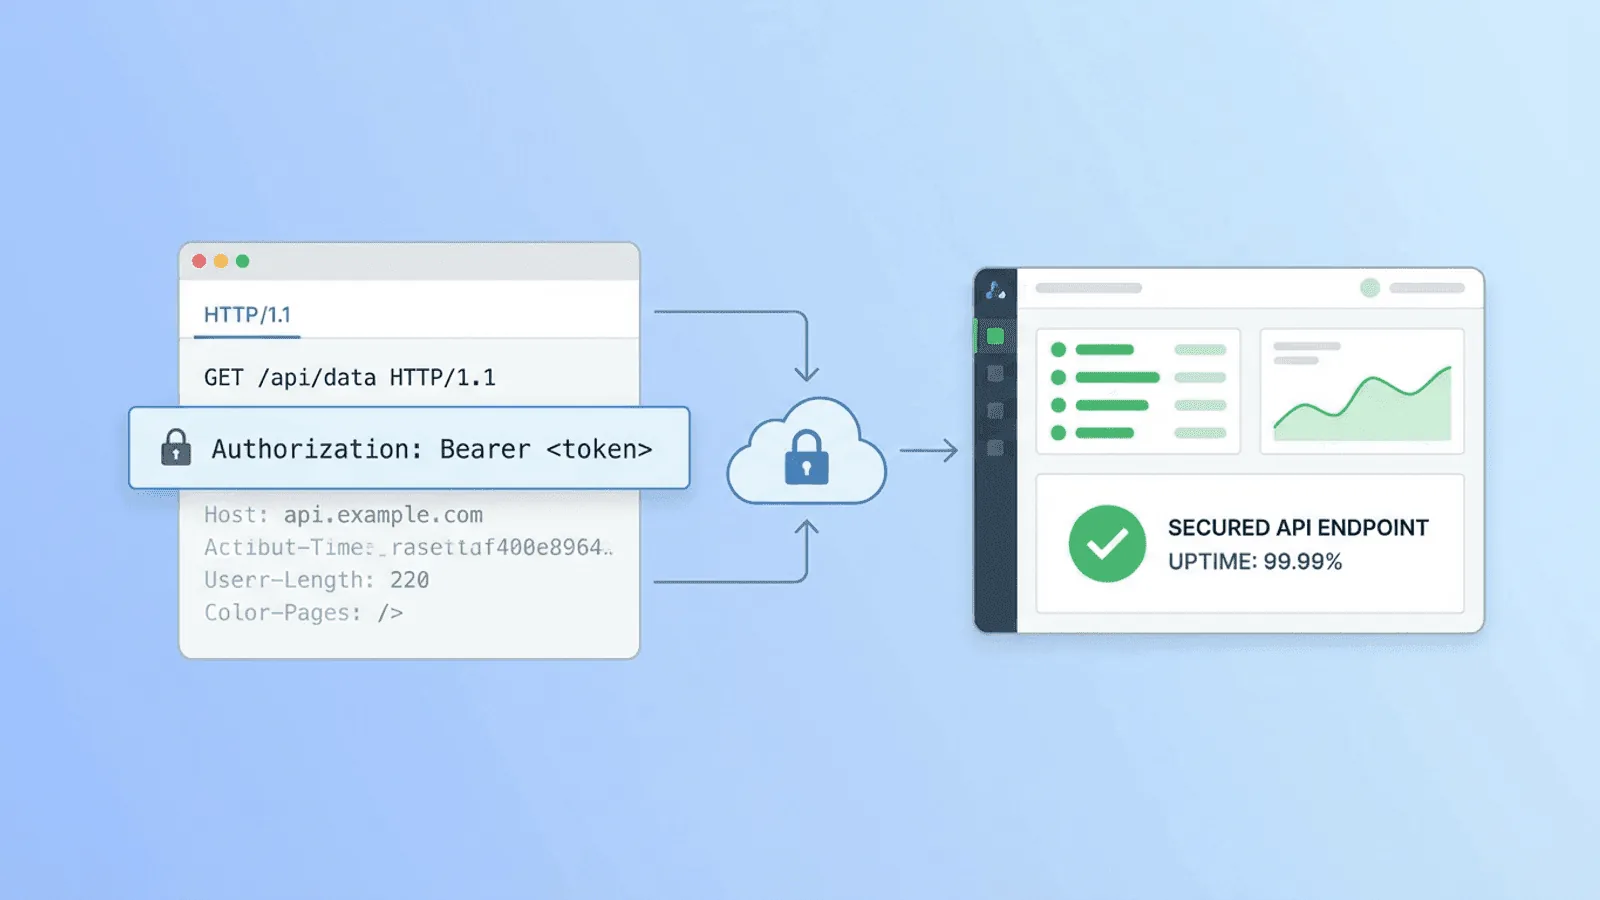
How to Monitor Authenticated APIs: Bearer Tokens, API Keys, and Custom Headers
Most monitoring tools only check public URLs. Here's how to set up uptime monitoring for APIs that require authentication — bearer tokens, API keys, and custom headers.
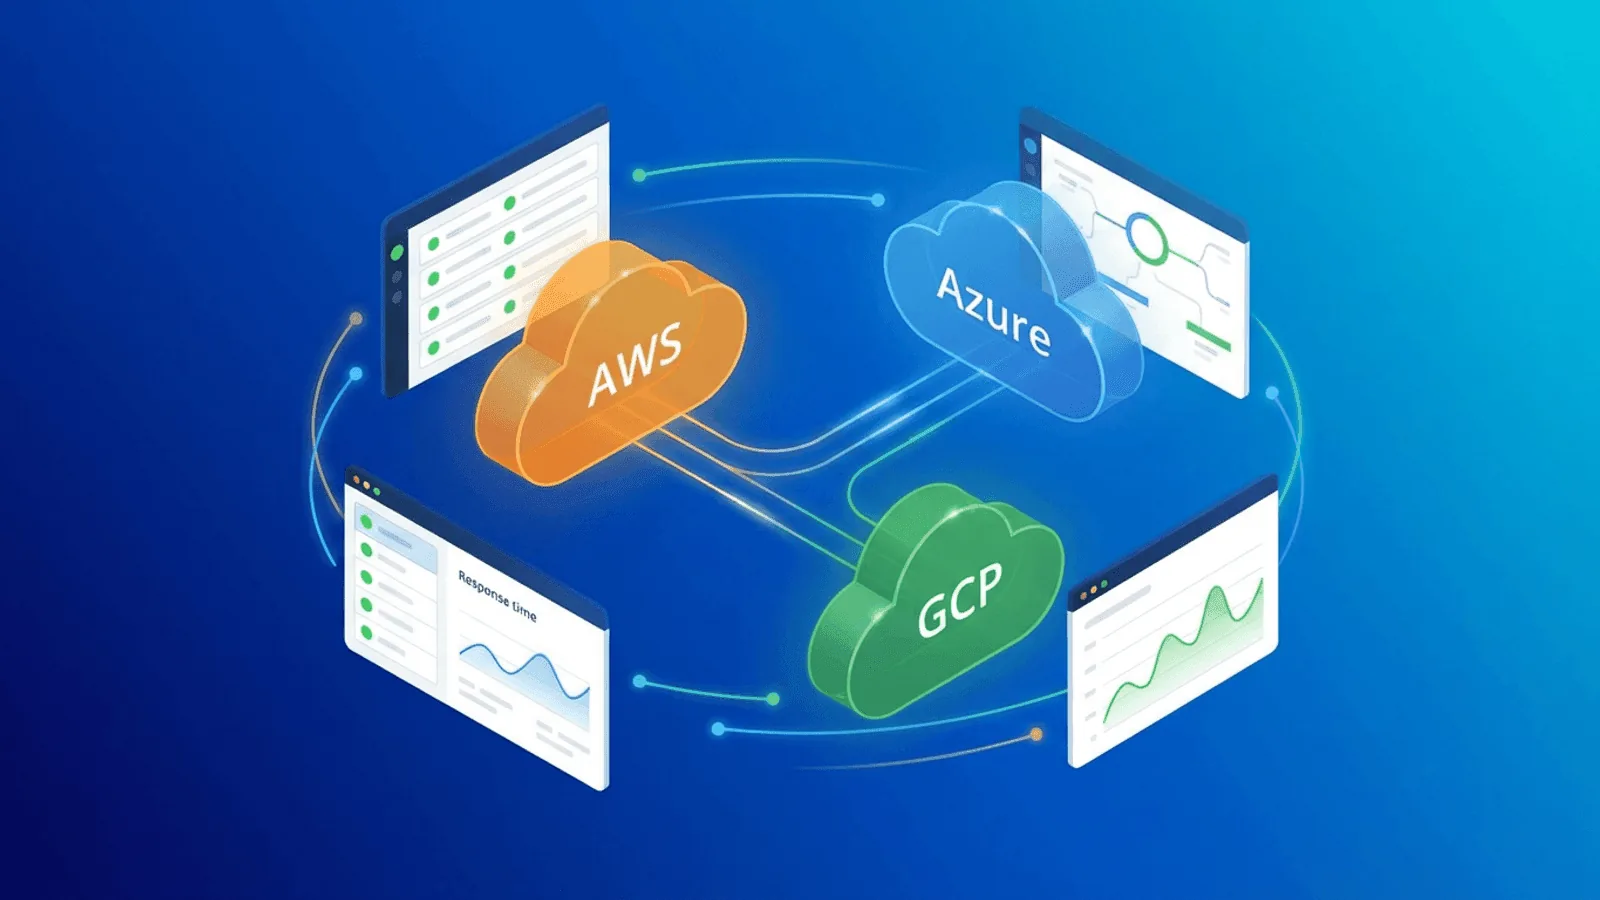
Cloud Infrastructure Monitoring: AWS, Azure, and GCP Uptime Best Practices
Your cloud provider's uptime isn't your uptime. Learn how to monitor AWS, Azure, and GCP infrastructure externally and catch outages before users do.
How to Monitor a Website During a Migration: Zero-Downtime Checklist
Website migrations break things. DNS changes, redirect chains, SSL gaps — this checklist covers what to monitor before, during, and after a migration.
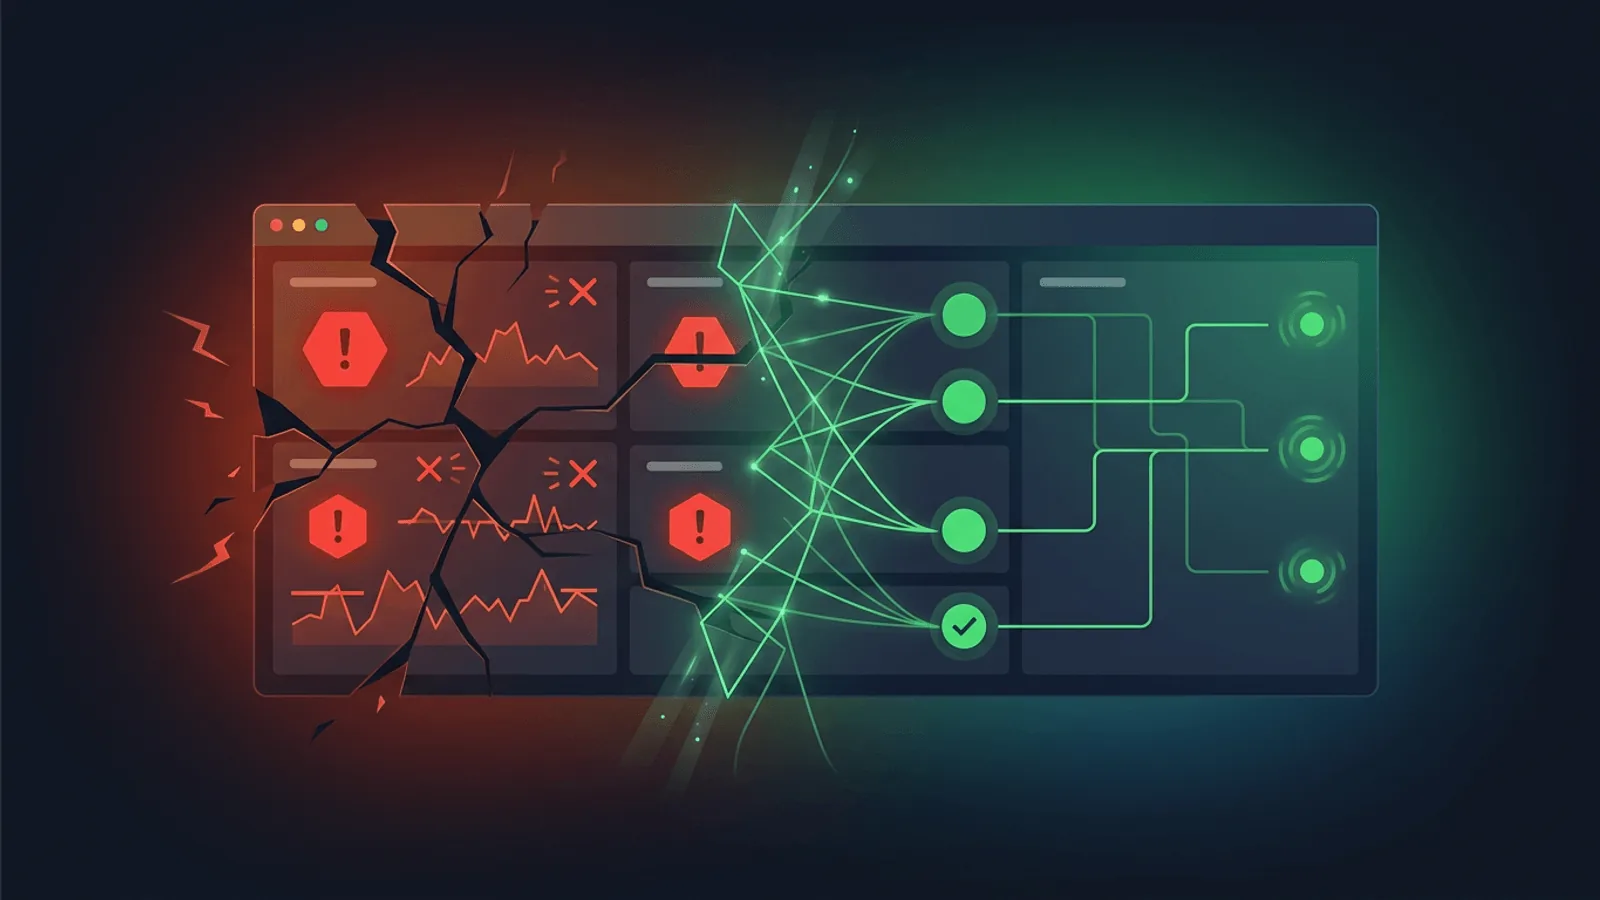
Observability vs Monitoring: What's the Difference and Which Do You Need?
Monitoring tells you when something breaks. Observability tells you why. Learn the real difference and how to decide what your team needs.
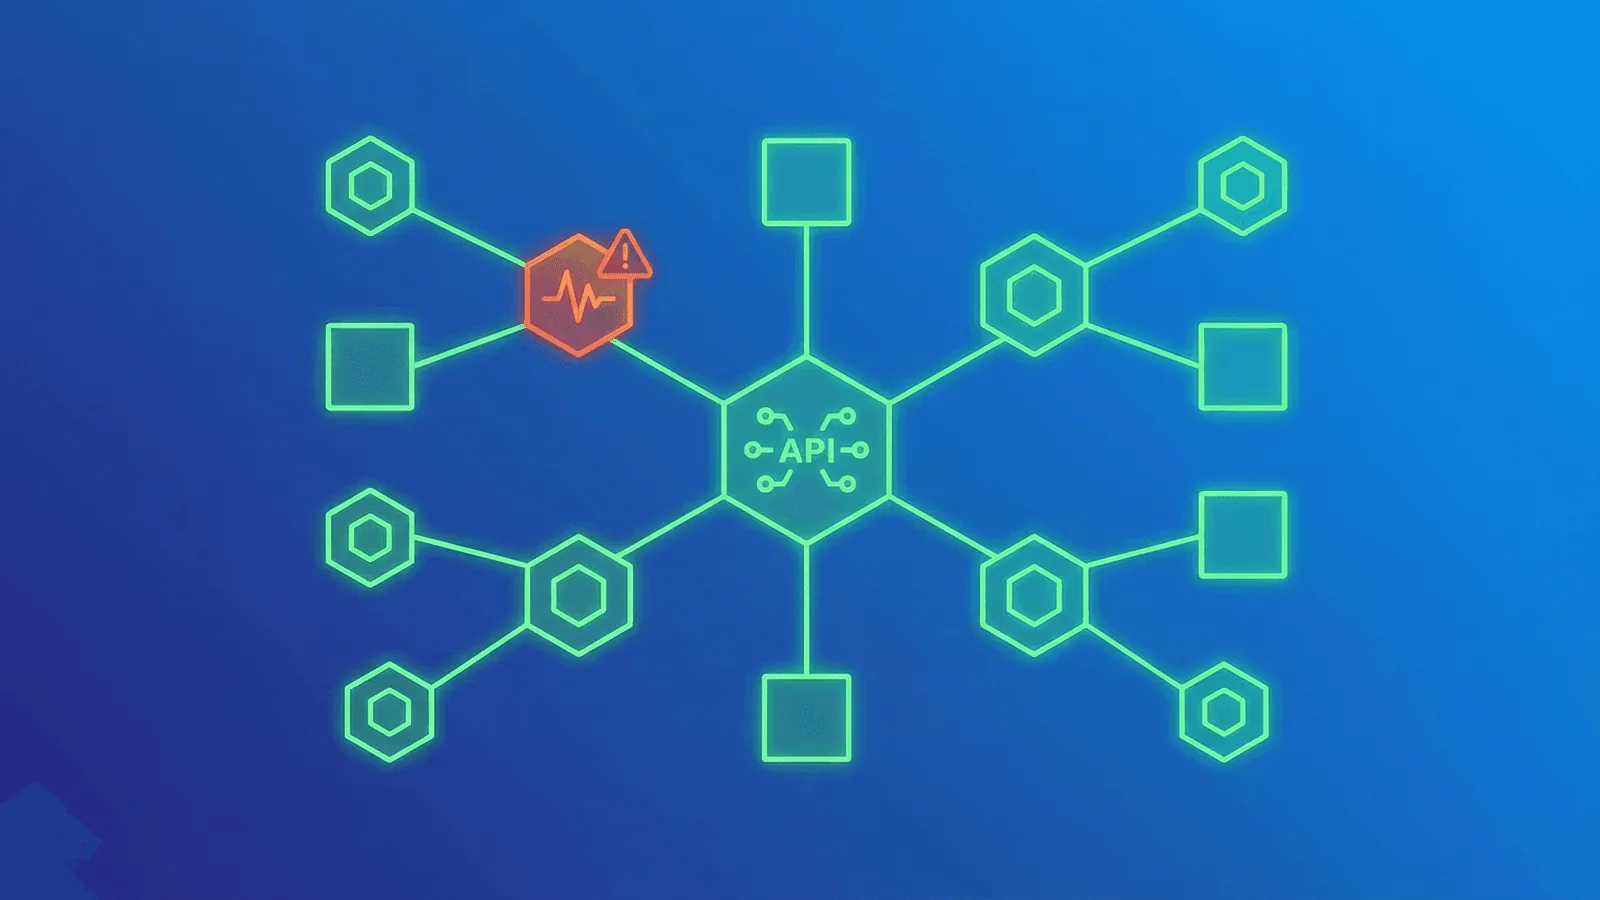
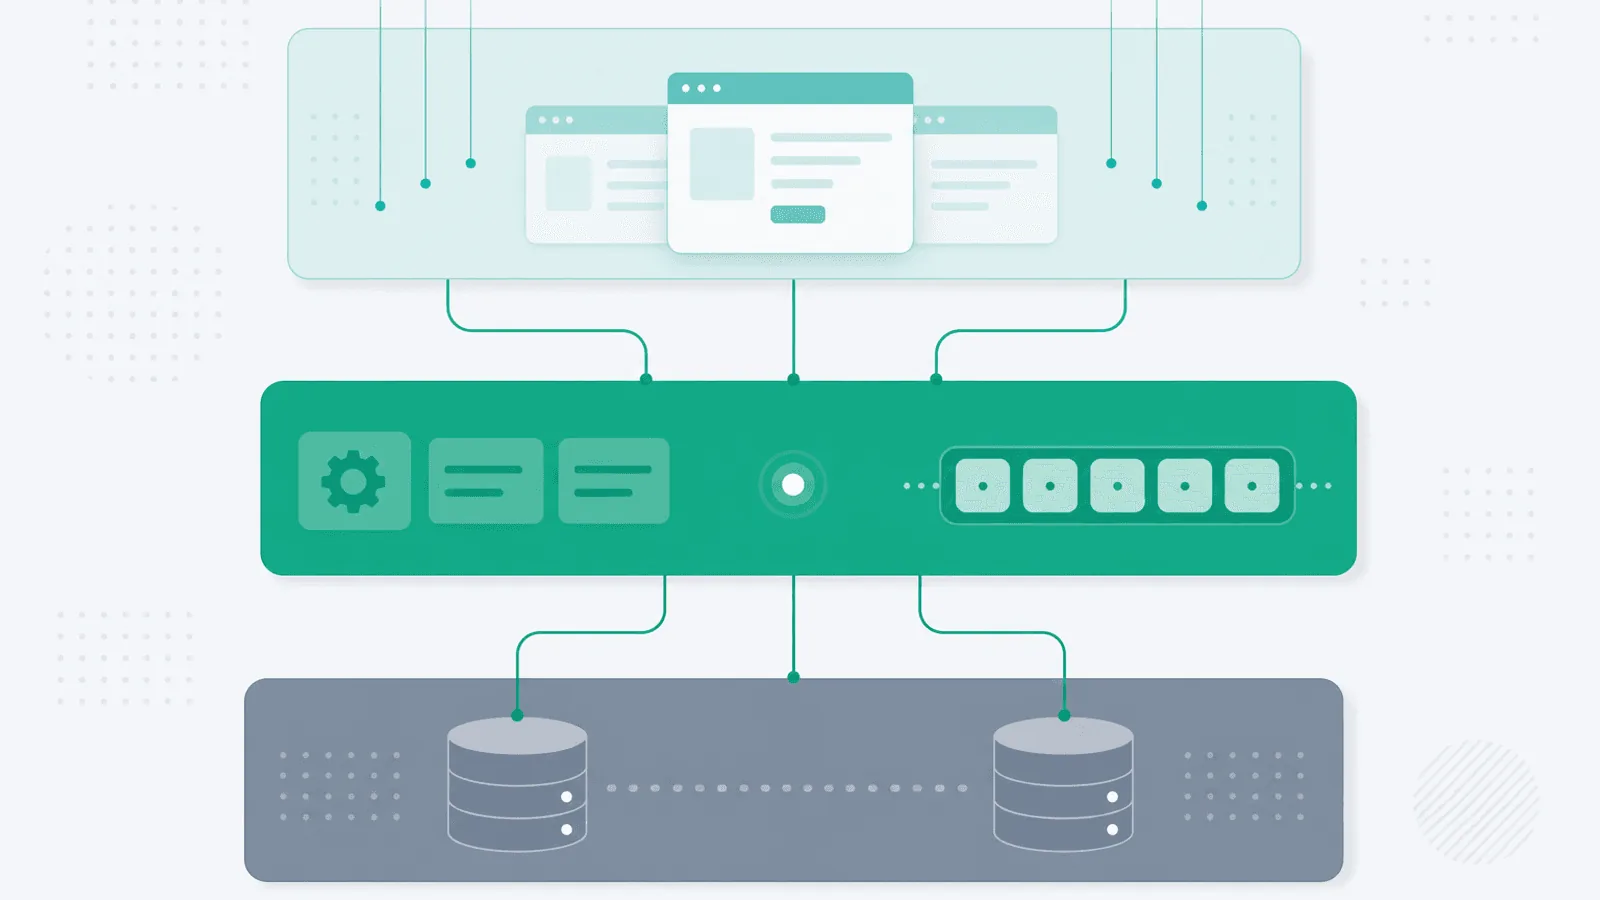
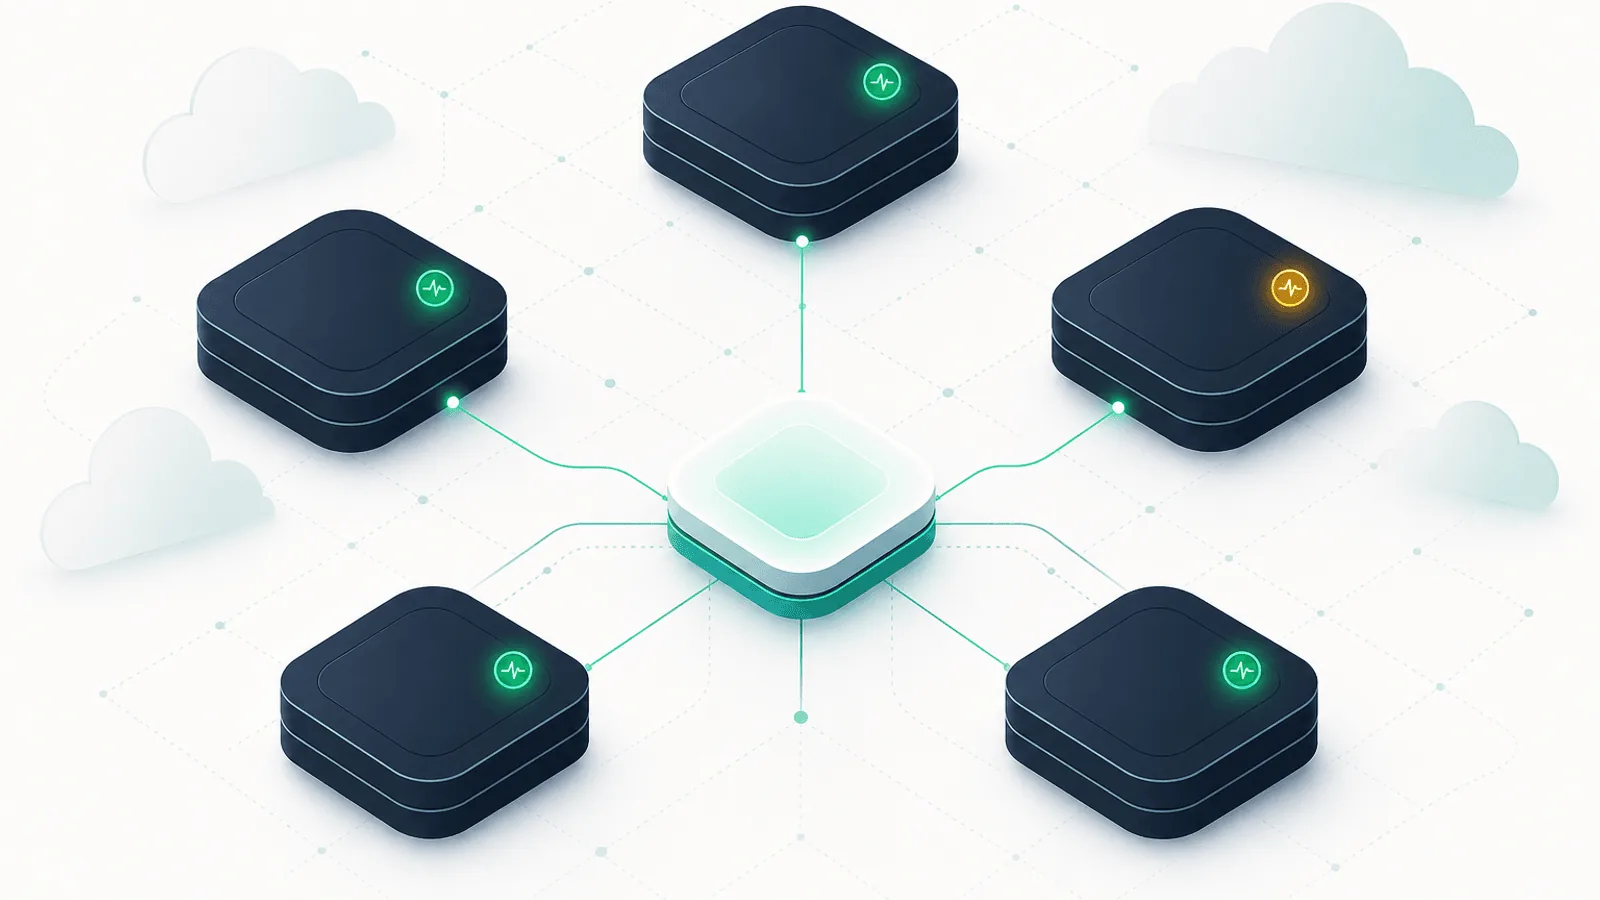
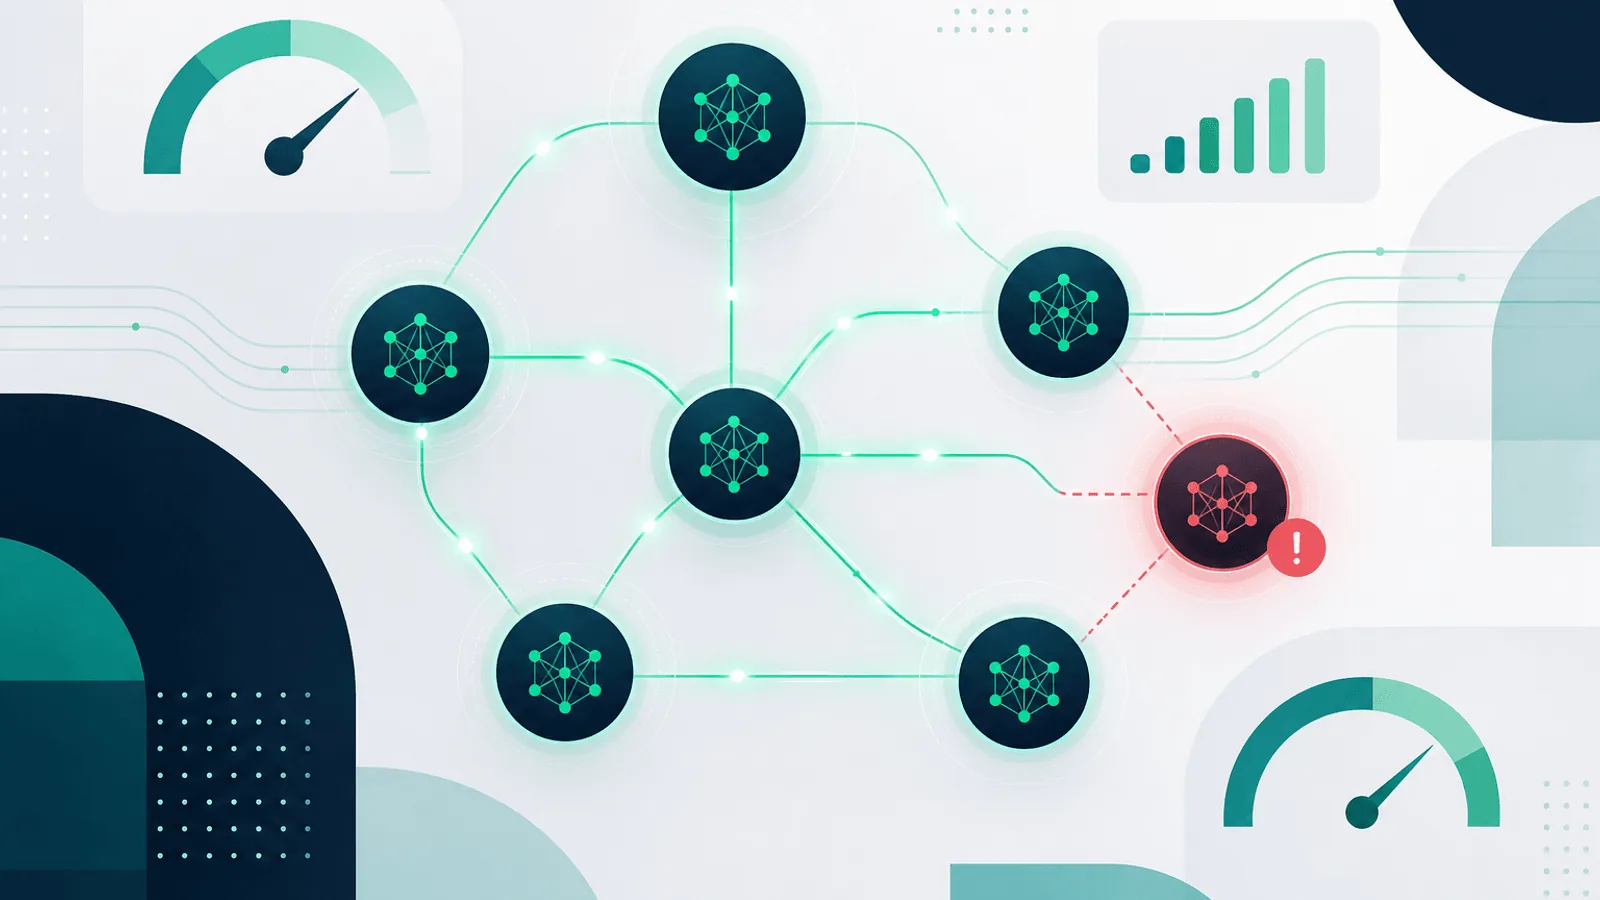
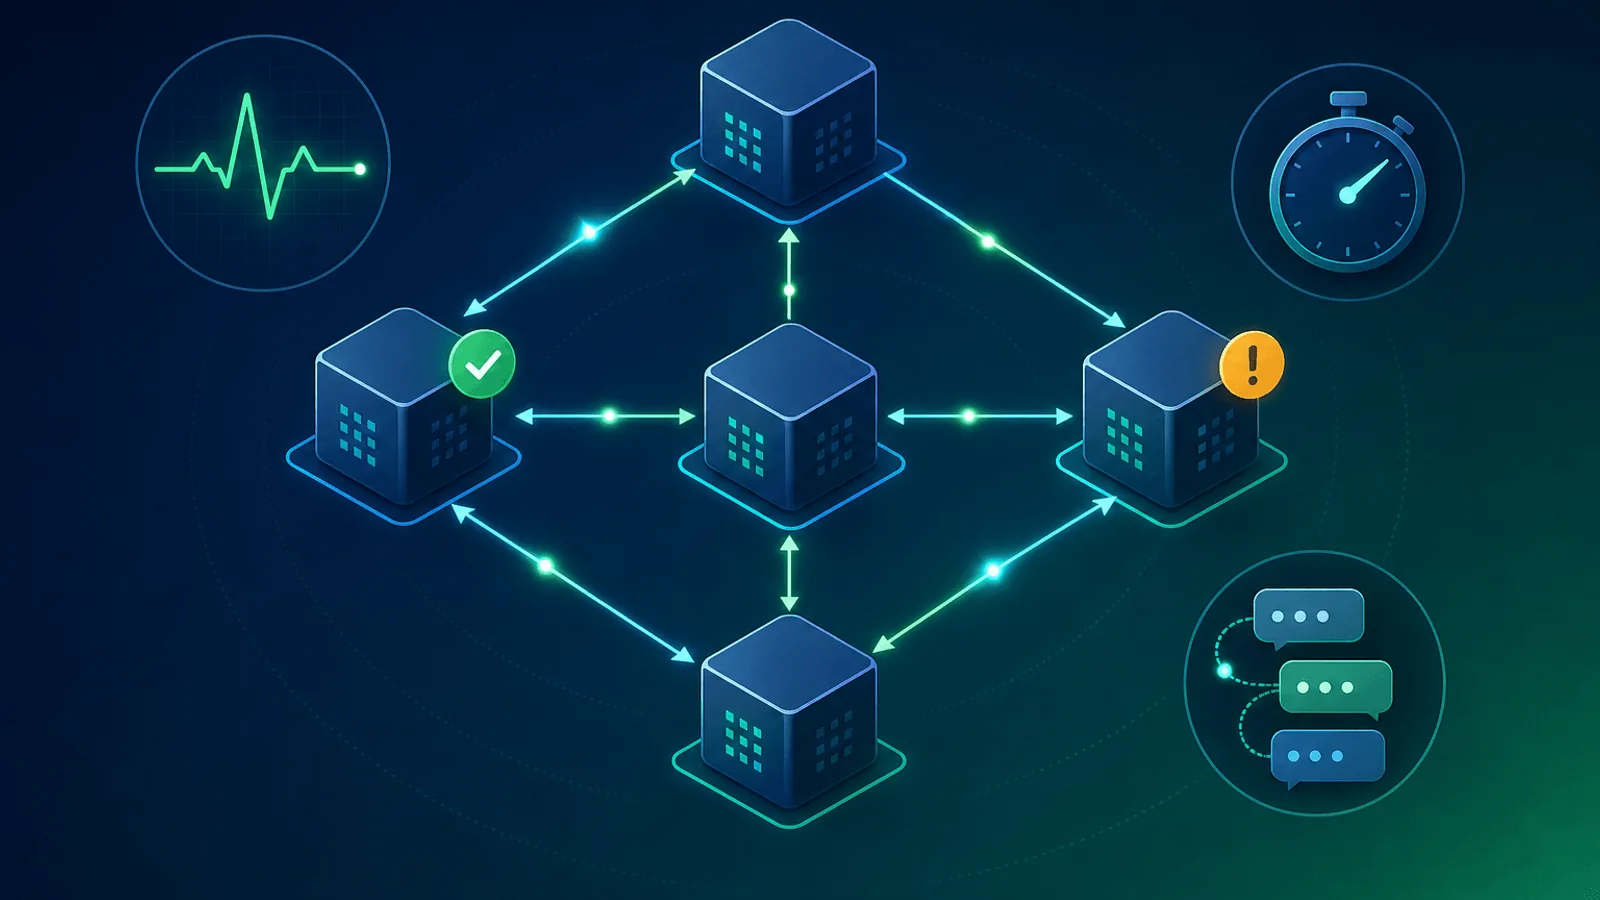
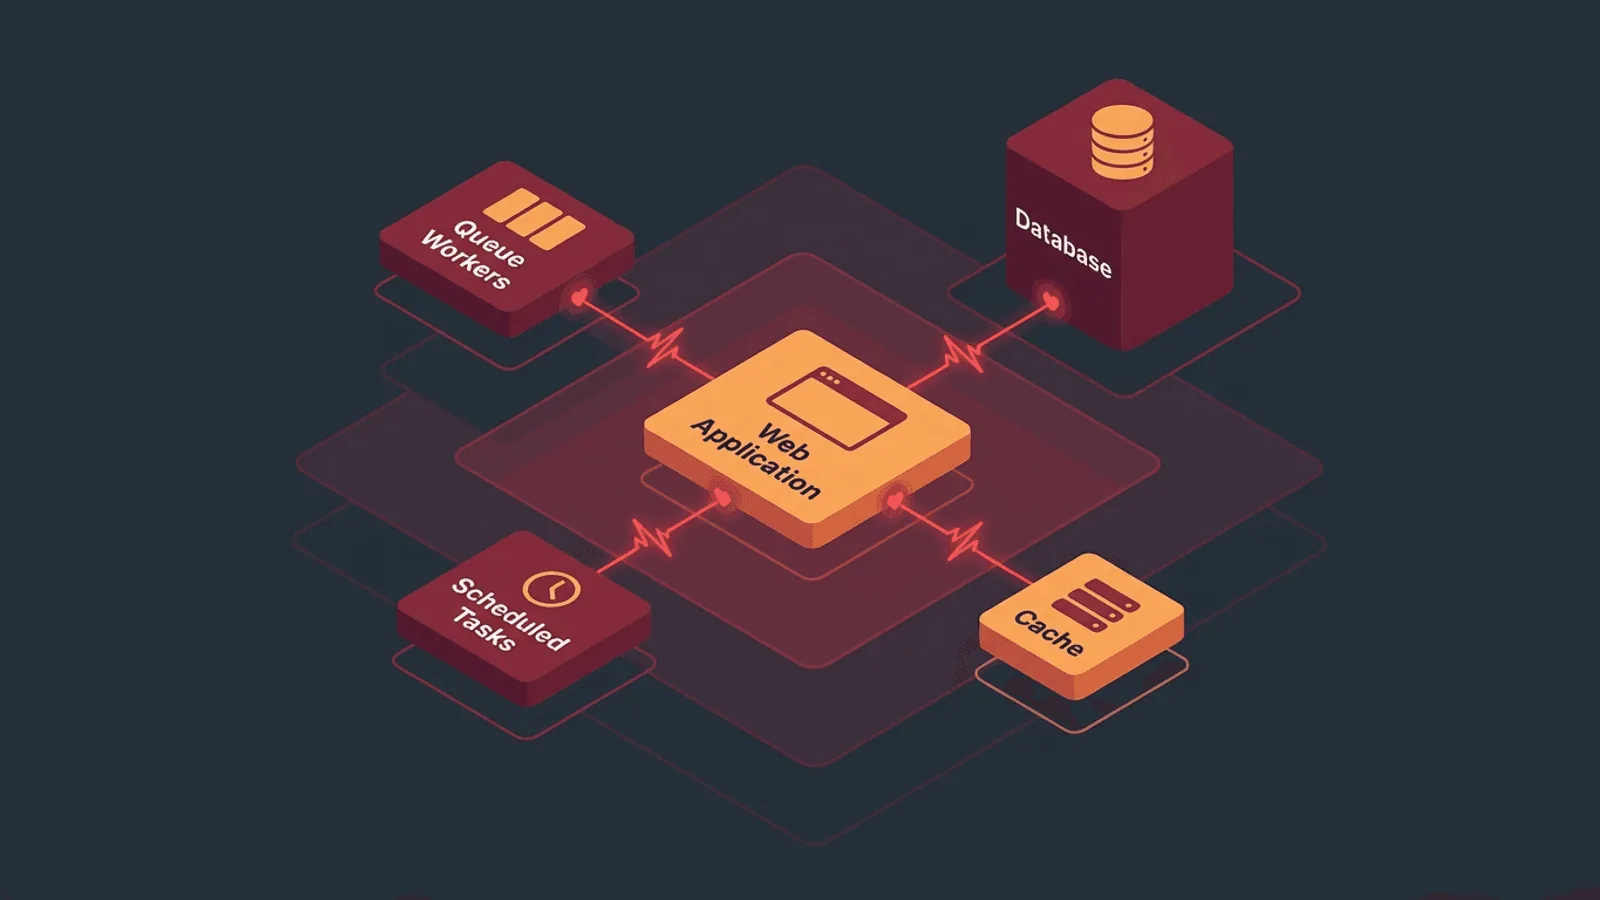
How to Monitor a Microservices Architecture: A Practical Guide
Microservices fail differently than monoliths. Learn how to monitor health, latency, and dependencies across distributed services effectively.
Monitoring for Startups: Set Up Reliability Before Your First 1,000 Users
You don't need a platform team to monitor your product. Here's the practical startup playbook — what to monitor, when, and how to grow into it.
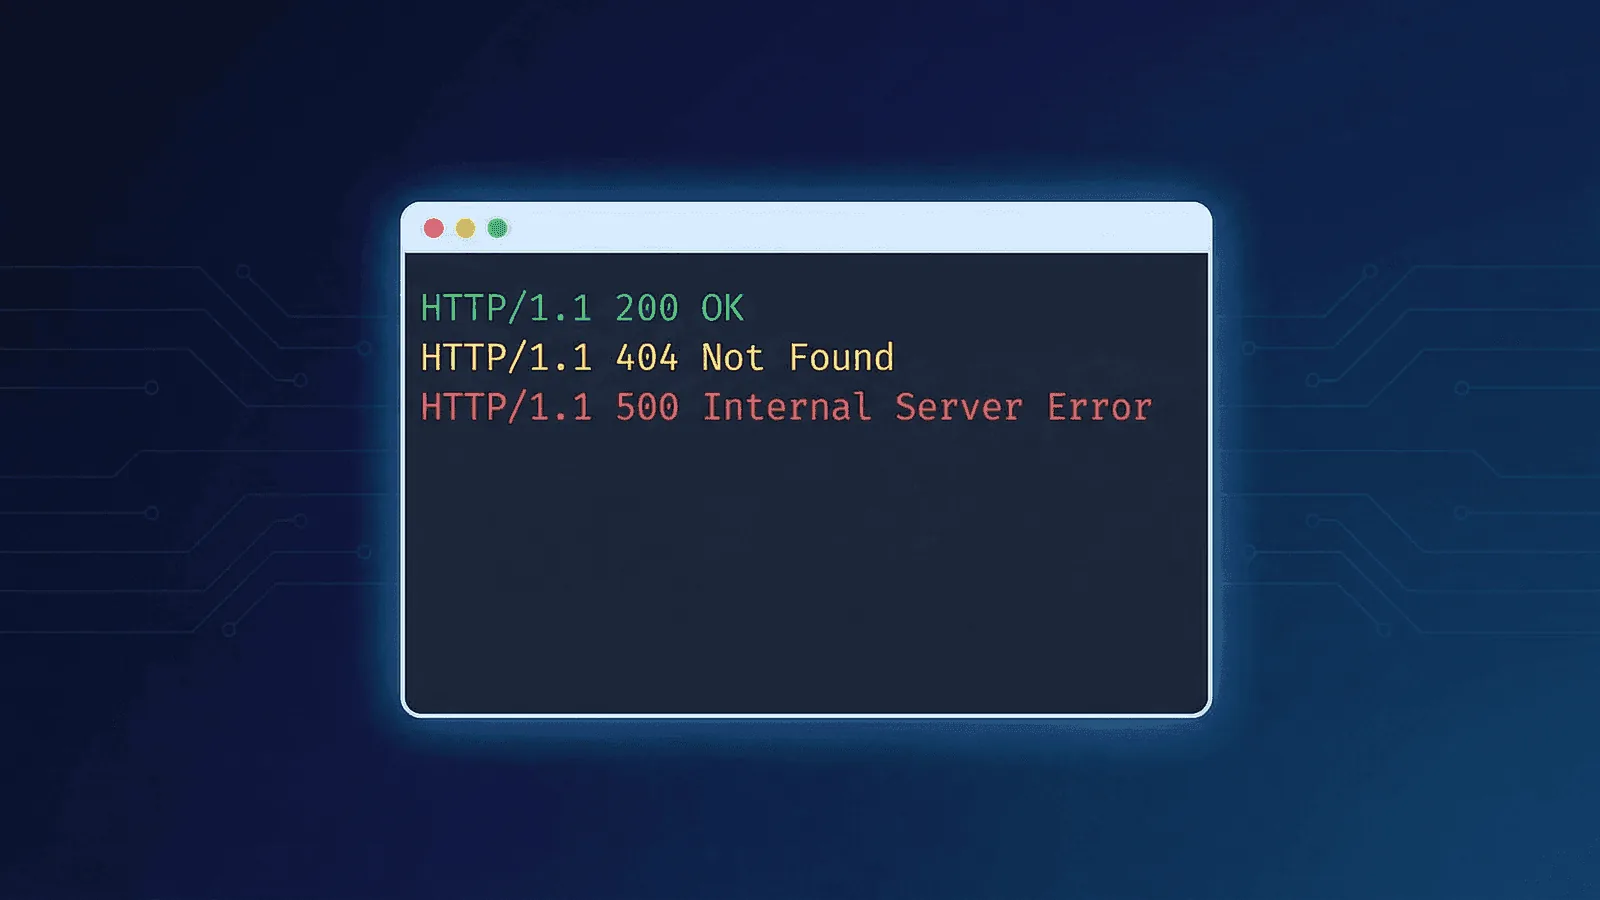
HTTP Status Codes Explained: A Complete Guide for Website Monitoring
Every HTTP status code explained — from 200 OK to 503 Service Unavailable. Learn which codes matter for uptime monitoring and when to alert.
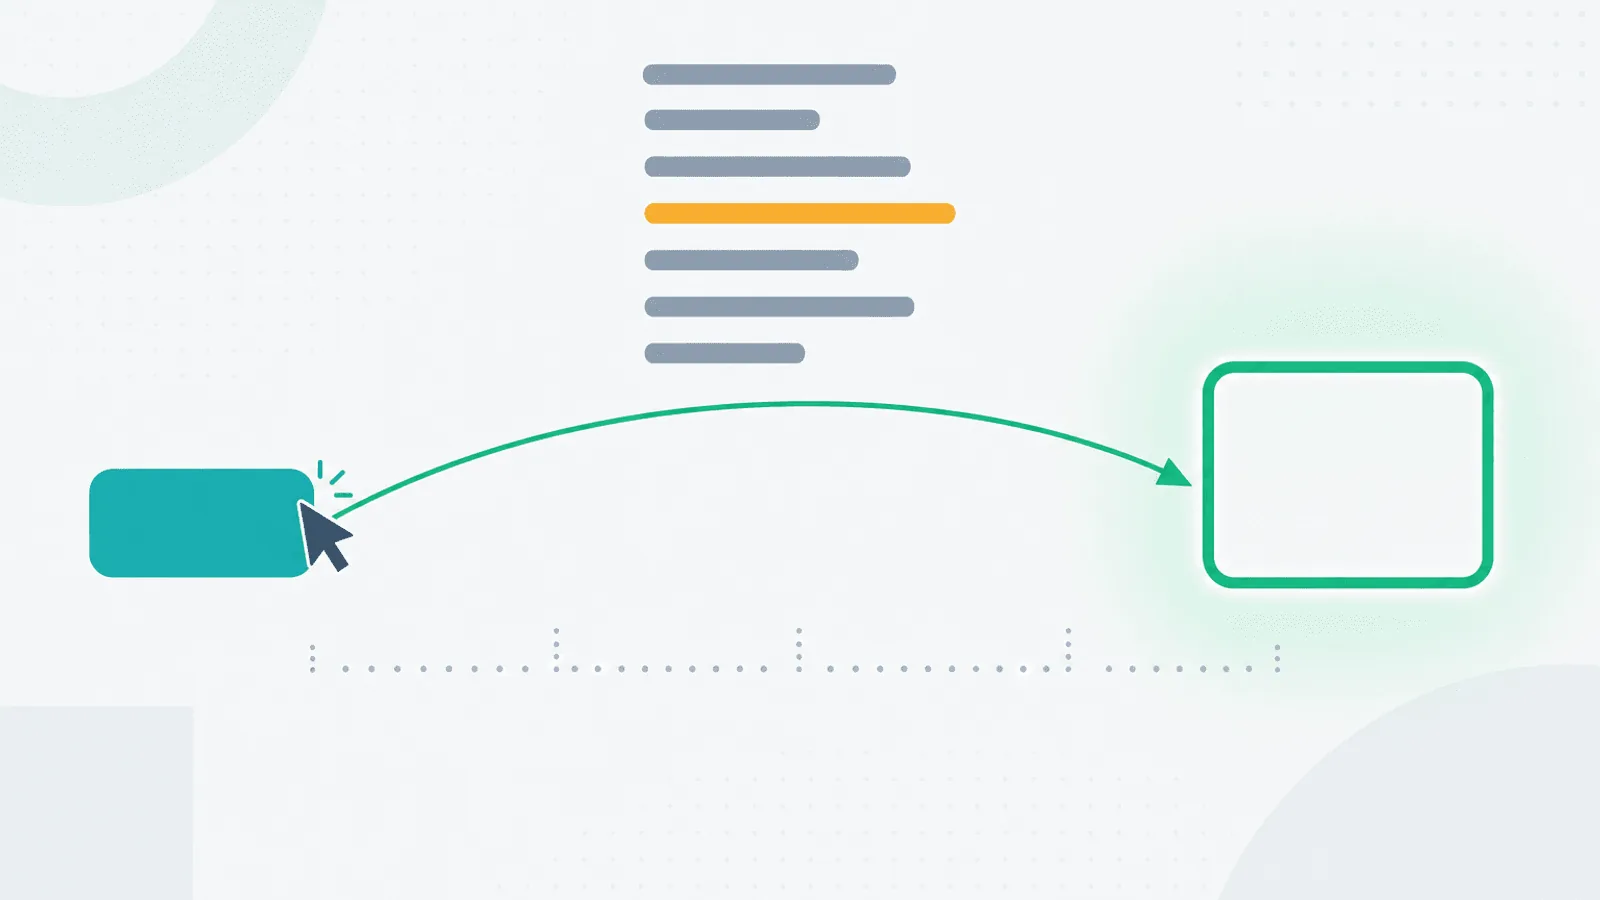
What Is Uptime Monitoring? A Complete Beginner's Guide
Uptime monitoring explained: what it is, how it works, and why your website needs it. Simple guide for beginners.
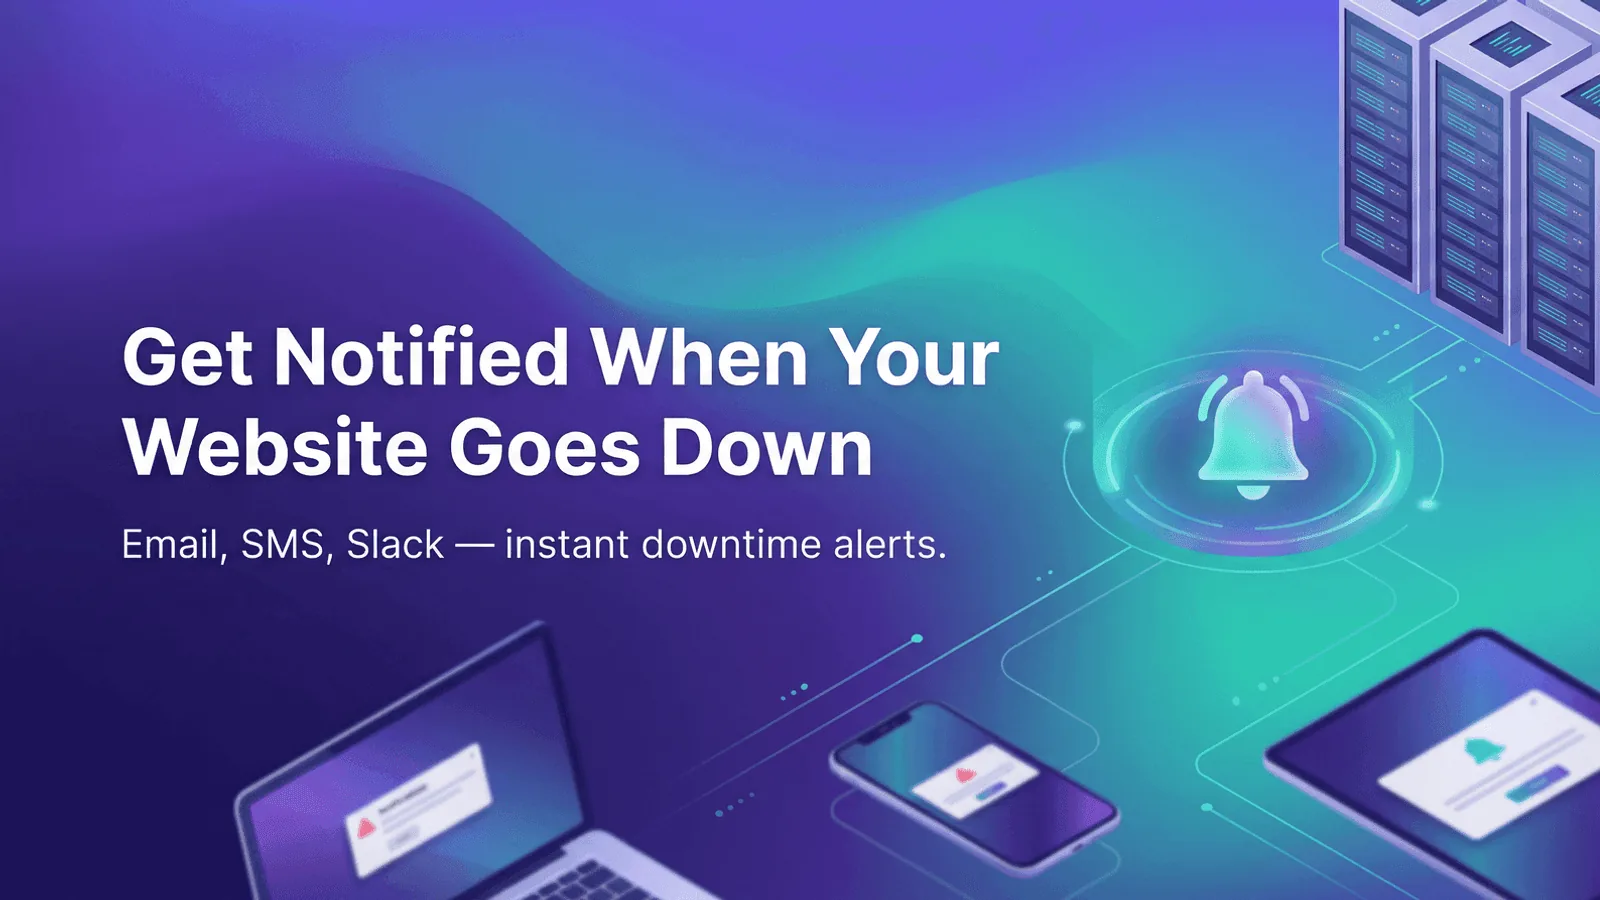
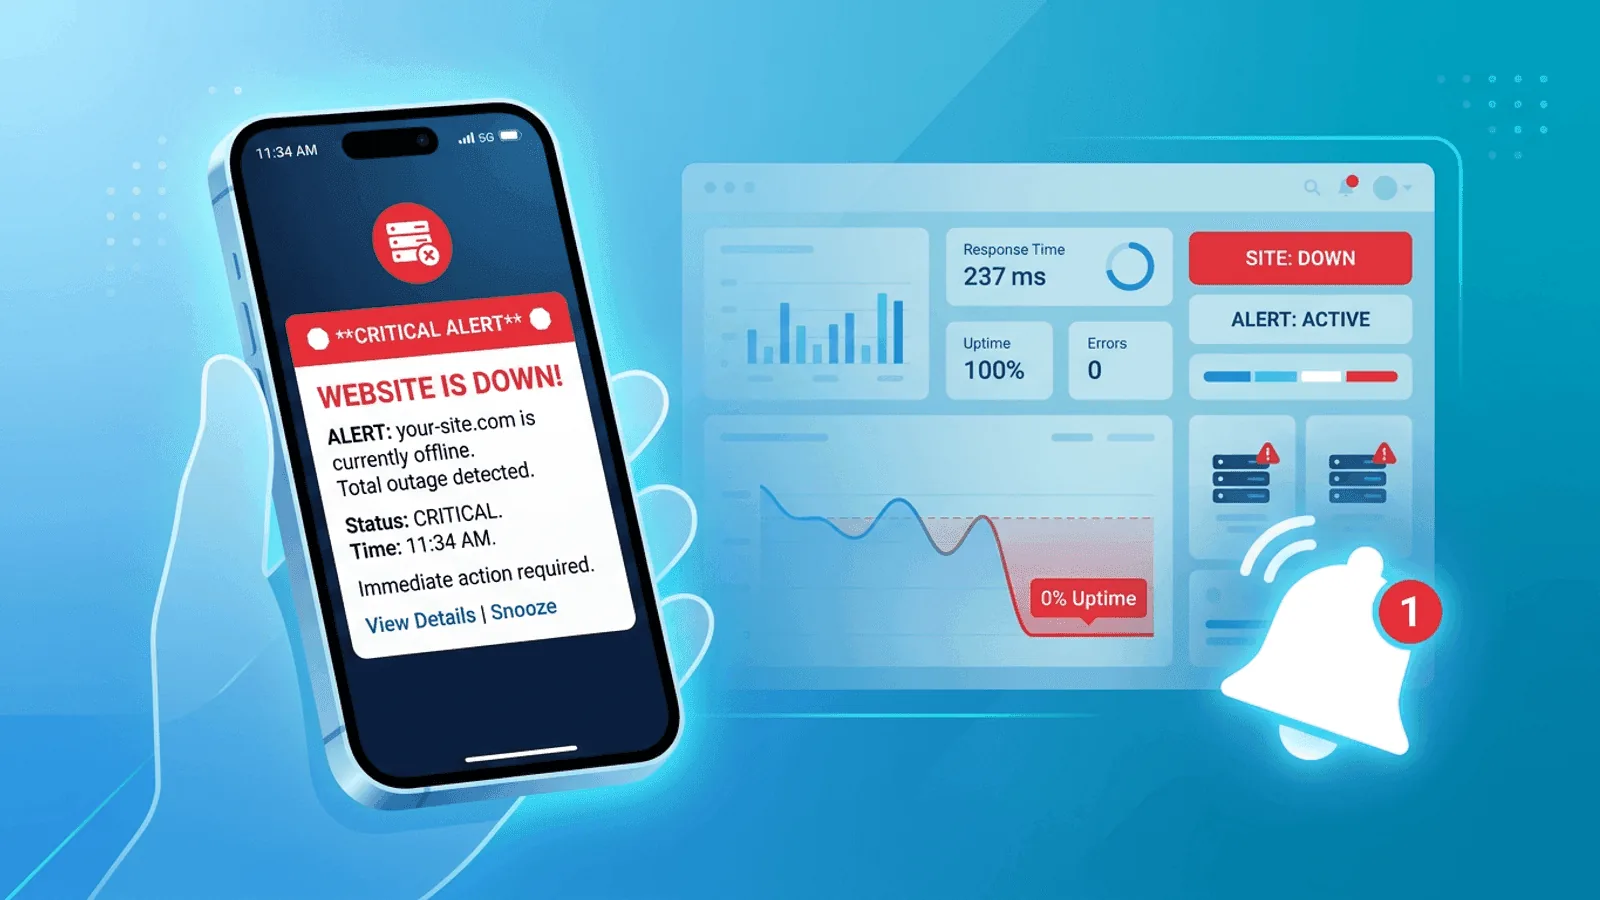
How to Get Notified When Your Website Goes Down
Set up instant alerts when your site goes down. Email, SMS, Slack, and more. A step-by-step guide to downtime notifications.

Website Monitoring for Agencies: Keep Client Sites Online
Monitor all your client websites from one place. Uptime monitoring for agencies: best practices, reporting, and staying proactive.
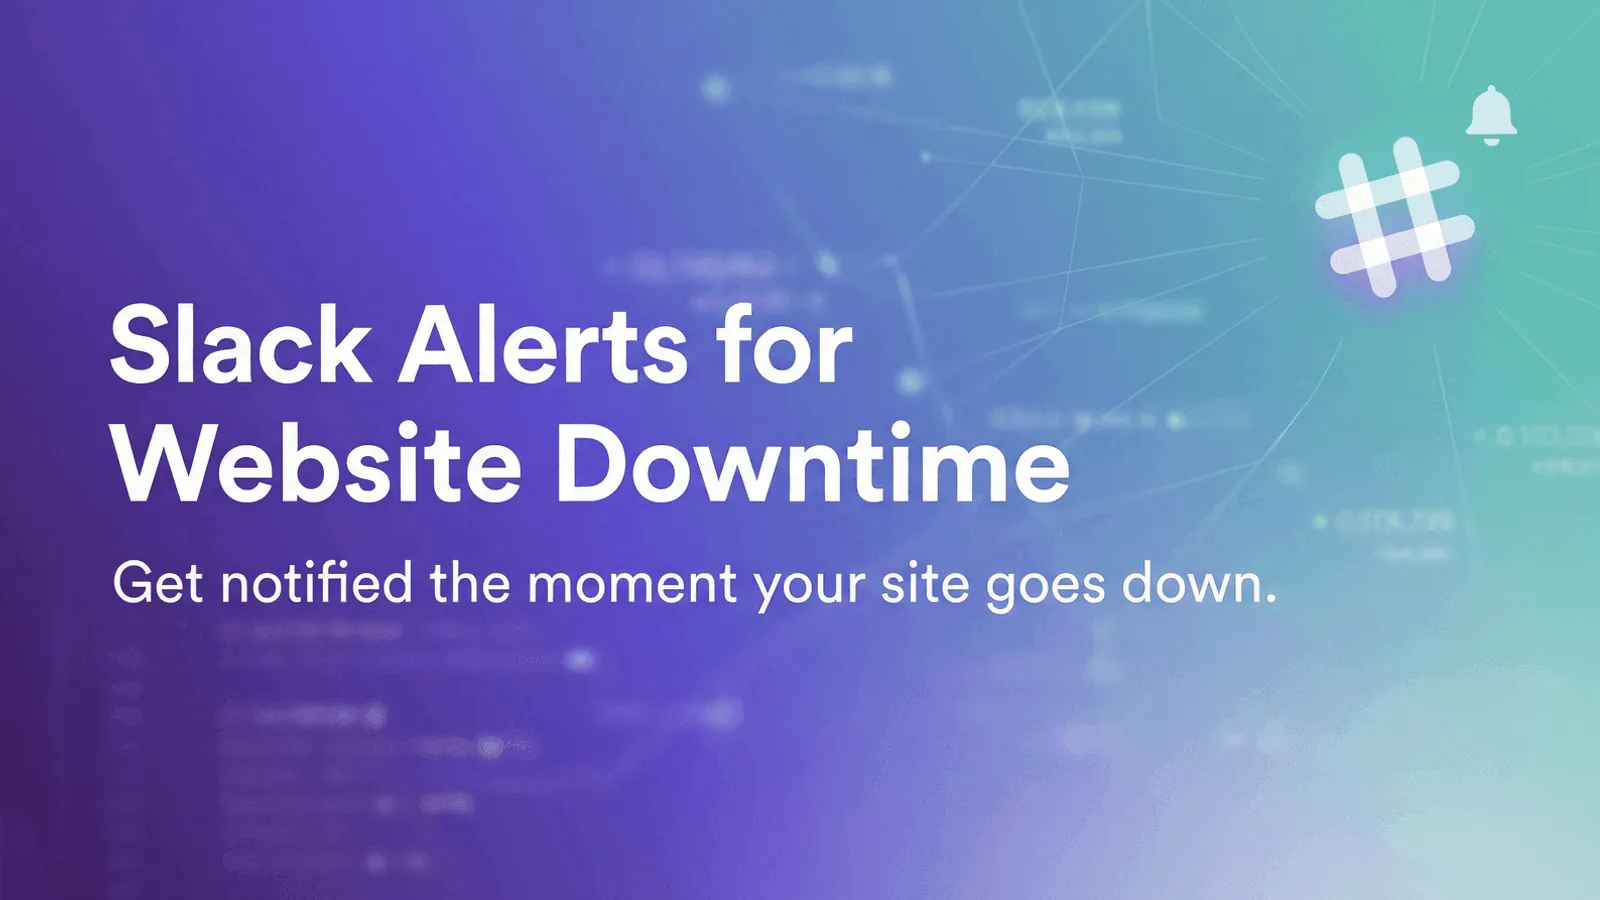
How to Set Up Slack Alerts for Website Downtime
Get Slack notifications the moment your website or API goes down. Step-by-step guide to downtime alerts in Slack.
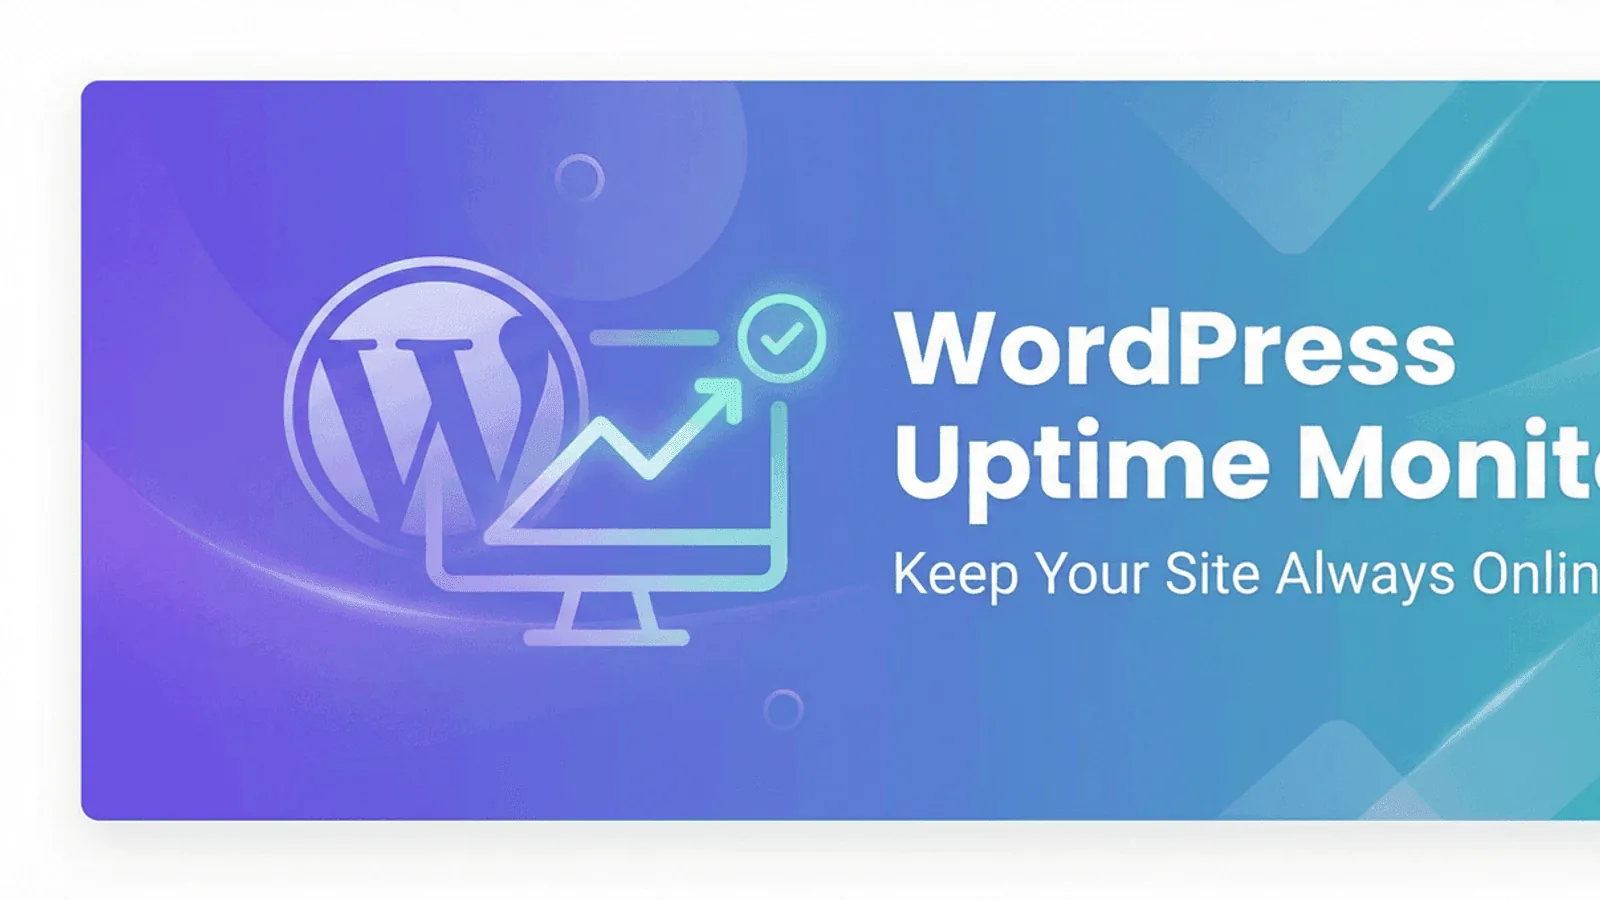
WordPress Uptime Monitoring: Keep Your Site Always Online
Monitor your WordPress site for downtime, slow performance, and plugin issues. A practical guide to uptime monitoring for WP.
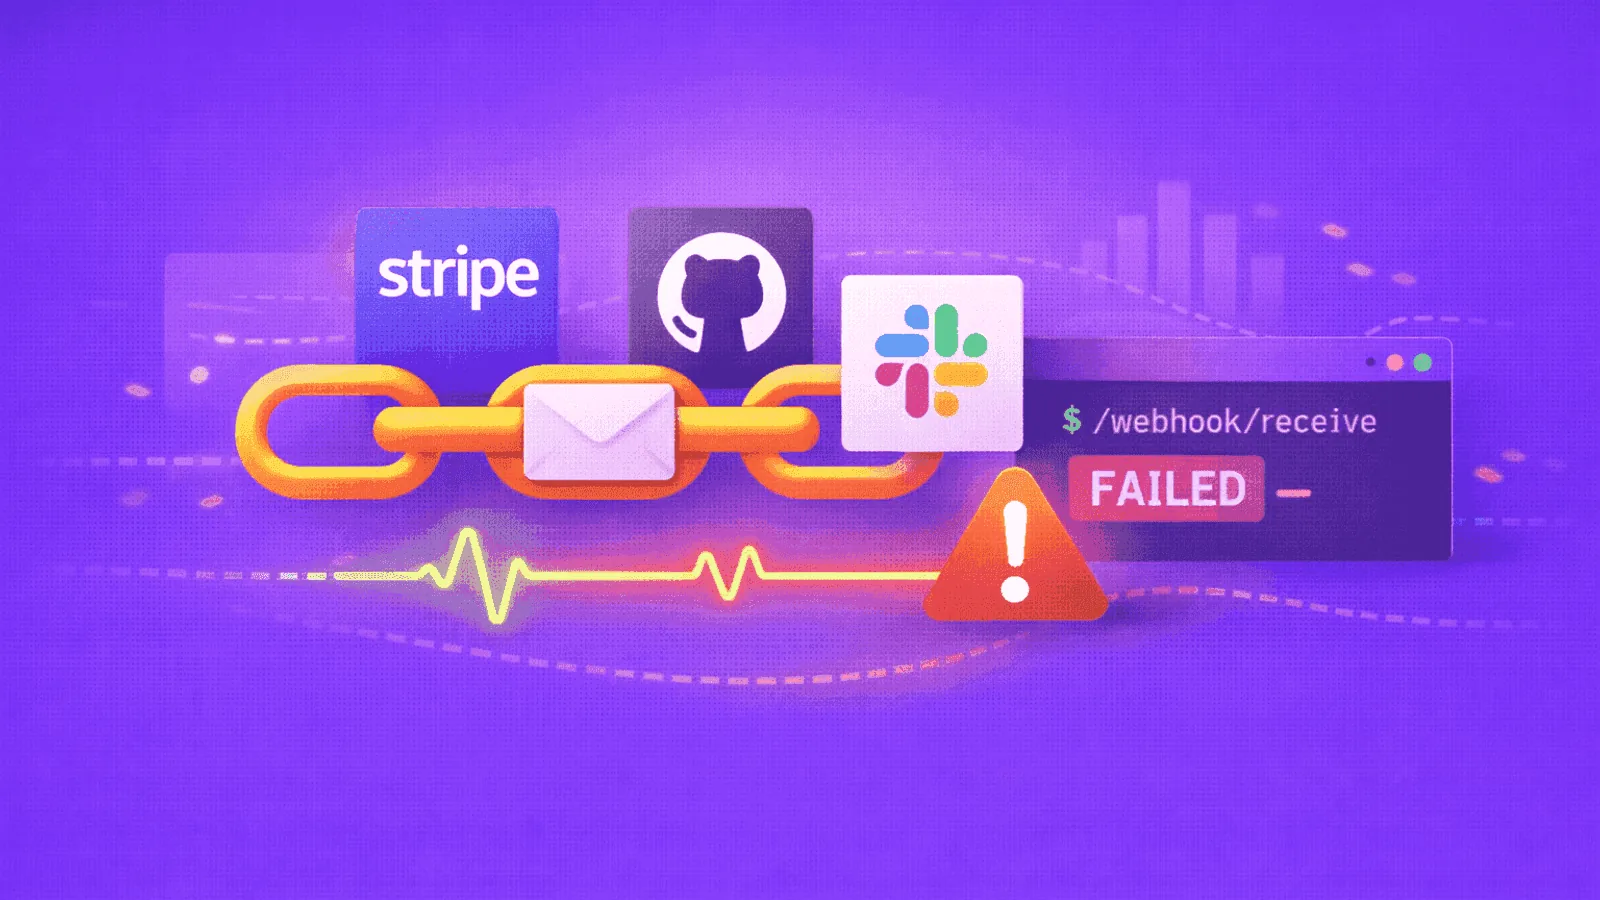
Webhook Monitoring Guide: Detect Failed Deliveries Fast
Webhooks fail silently and break integrations for days. Learn to detect failed deliveries, processing gaps & permanent webhook errors before customers notice.
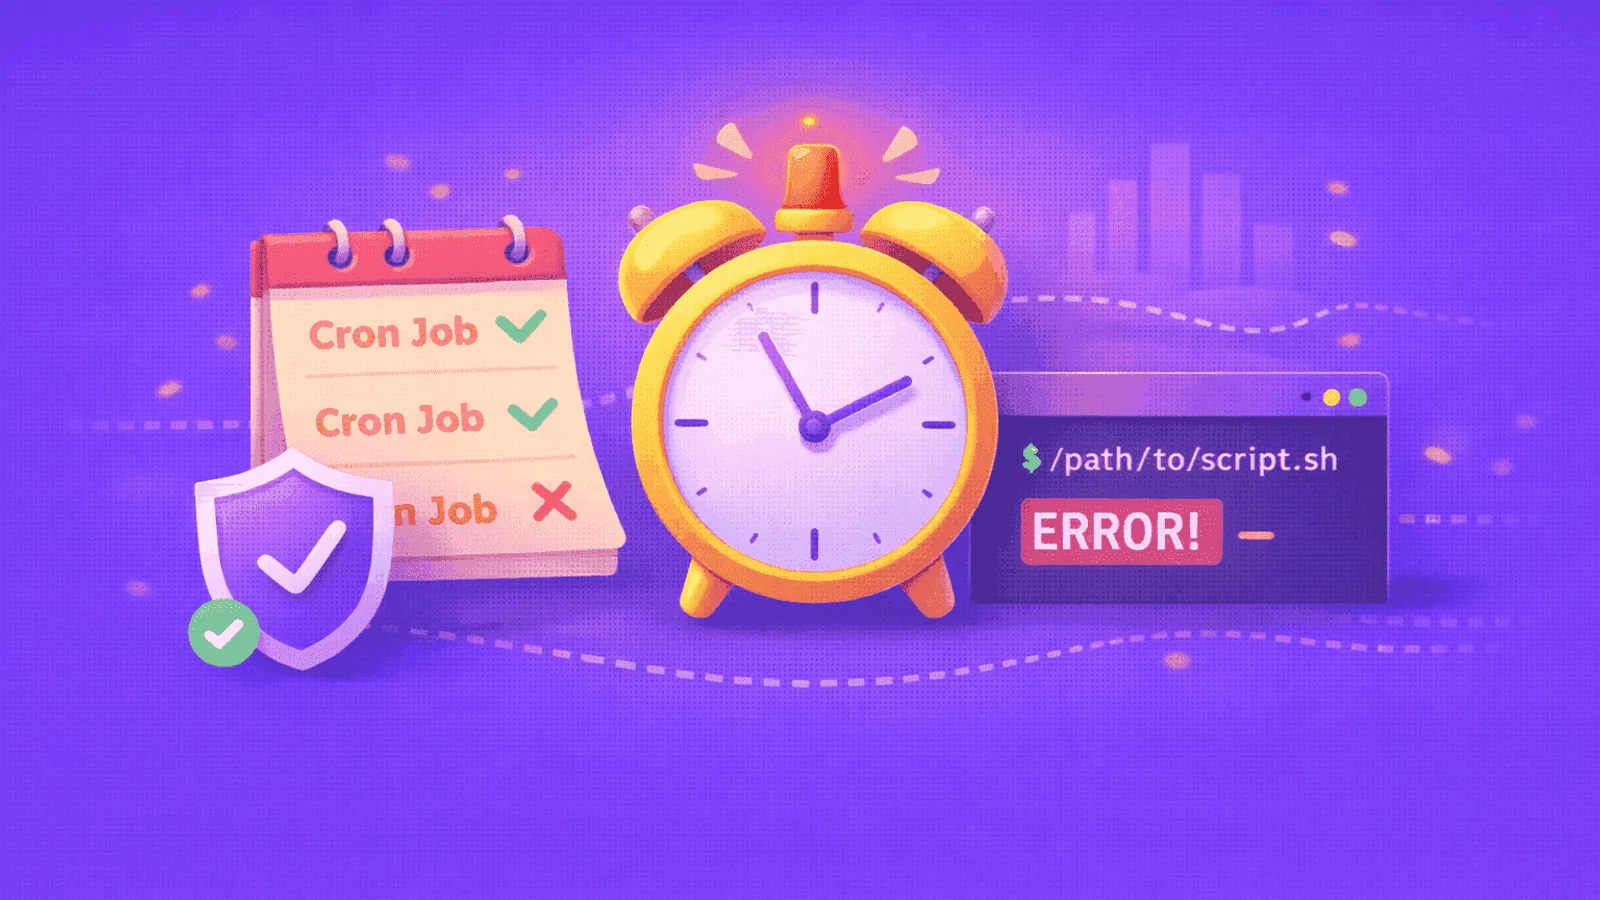
Cron Job Monitoring: Never Miss a Failed Background Task
Learn how to monitor cron jobs and background tasks. Catch silent failures before they cause data loss or angry customers.
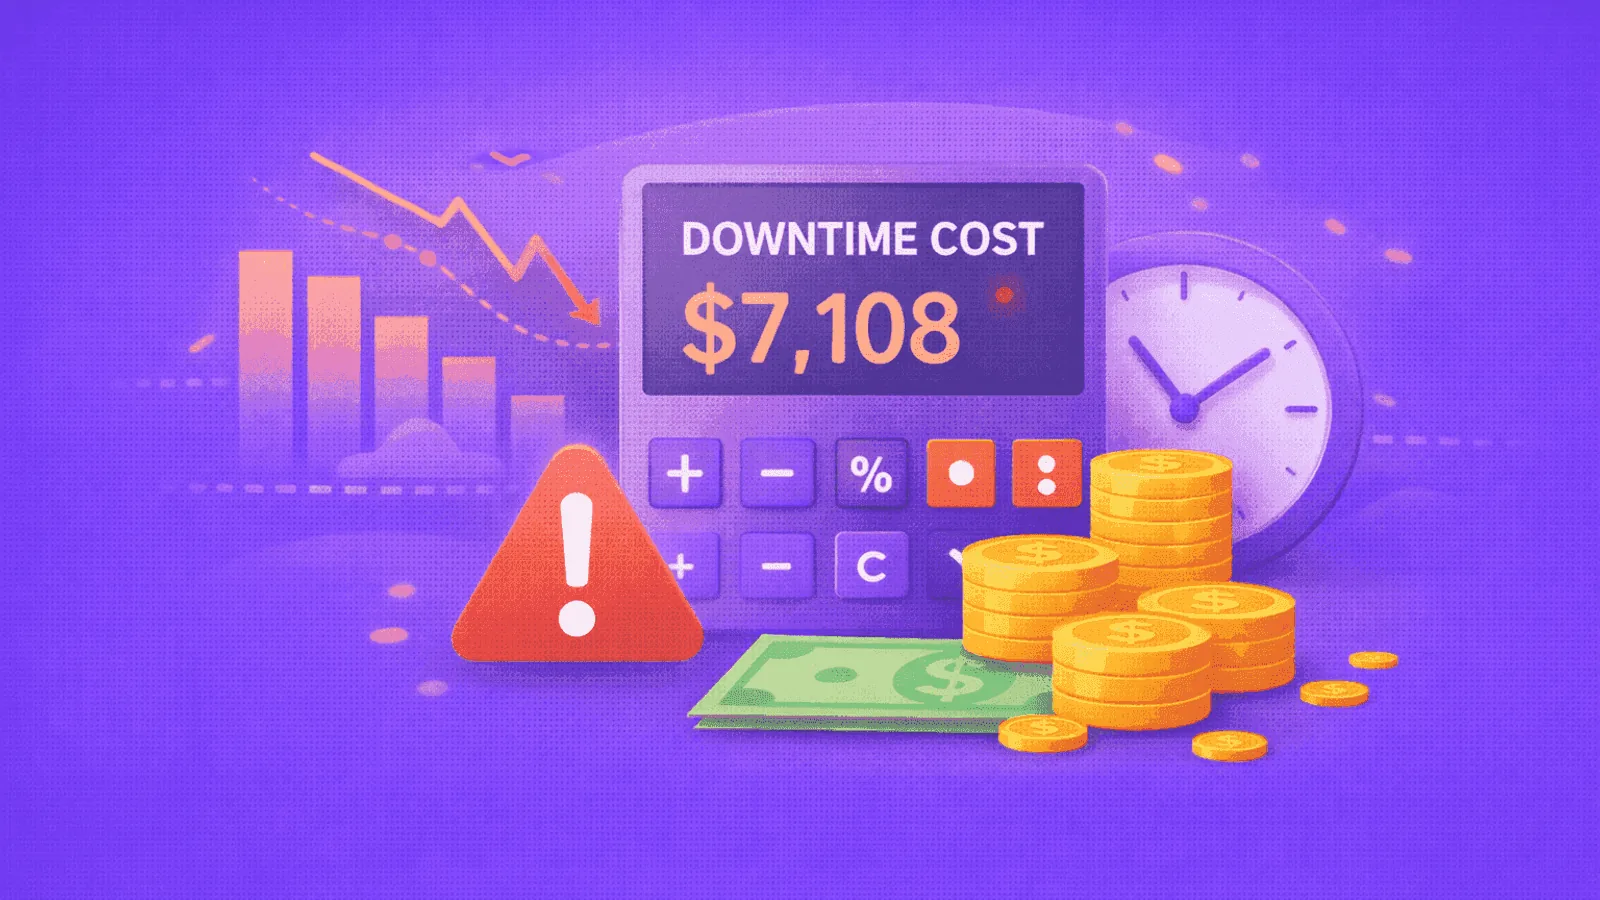
Website Downtime Cost Calculator: What Outages Cost
Calculate the true cost of website downtime for your business. Use our formula to understand why uptime monitoring pays for itself.
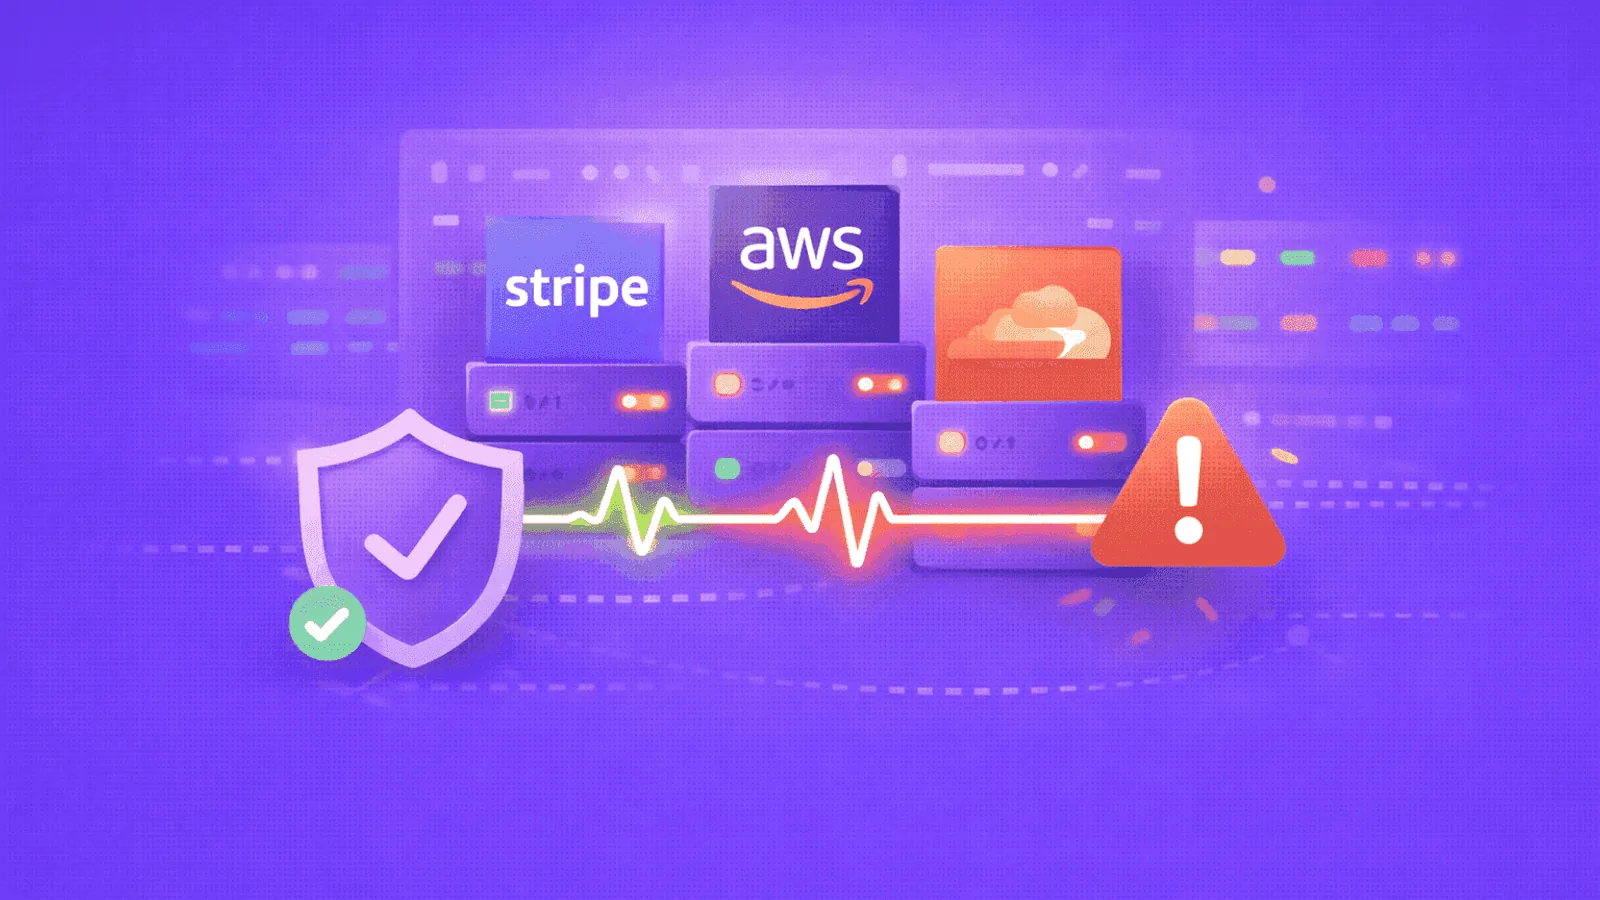
Third-Party Dependency Monitoring: Watching What You Don't Control
Your uptime depends on services you don't control — payment processors, CDNs, auth providers, and cloud platforms. Learn how to monitor third-party dependencies before they take you down.
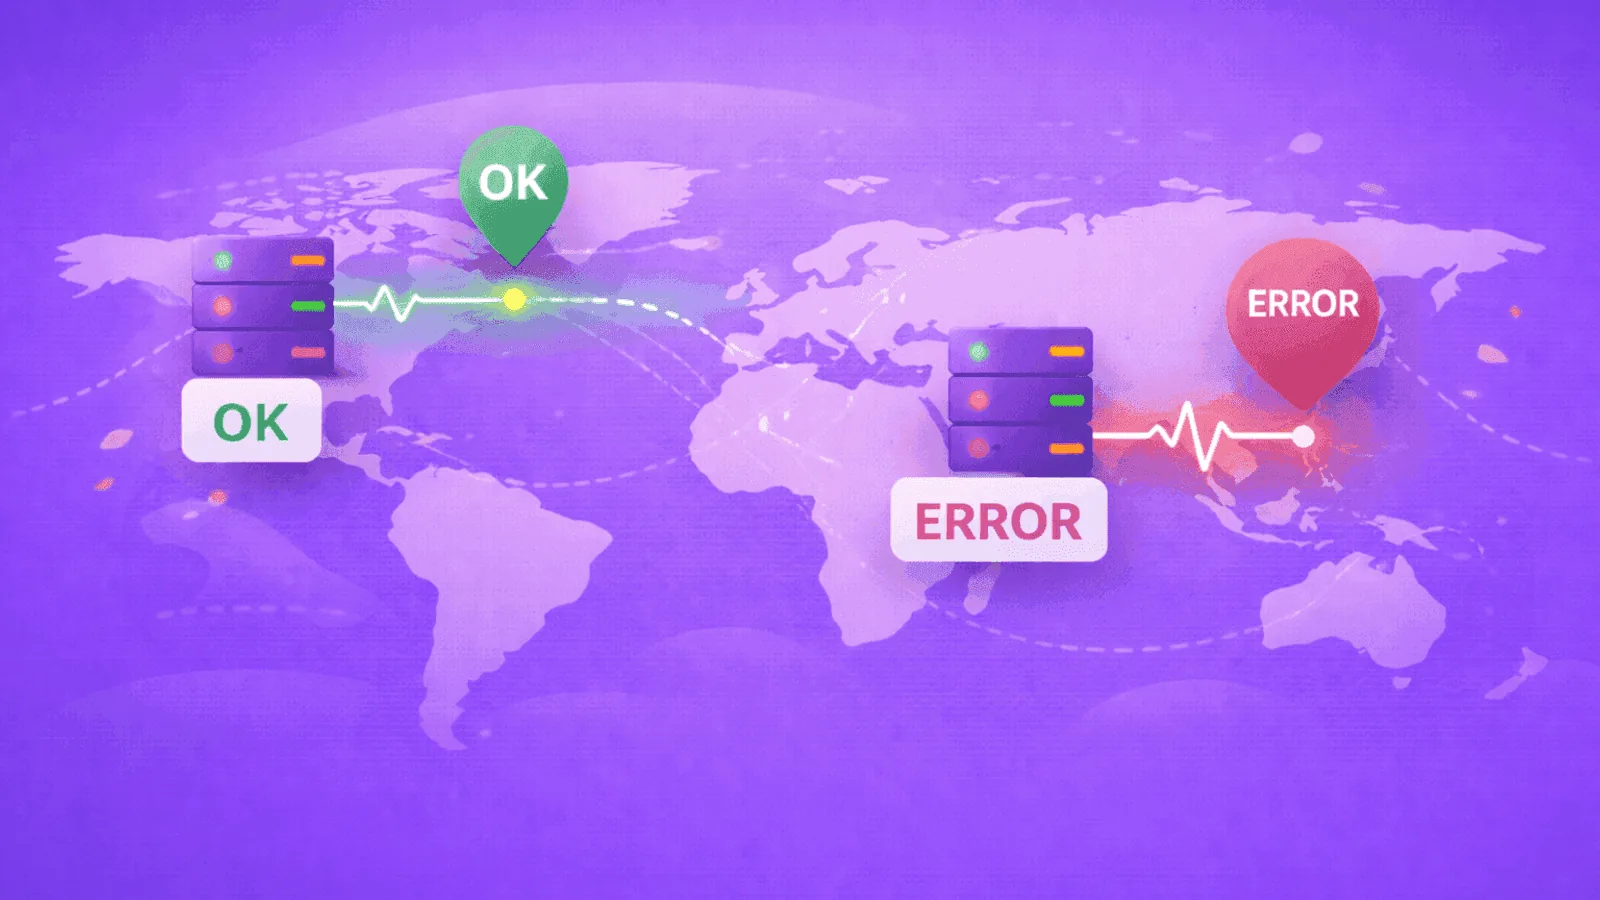
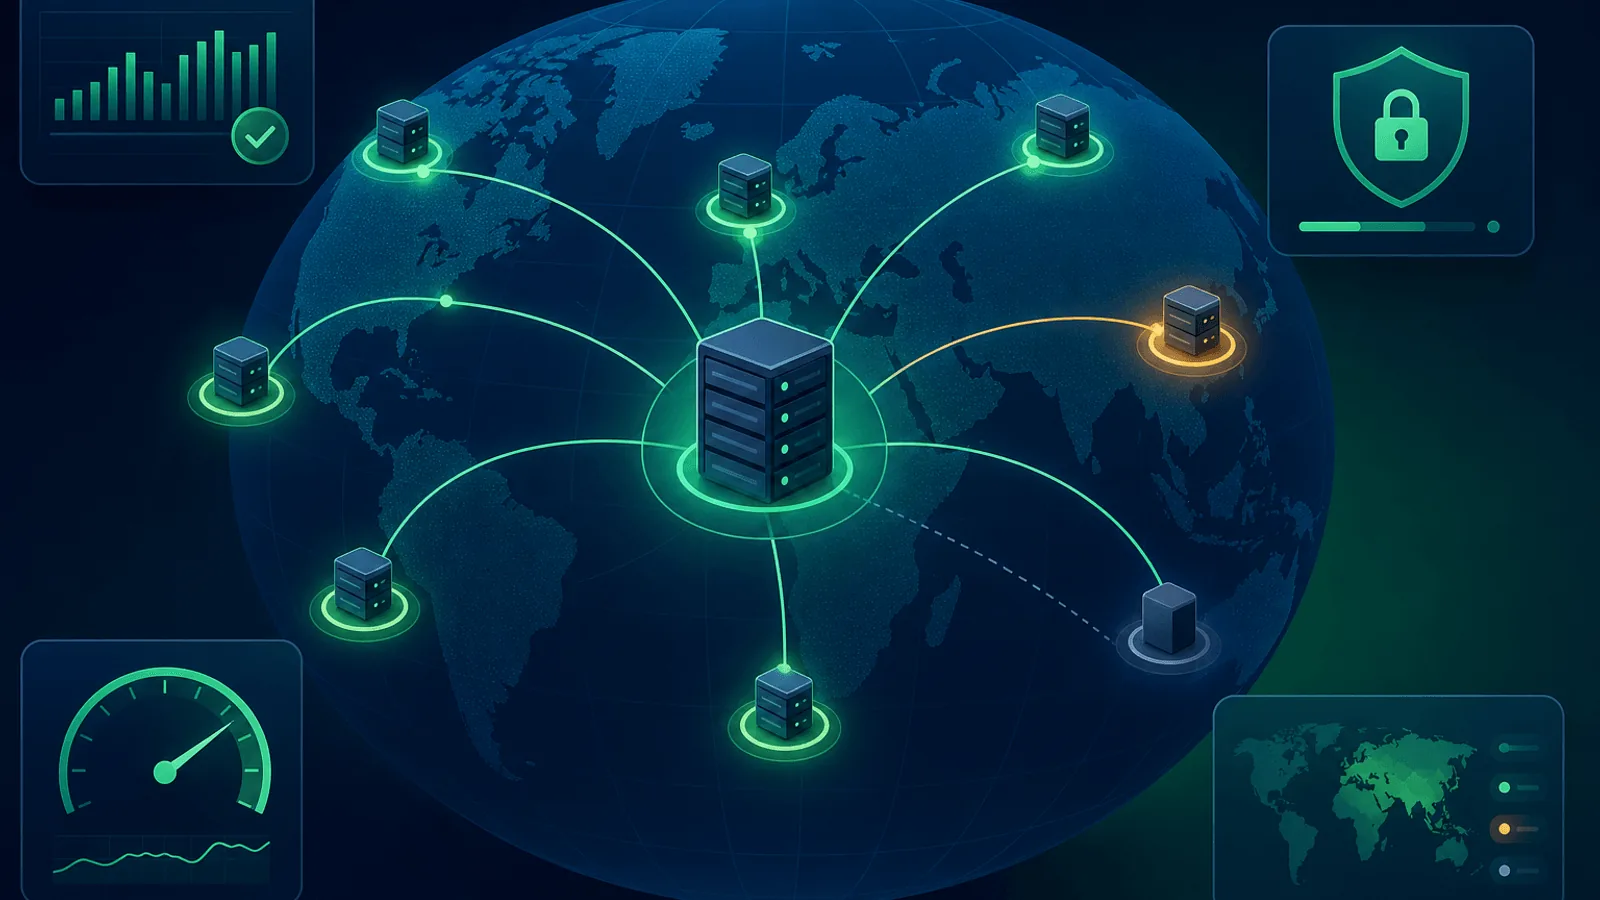
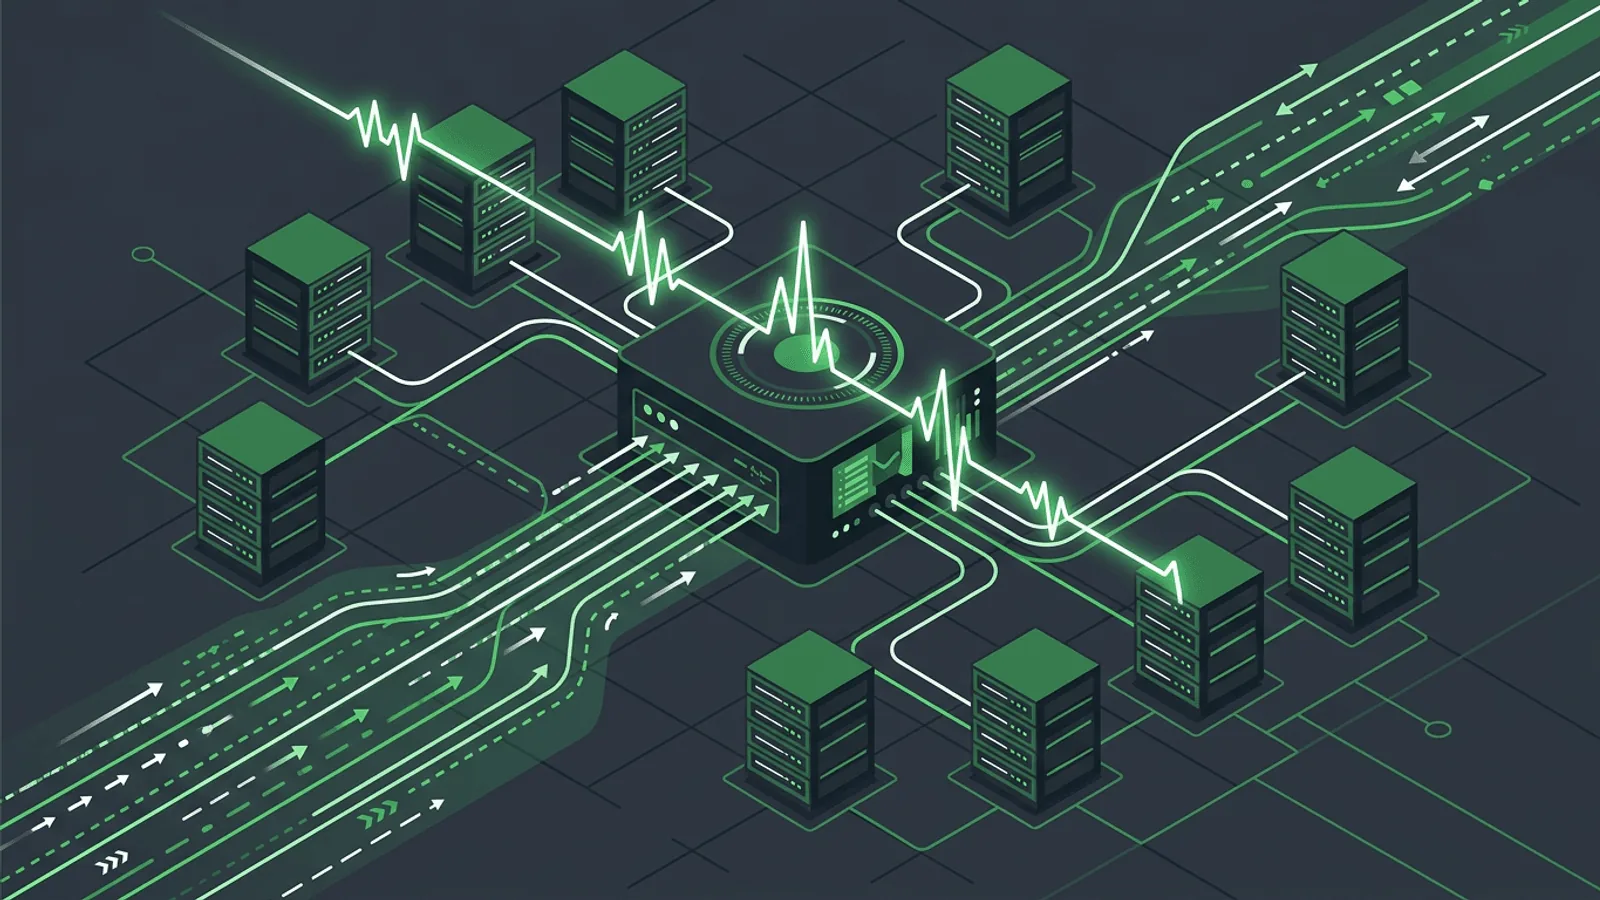
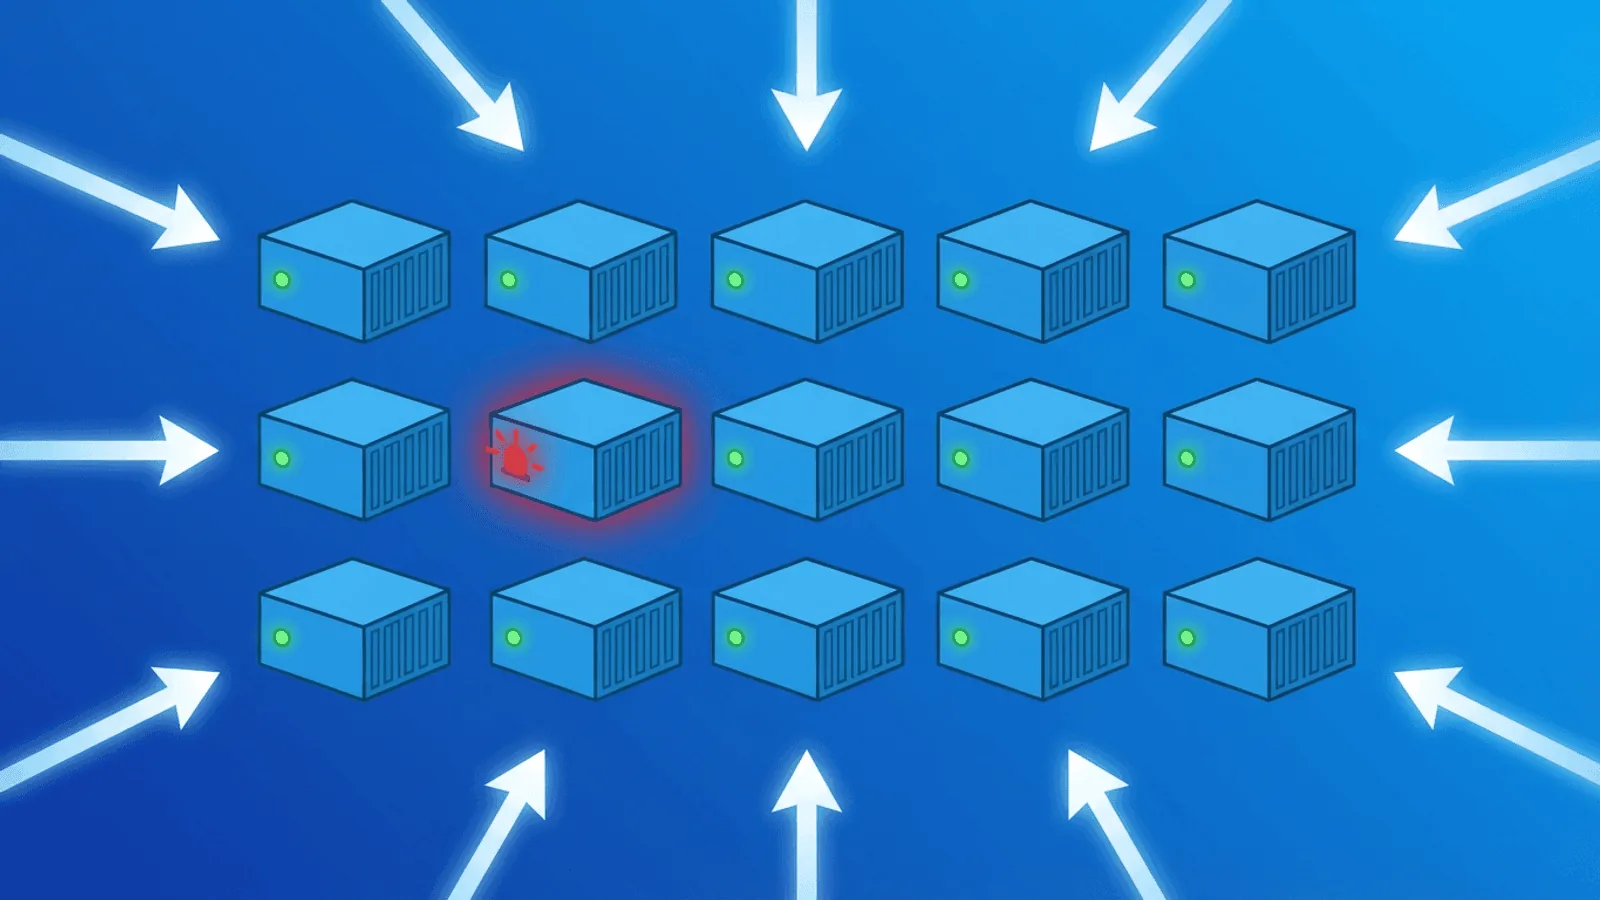
Multi-Region Monitoring: Why Checking From One Location Isn't Enough
Your site might be online in New York but down in Tokyo. Learn why multi-region monitoring catches outages that single-location checks miss — and how to set it up properly.
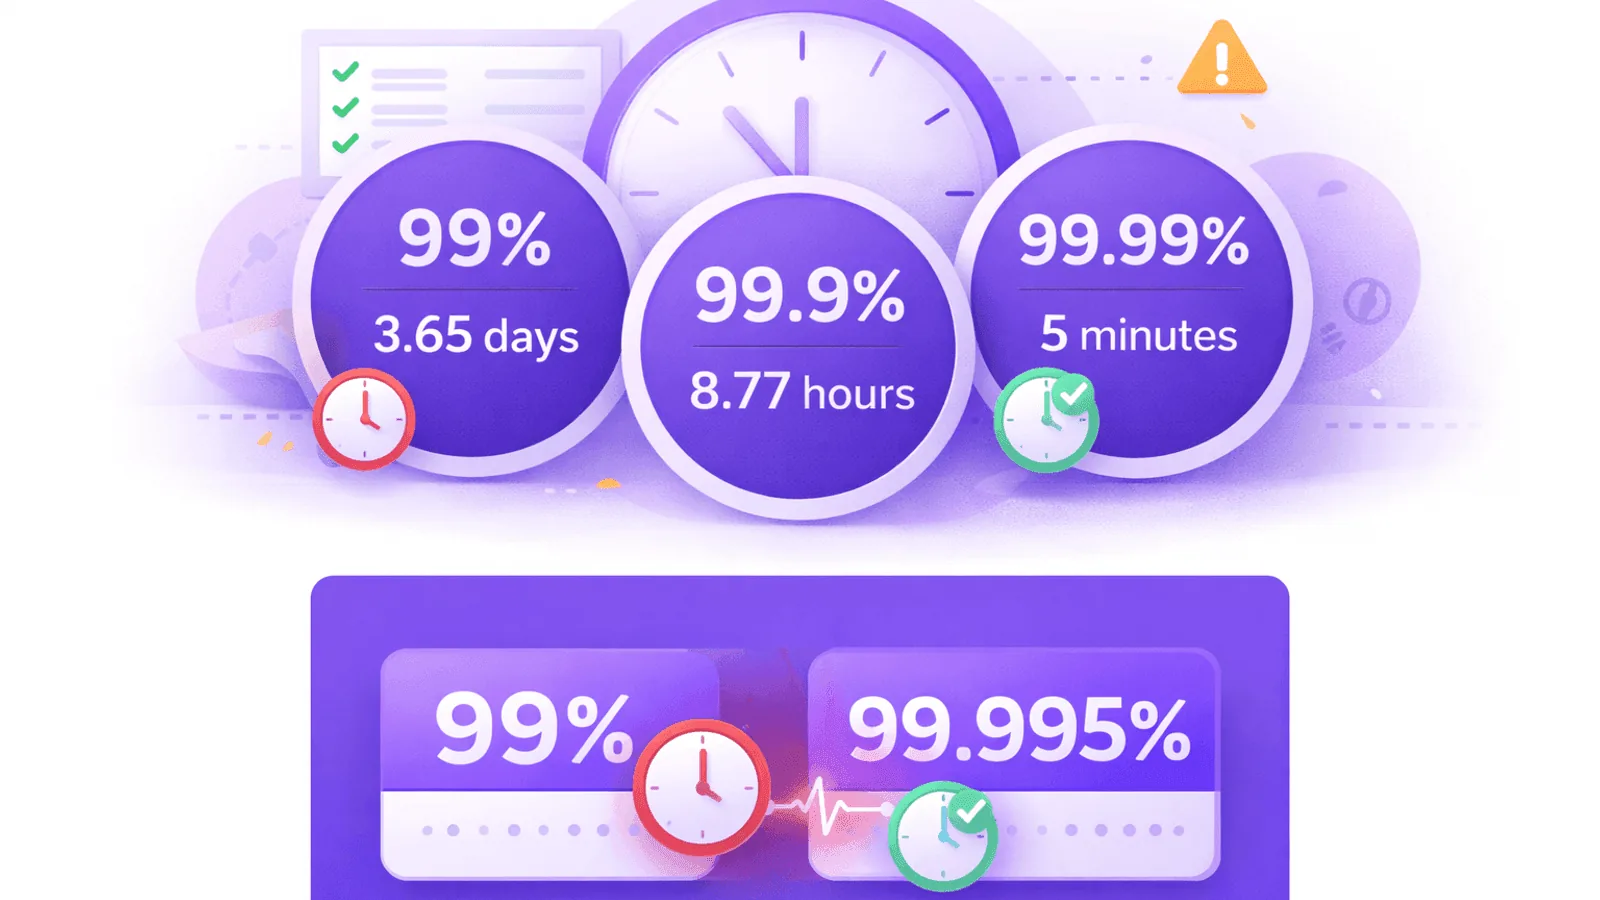
Calculate Website Uptime: Why 99.9% Isn't Enough
Learn to calculate website uptime, understand SLA percentages, and discover why that impressive 99.9% uptime guarantee still means hours of downtime every year.
Maintenance Windows: Deploy Without Alert Storms
Learn how to plan, communicate, and run maintenance windows without alert noise—plus a practical checklist, status page tips, and common pitfalls to avoid.
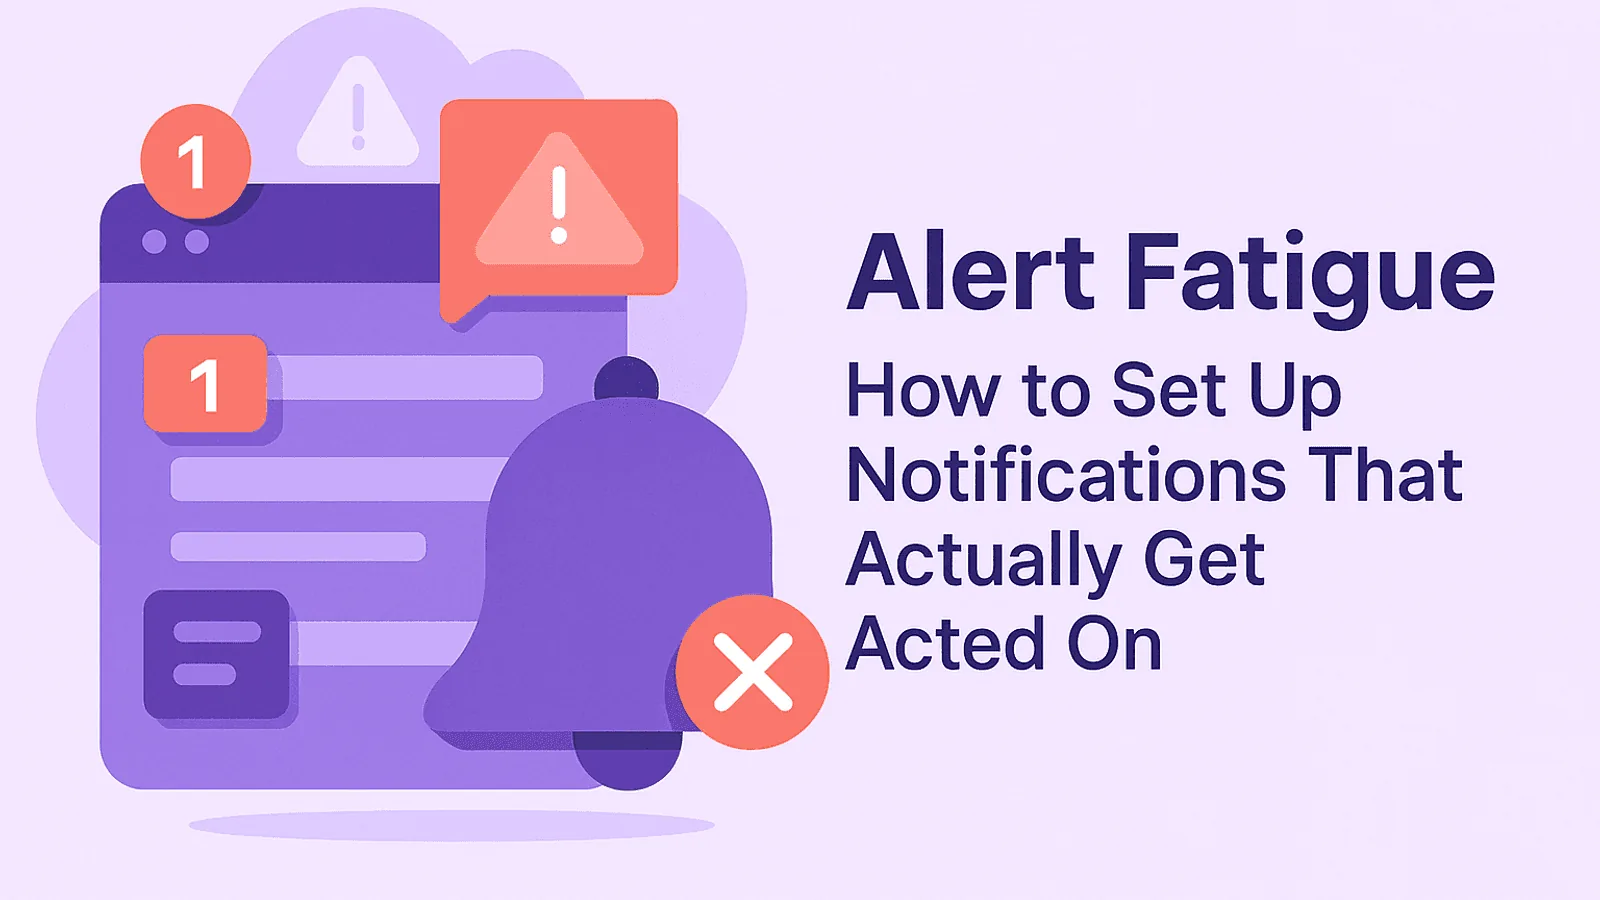
Alert Fatigue: Notifications That Get Acted On
Too many alerts means no alerts. Learn how to configure monitoring notifications that your team will actually respond to — without missing critical issues.
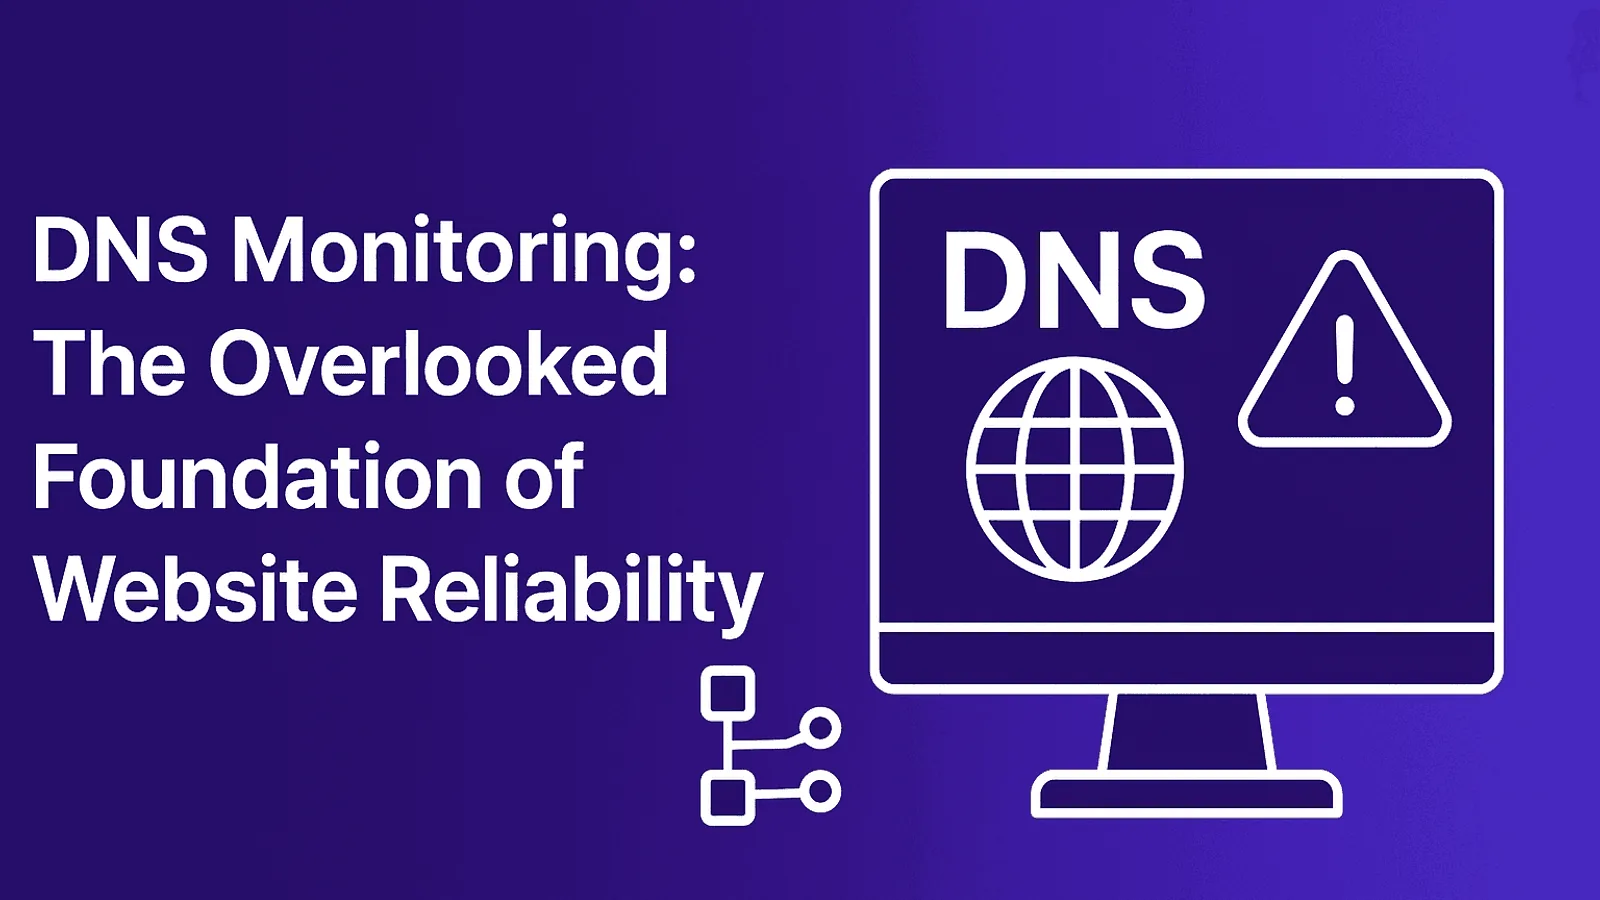
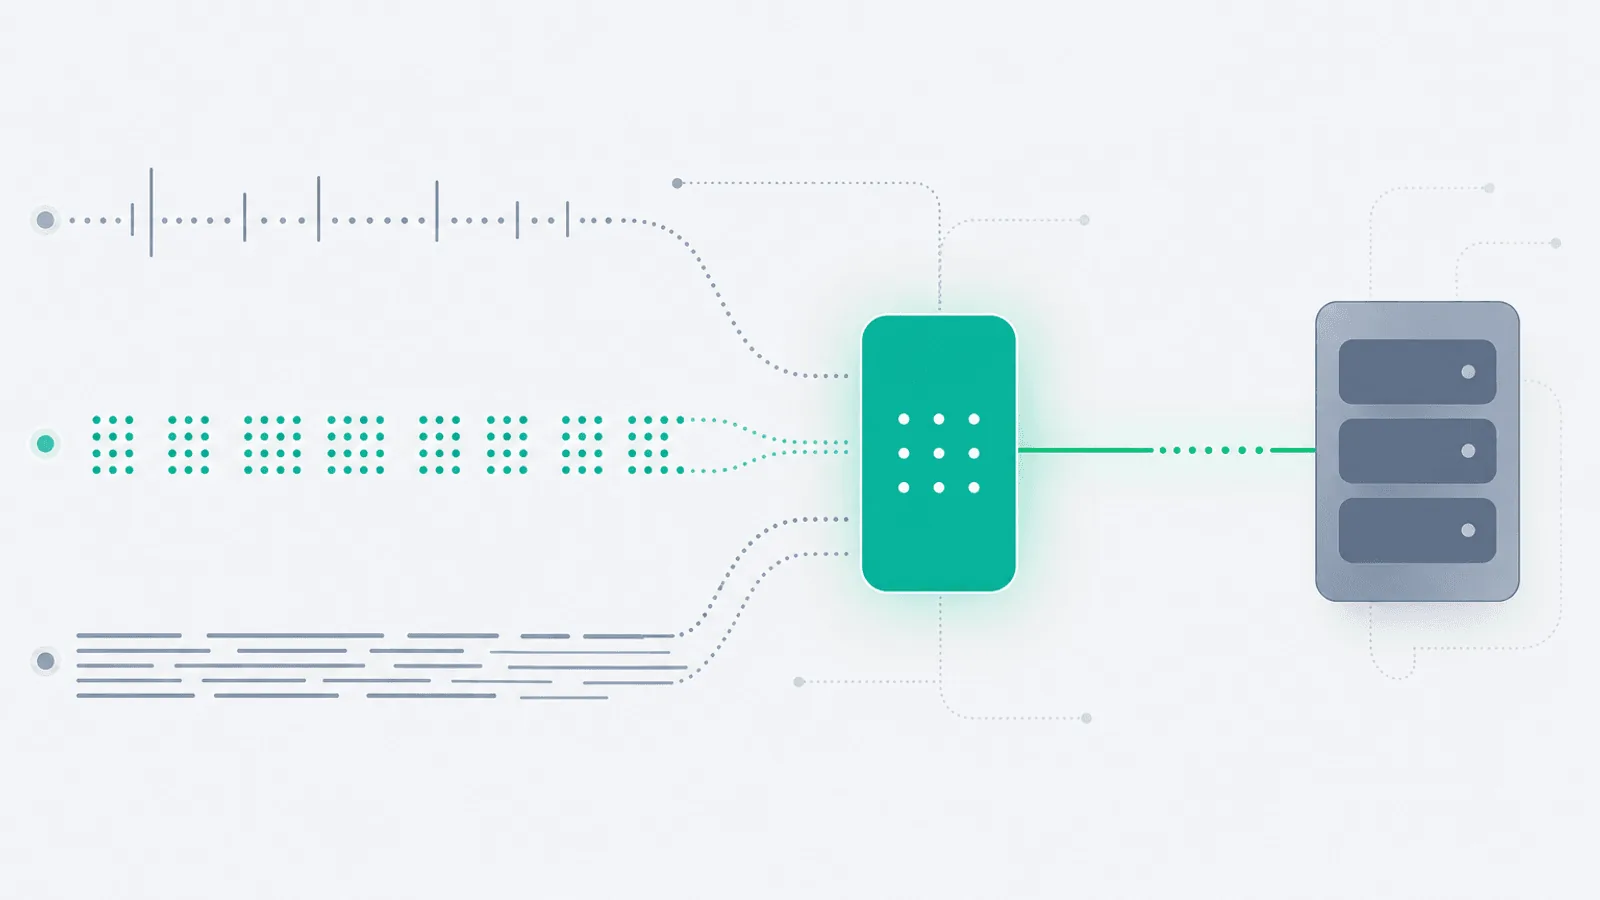
DNS Monitoring: Foundation of Website Reliability
Your site can't load if DNS fails. Learn why DNS monitoring catches issues other tools miss — and prevents the outages nobody sees coming.
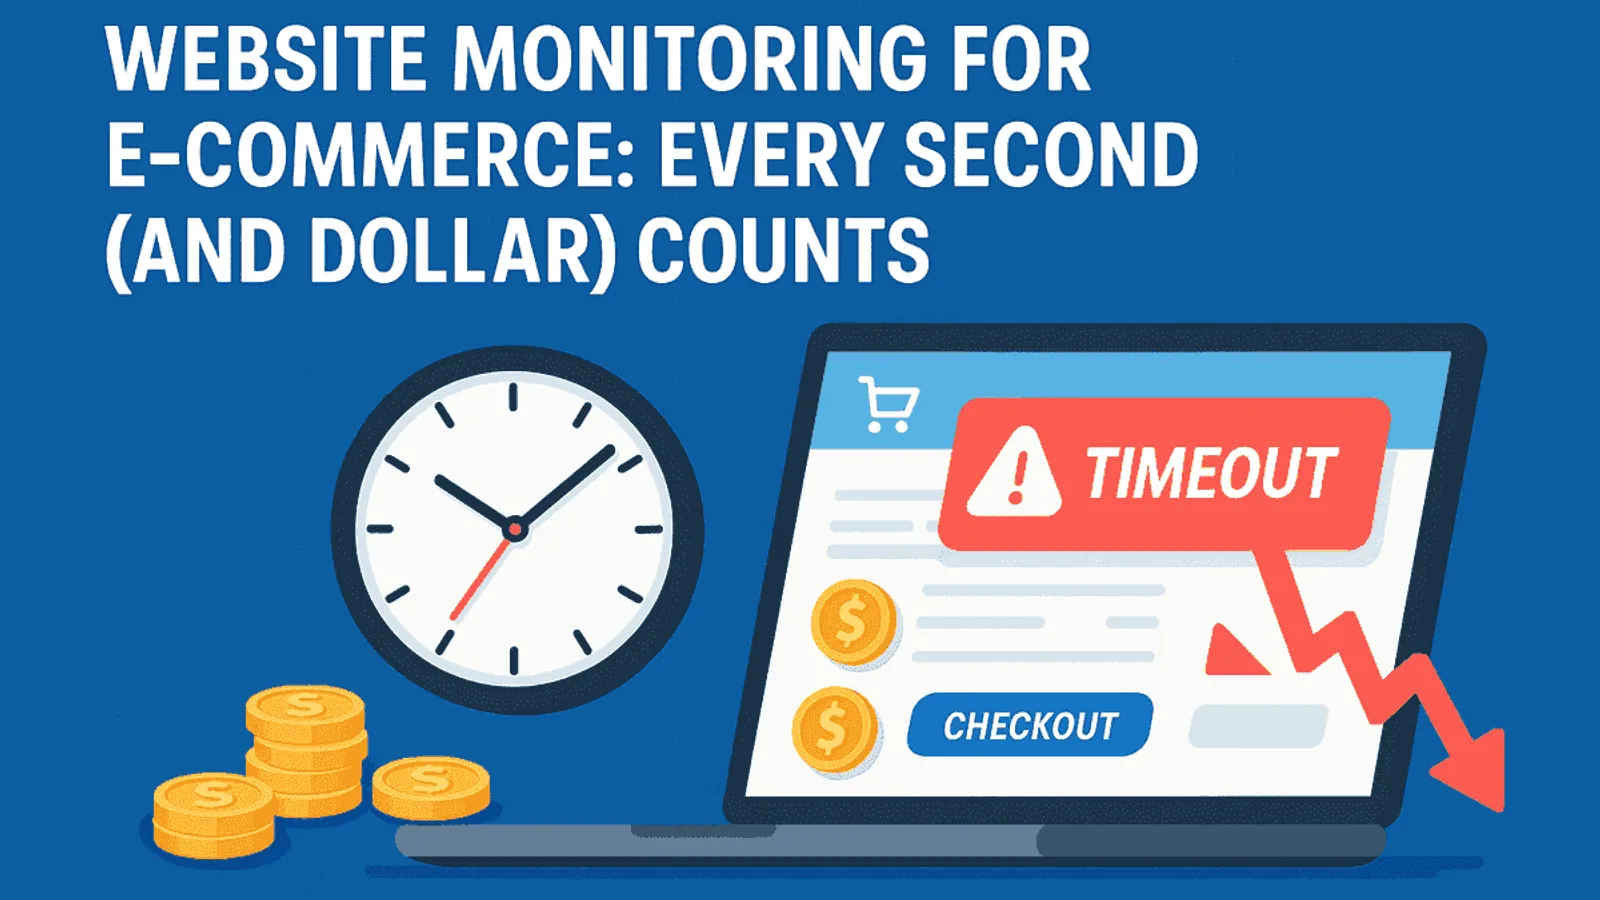
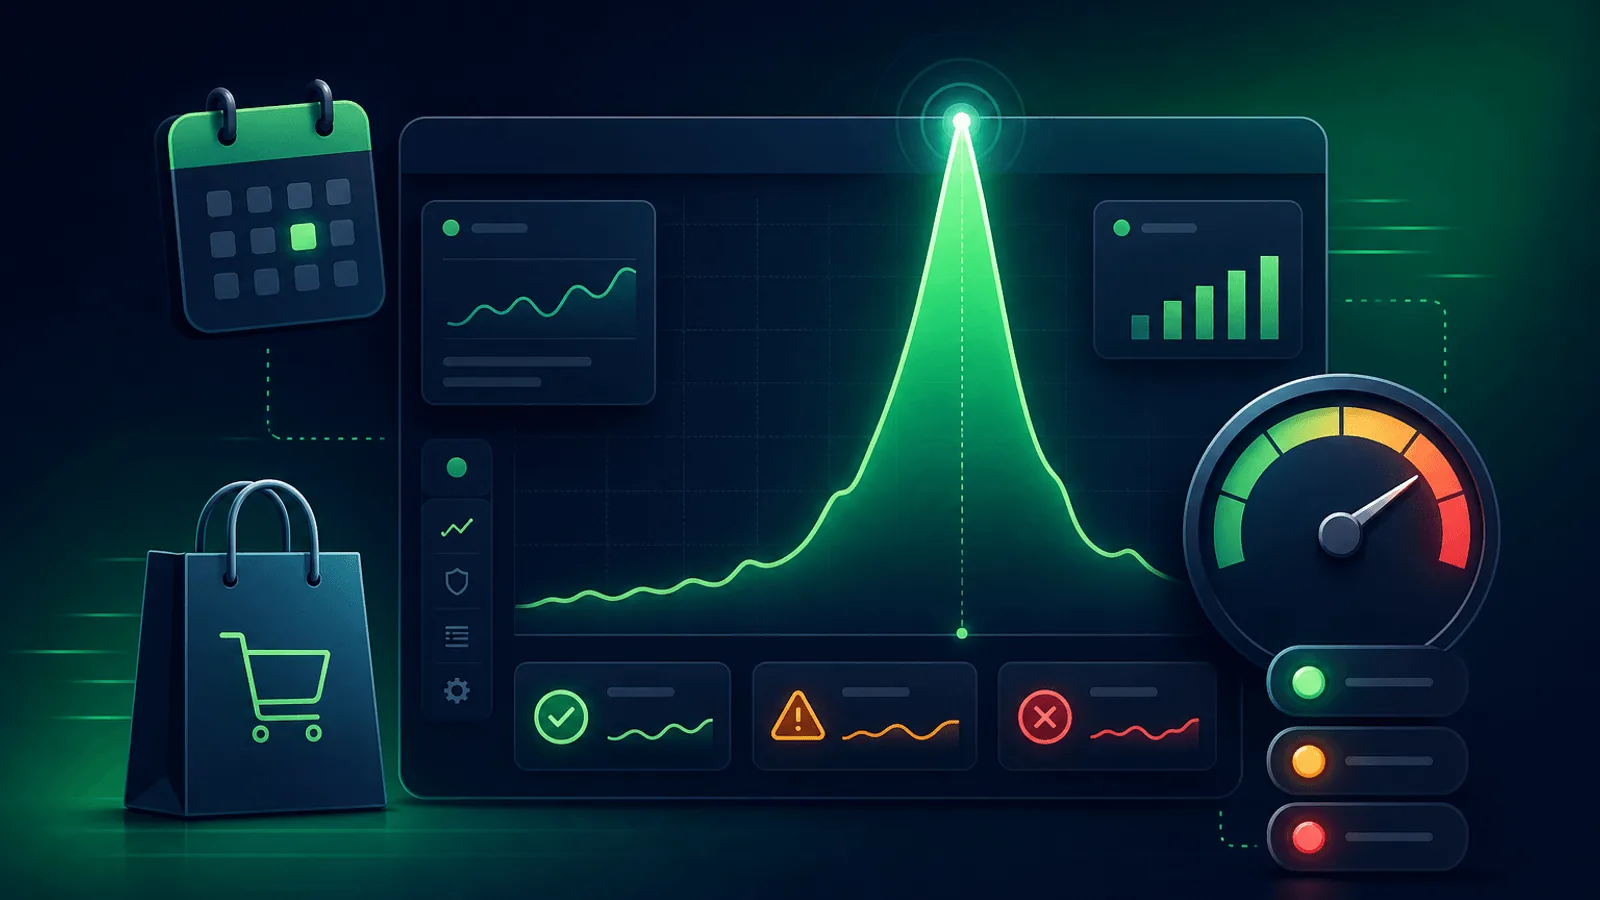
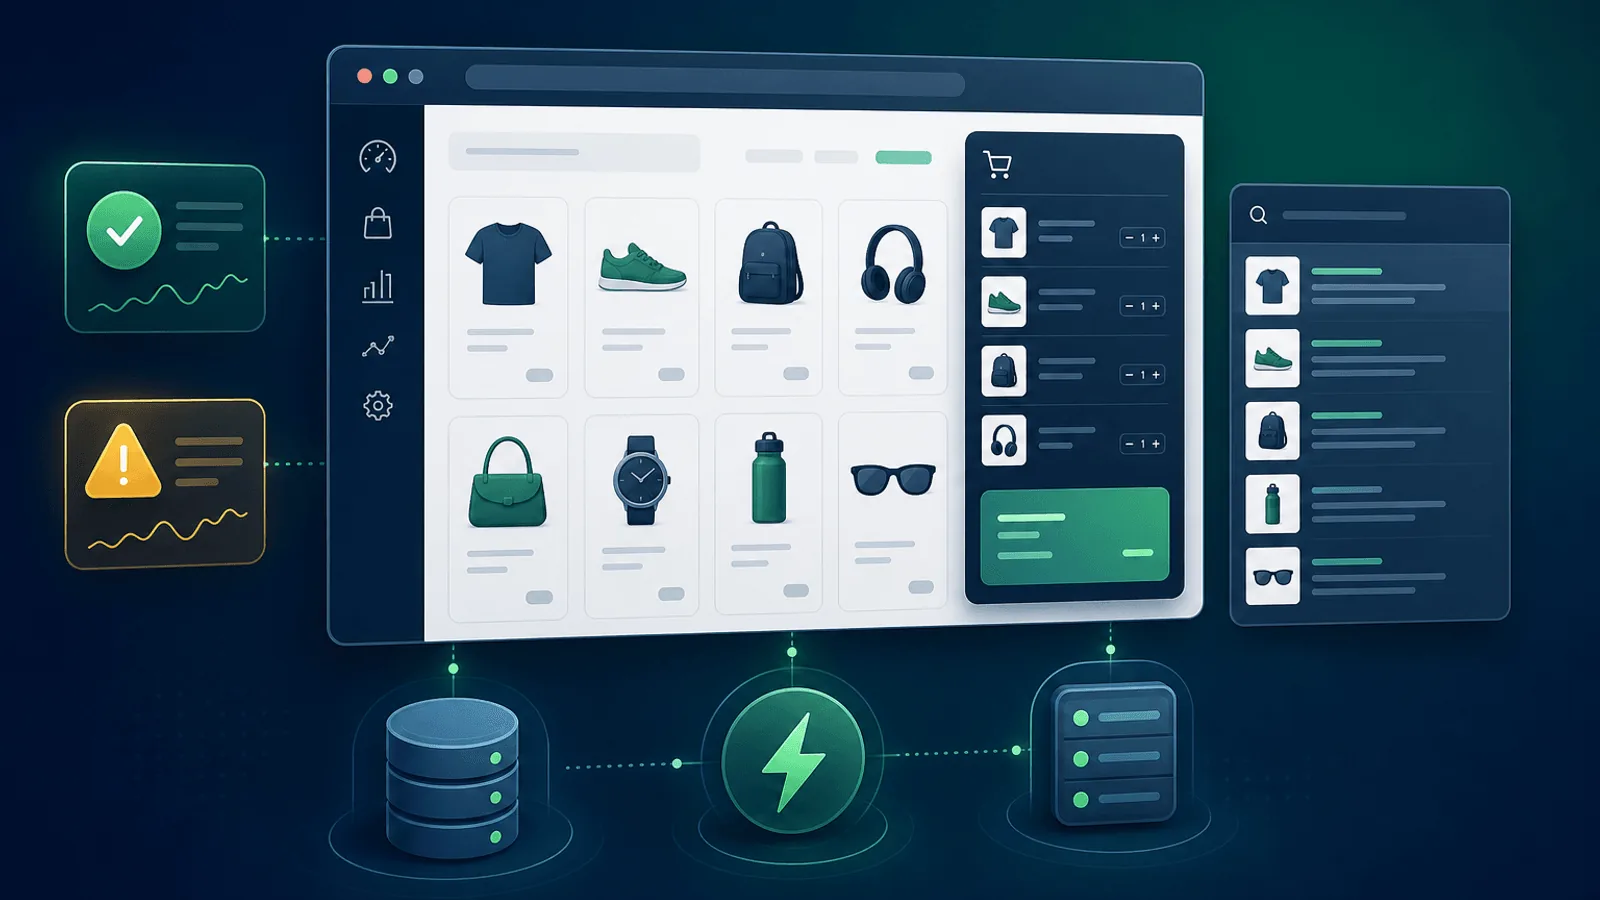
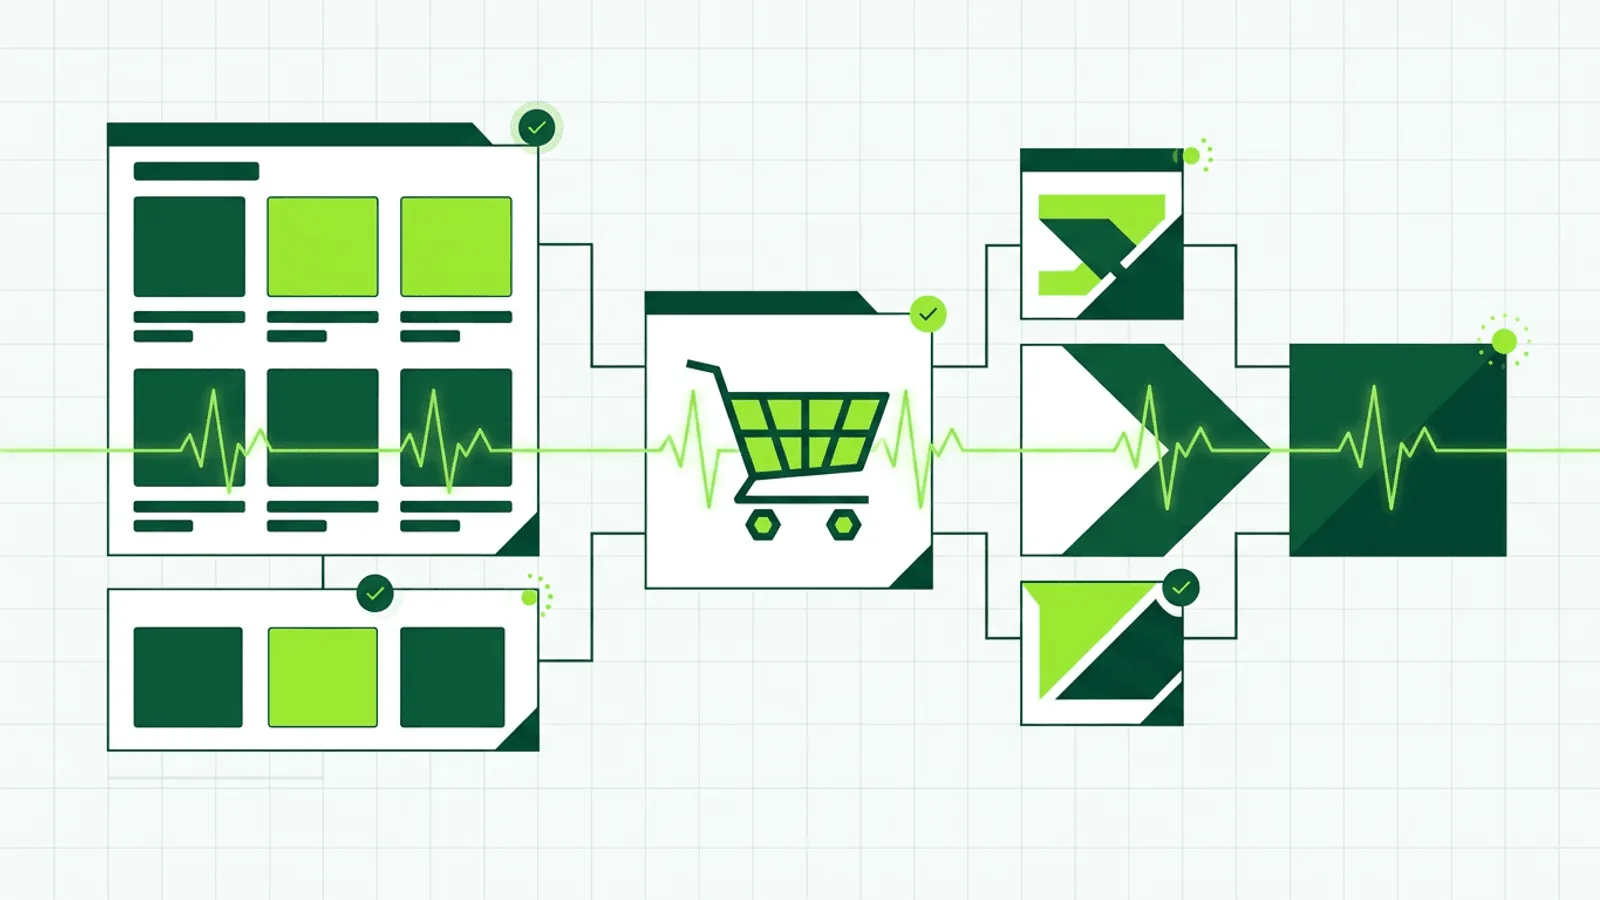
Website Monitoring for E-commerce: Every Second Counts
E-commerce sites lose $5,600 per minute of downtime. Learn which pages to monitor and how to protect revenue during peak sales.
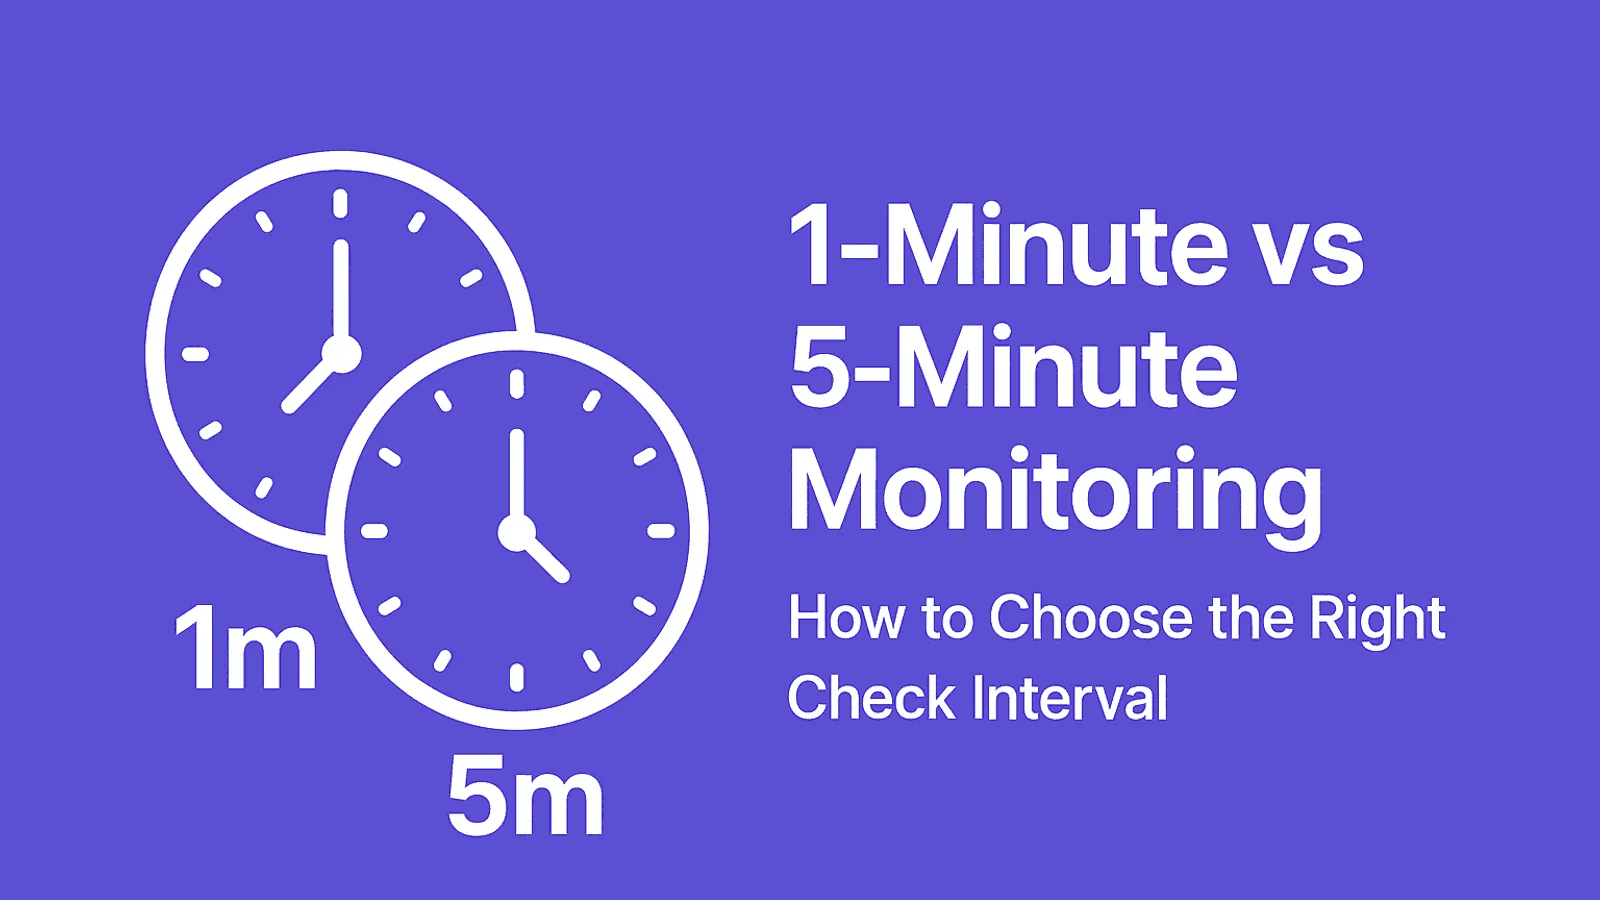
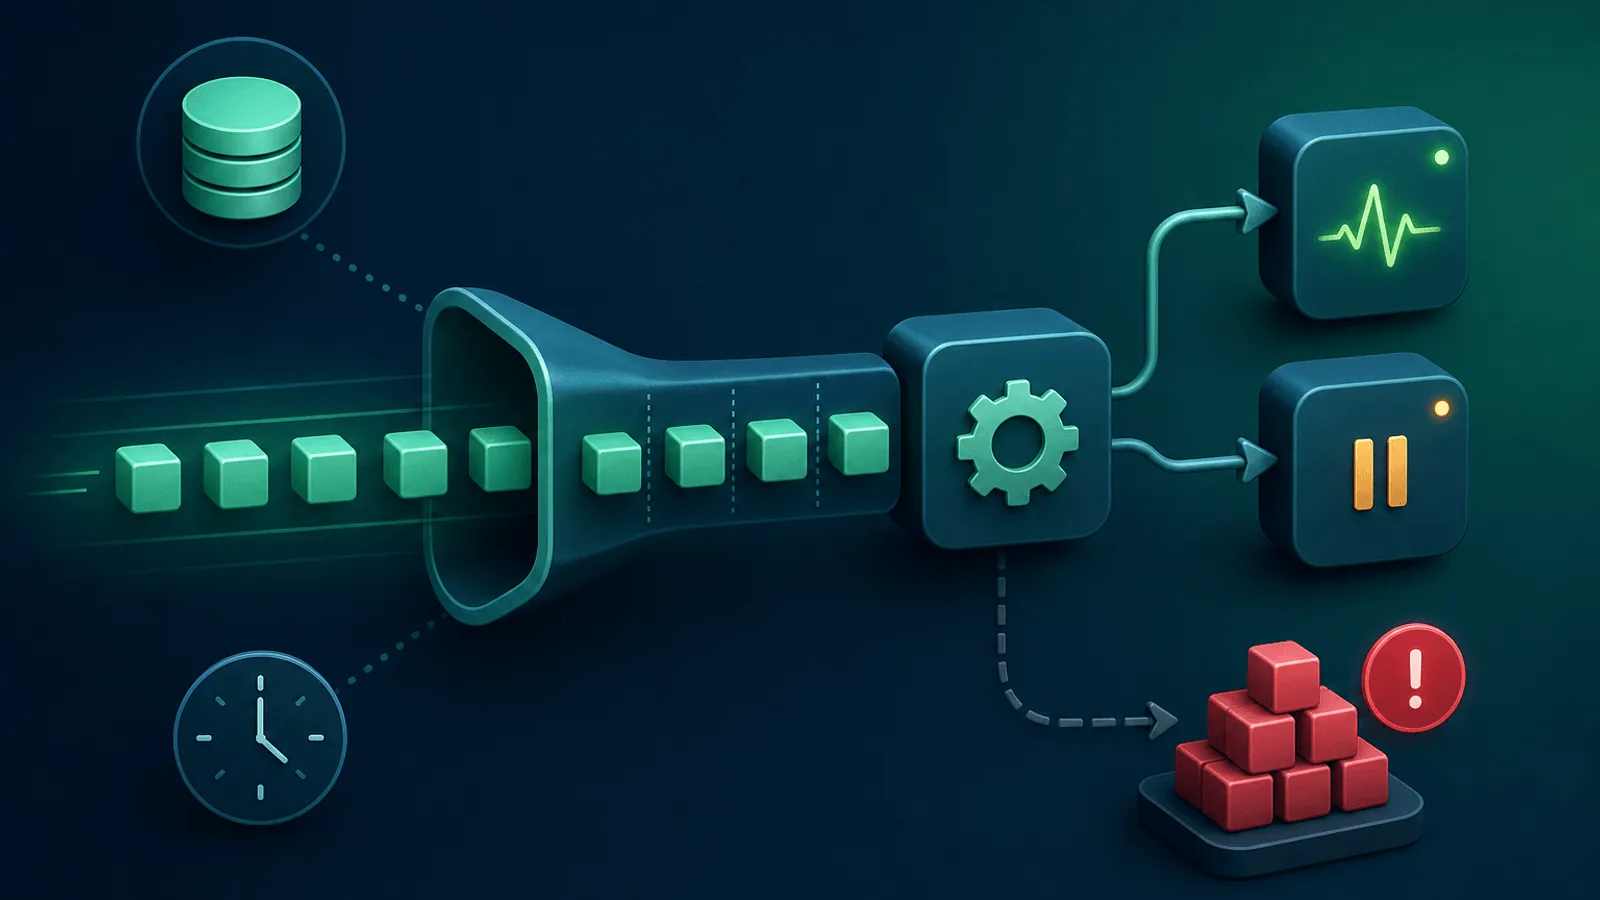
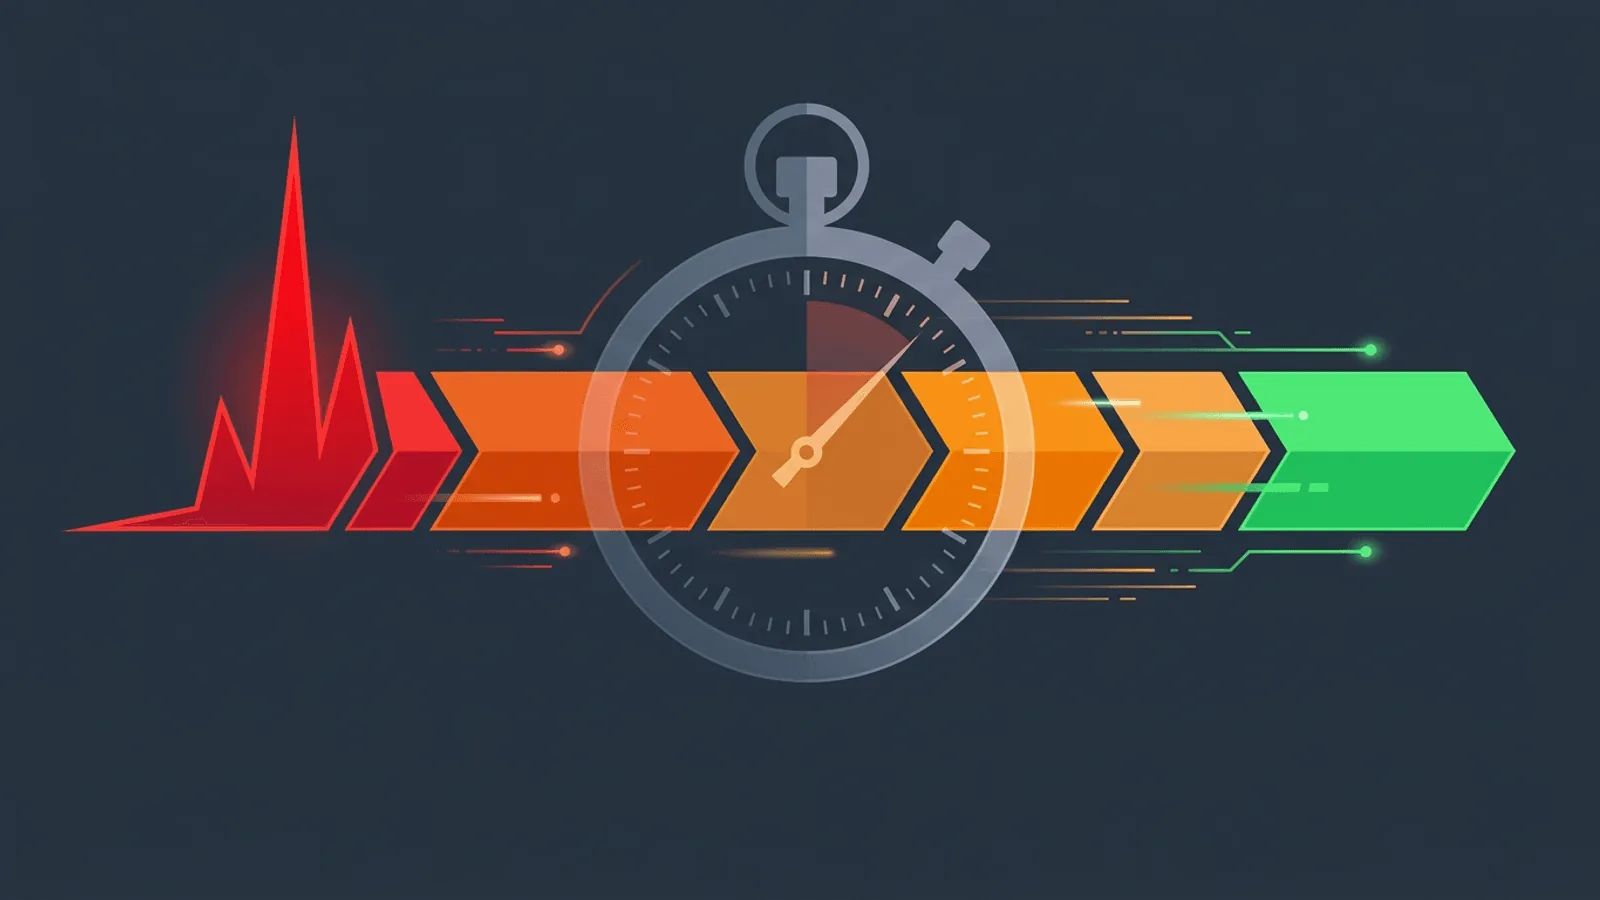
1-Minute vs 5-Minute Monitoring Check Intervals
Should you check every minute or every 5 minutes? Learn how to choose the right monitoring interval for your website — and when faster checks actually matter.
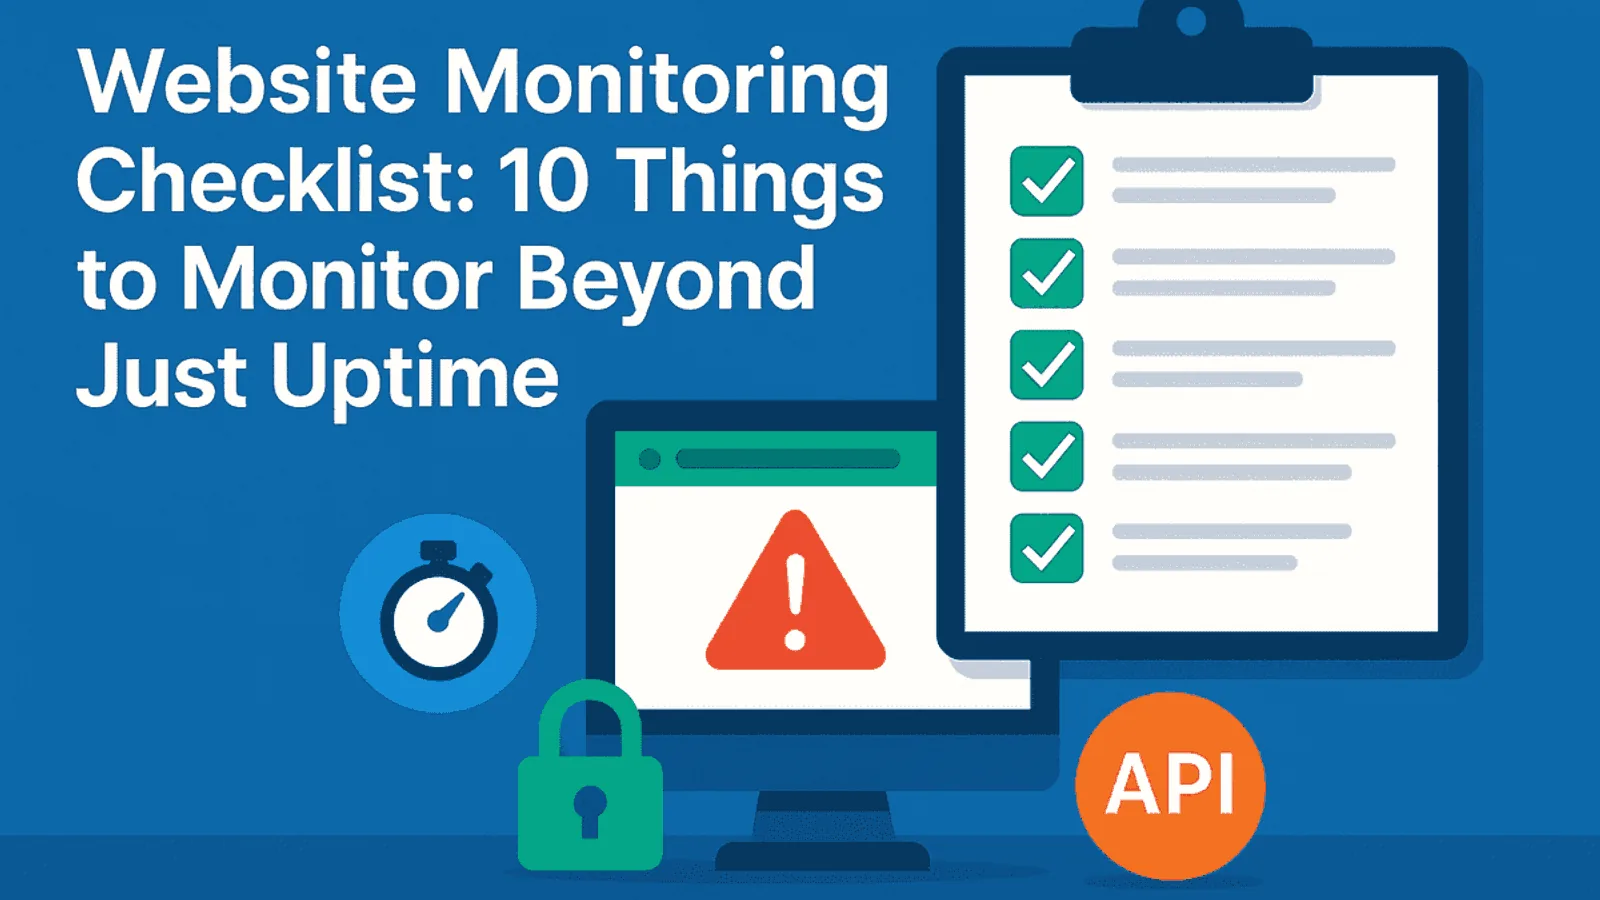
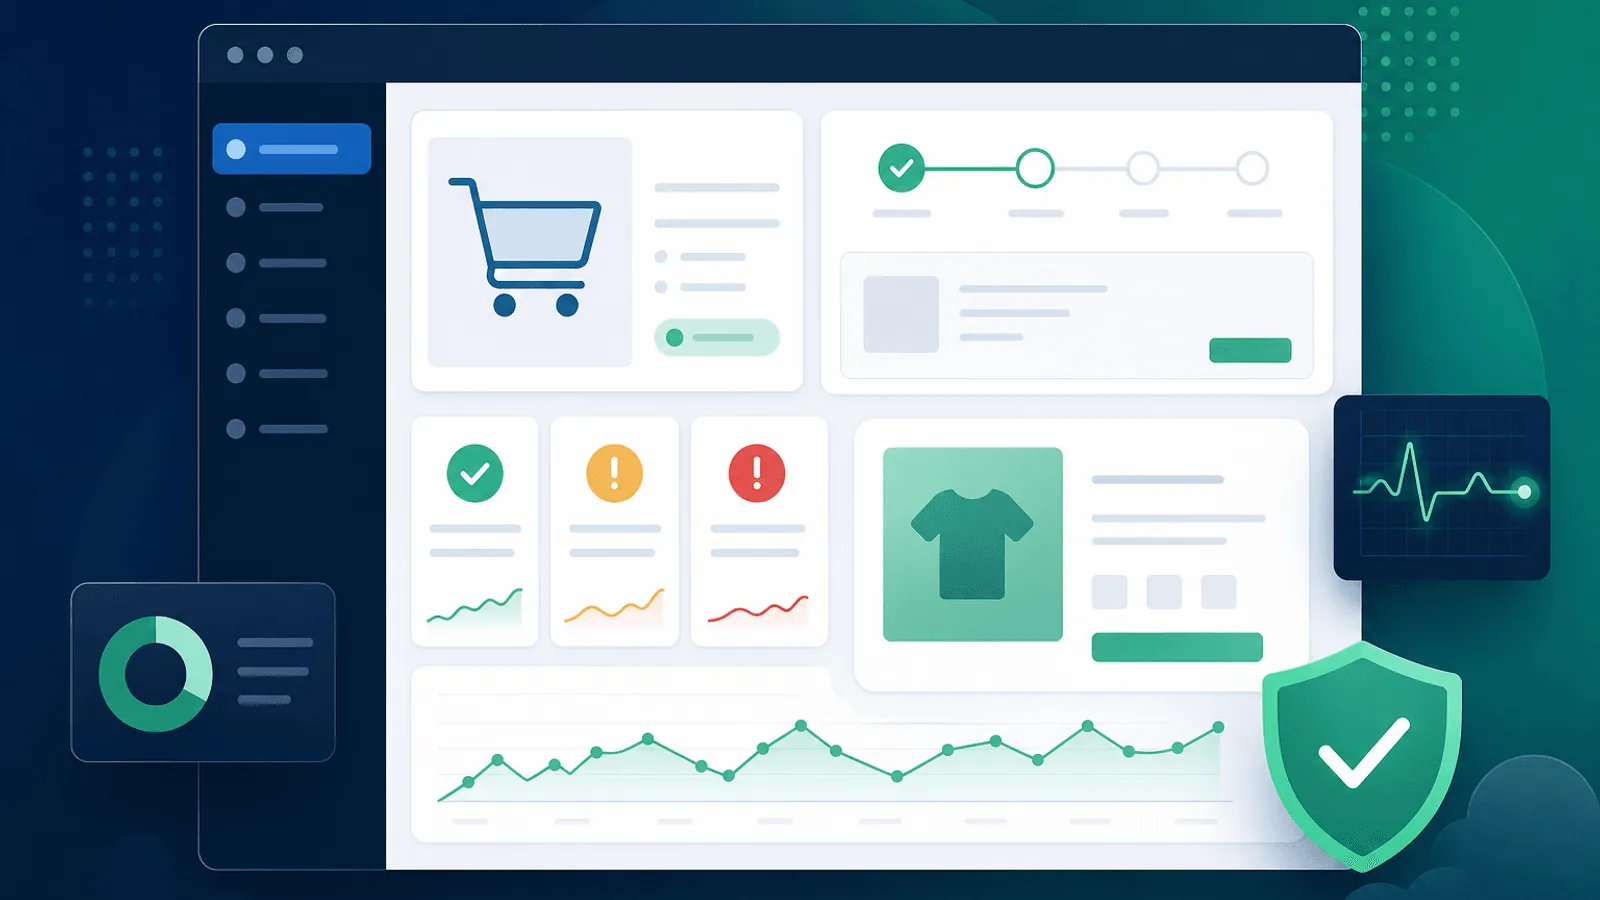
Website Monitoring Checklist: Beyond Just Uptime
Complete checklist of what to monitor on your website — from SSL certificates to API endpoints. Catch issues before users do.
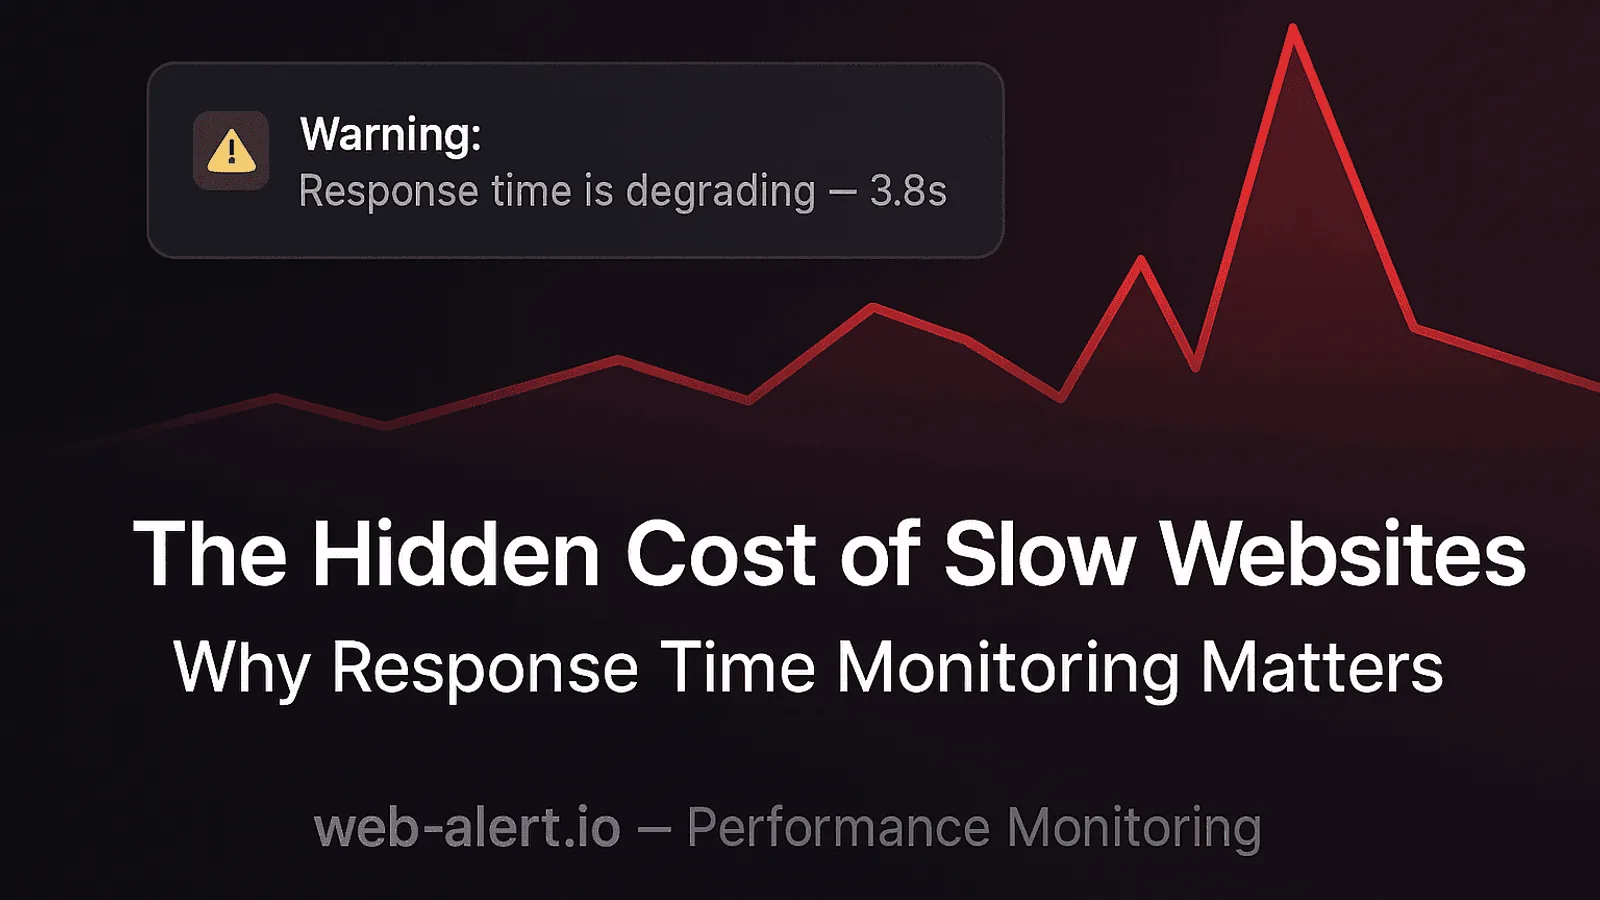
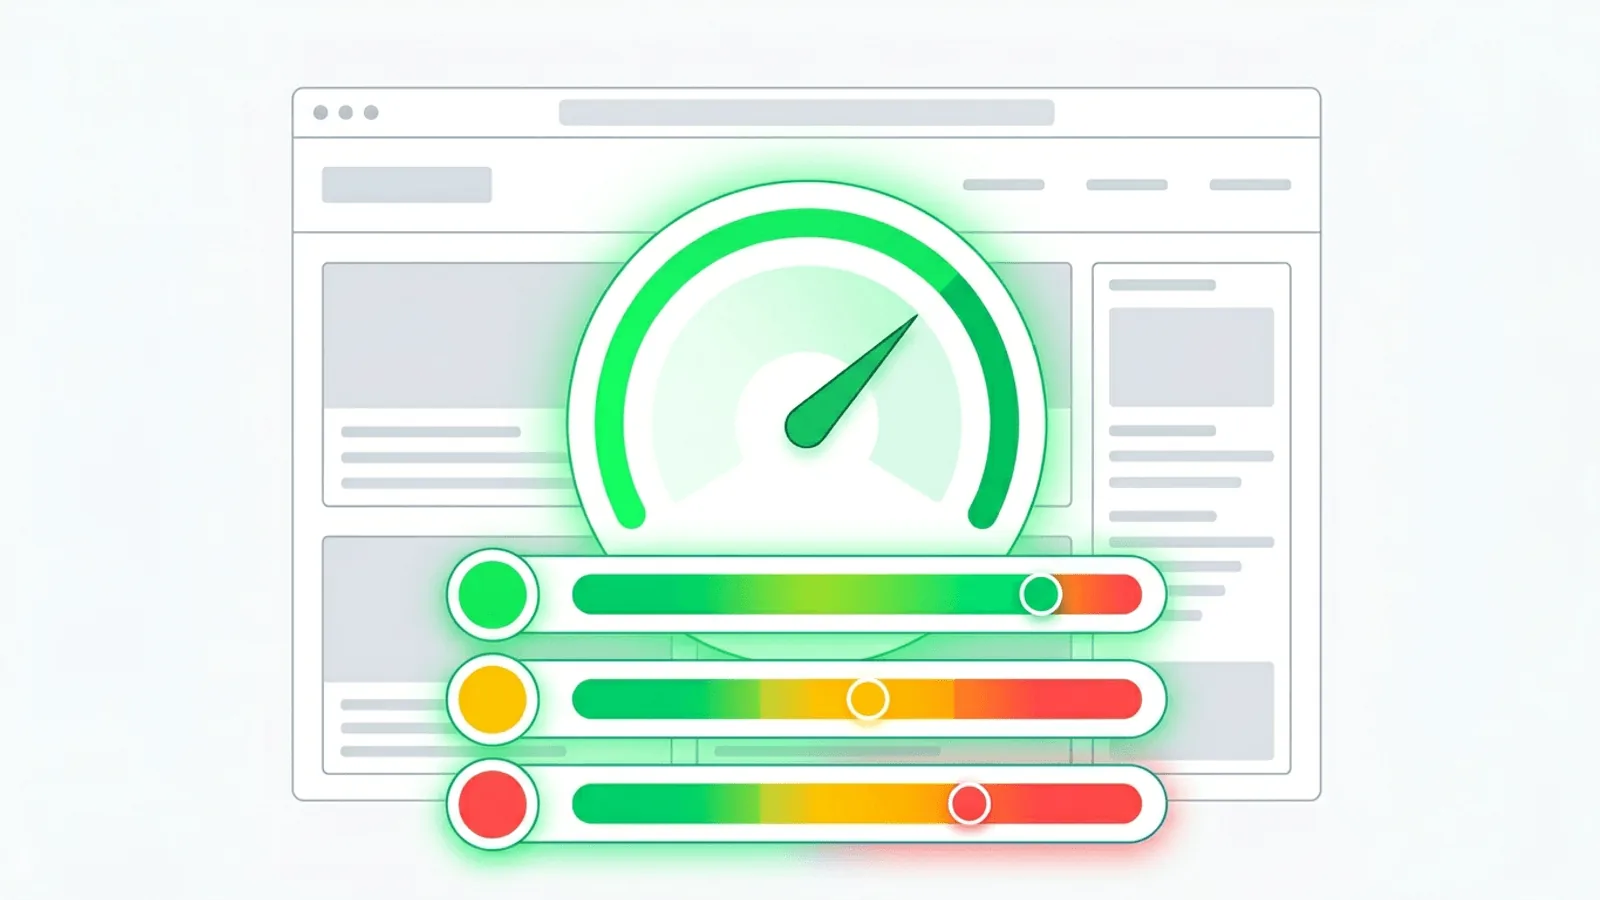
Hidden Cost of Slow Websites: Response Time Monitoring
Your site might be 'up' but still losing customers. Learn why response time monitoring matters and how slow performance kills conversions.
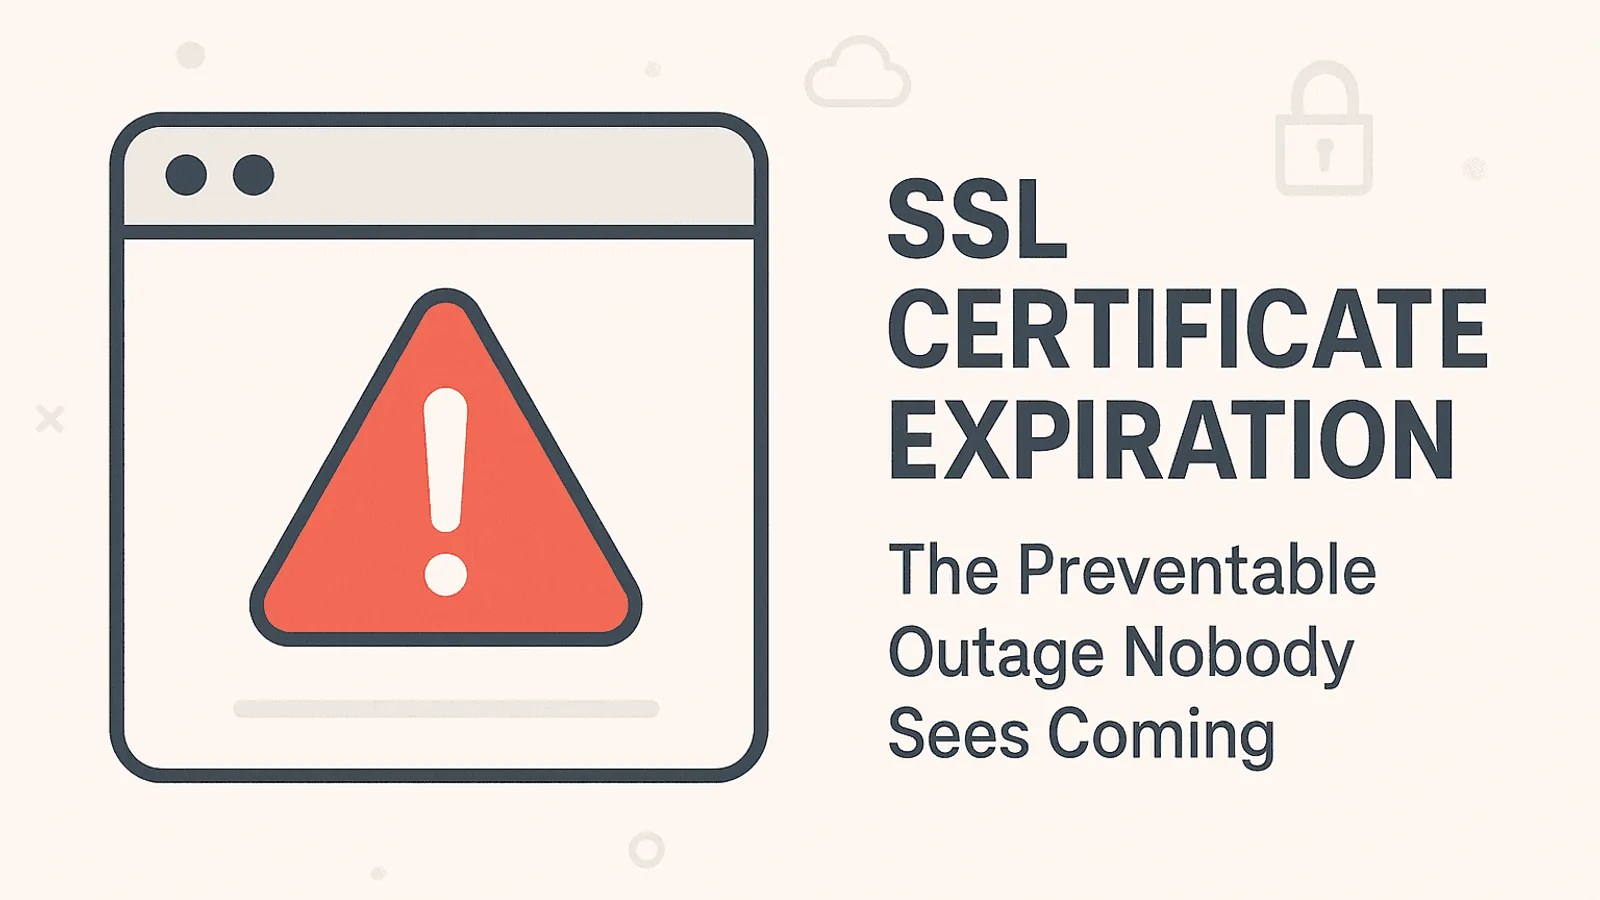
SSL Certificate Expiration: The Preventable Outage
Expired SSL certificates cause thousands of outages yearly — and they're 100% preventable. Learn how to monitor certificates effectively.
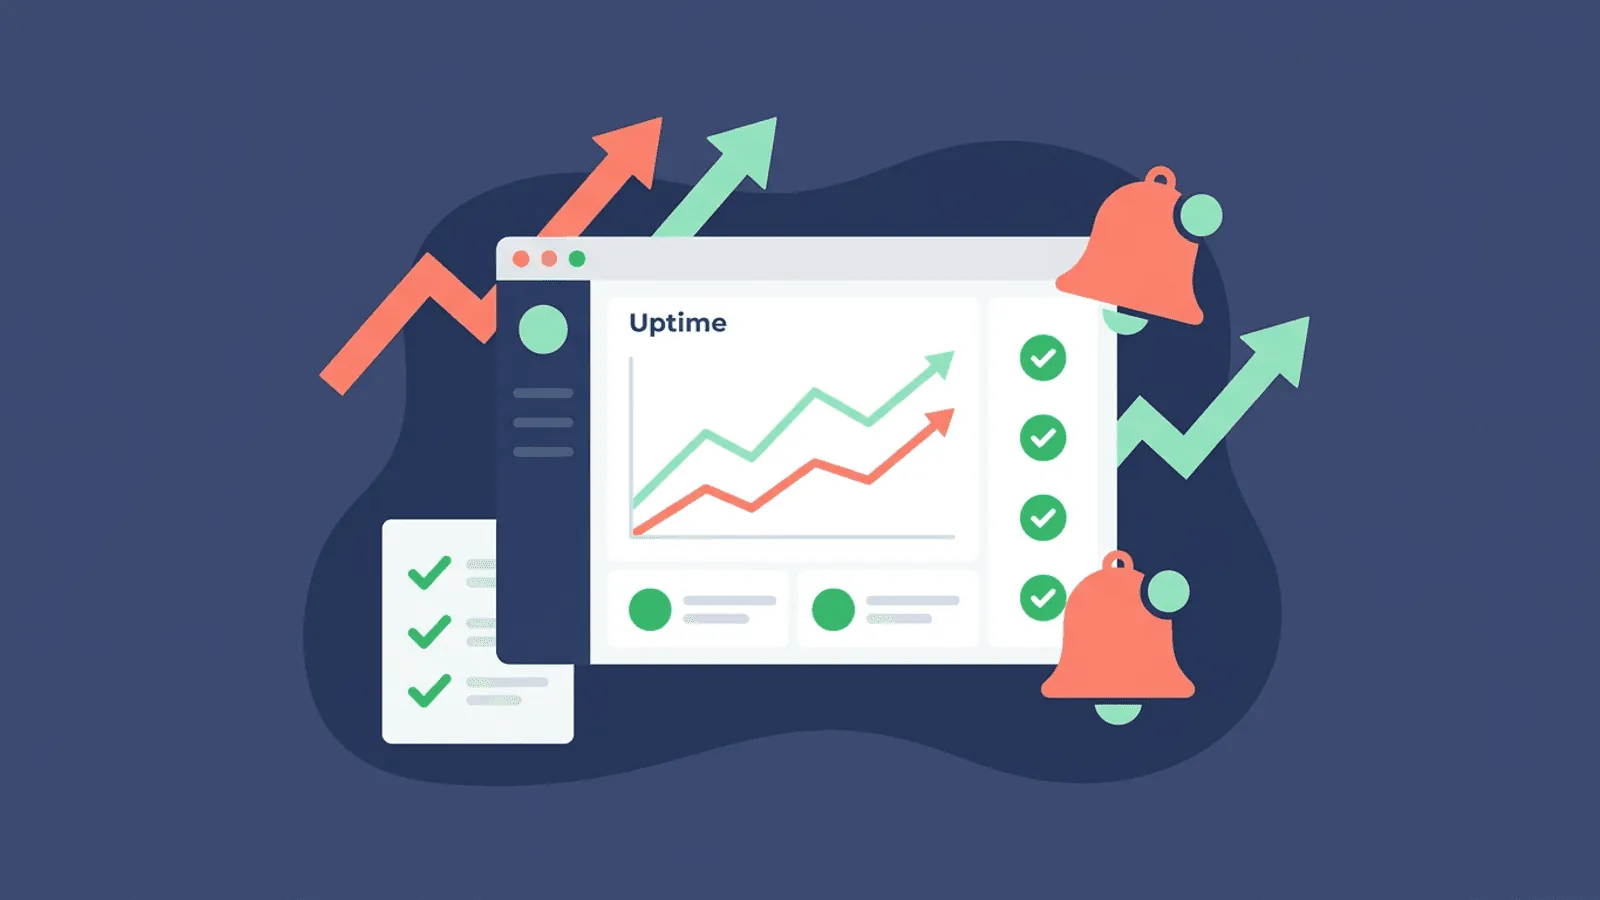
Why Every SaaS Needs Uptime Monitoring (Day 1)
A practical guide for new SaaS founders on why uptime monitoring matters from launch day — and how to set it up in minutes.