Most outages don't start with hardware failures or traffic spikes. They start with deployments.
A bad configuration value. A missing environment variable. A database migration that takes longer than expected. A container image that builds successfully but crashes on startup. Each of these passes CI checks, merges to main, and deploys — then breaks production.
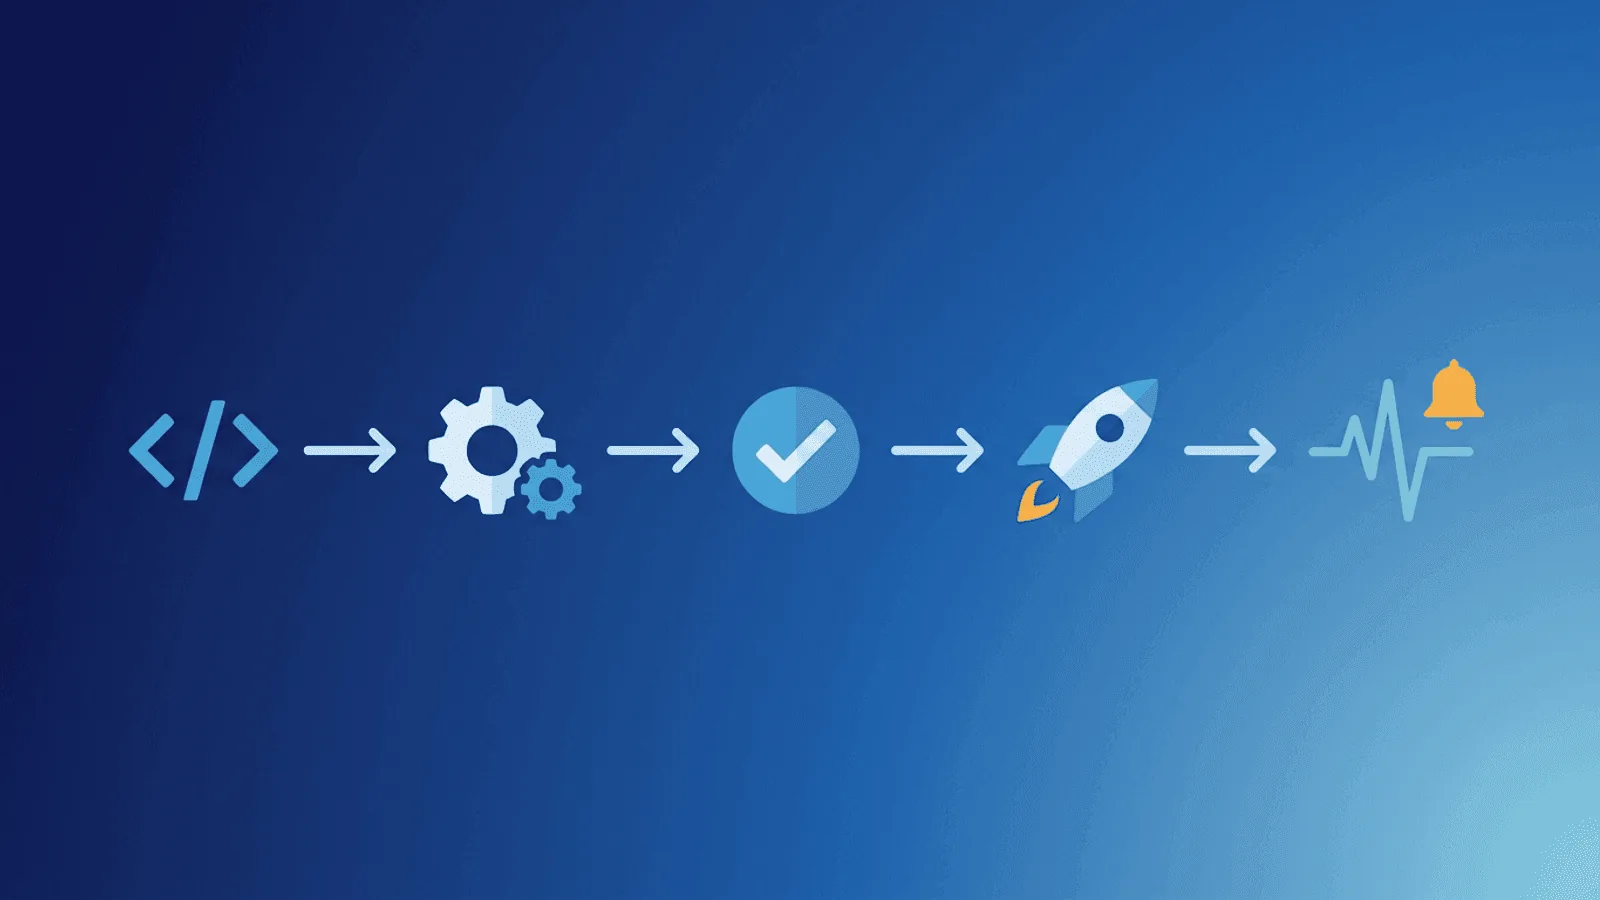
CI/CD pipelines are designed to ship code fast. But shipping fast without monitoring the deployment process itself is like flying blind. You need to know when a deployment starts, whether it completes, and if the service is actually healthy afterward.
This guide covers what to monitor in your CI/CD pipeline and how to catch deployment failures before users notice.
Why Deployments Are the Riskiest Moment
Every deployment introduces change, and change introduces risk. Even with thorough testing, production has variables that staging environments don't fully replicate:
- Real traffic volume — Staging doesn't handle production-scale concurrency
- Real data — Production data has edge cases that test fixtures don't
- Real dependencies — Third-party APIs, DNS, CDNs, and caches behave differently at scale
- Real infrastructure — Rolling updates, load balancer draining, and container scheduling add timing complexity
- Real configuration — Environment variables, secrets, and feature flags may differ between environments
Studies consistently show that 60–80% of outages are caused by changes — deployments, configuration updates, and infrastructure modifications. Your CI/CD pipeline is both your most powerful tool and your biggest source of risk.
What to Monitor in Your Pipeline
1. Build Status
The most basic check: did the build complete?
Most CI/CD platforms (GitHub Actions, GitLab CI, Jenkins, CircleCI) provide build status notifications. But notifications alone aren't monitoring. What you need is:
- Build duration tracking — If builds suddenly take 3x longer, something changed. Slow builds delay deployments and create larger, riskier changesets.
- Build failure rate — A steady increase in build failures indicates degrading test stability, flaky dependencies, or infrastructure problems.
- Build queue depth — If builds are queuing instead of running, your CI infrastructure is undersized.
2. Deployment Completion
Build success and deployment success are different things. A build can produce a valid artifact that fails to deploy because of:
- Image registry authentication failures
- Kubernetes admission controller rejections
- Container resource limit violations
- Health check timeouts during rolling updates
- Network policy blocks in the target environment
Monitor that deployments complete, not just that builds pass. The simplest approach: have your deployment script send a heartbeat signal to a monitoring endpoint after a successful deploy. If the heartbeat doesn't arrive within the expected window, something failed.
3. Post-Deployment Health Checks
The deployment succeeded — but is the service actually working?
This is where most CI/CD monitoring falls short. The pipeline reports green, the team moves on, and 15 minutes later users start reporting errors.
Post-deployment health checks should verify:
- HTTP response codes — Are your key endpoints returning 200?
- Response content — Is the response body correct, not an error page?
- Response time — Is latency within acceptable bounds?
- Key workflows — Can users log in, load data, submit forms?
- Database connectivity — Can the application reach its database?
- Background jobs — Are workers processing tasks?
Run these checks immediately after deployment, then again at 5 minutes and 15 minutes. Some issues only appear under sustained traffic.
4. Rollback Triggers
When post-deployment checks fail, you need automated or semi-automated rollback:
- Automatic rollback — If health checks fail within X minutes of deploy, revert to the previous version
- Alert-driven rollback — Alert the on-call engineer with a one-click rollback option
- Canary detection — Route a percentage of traffic to the new version; roll back if error rates increase
The key is speed. The faster you detect a bad deploy, the faster you can roll back, and the fewer users are affected.
Monitoring Patterns for CI/CD
Heartbeat Pattern: Verify Deploys Complete
The heartbeat pattern is the simplest and most reliable way to monitor deployment completion.
How it works:
- Configure a heartbeat monitor that expects a signal every N hours (matching your deploy frequency)
- Add a step at the end of your deployment script that sends an HTTP POST to the heartbeat URL
- If the heartbeat doesn't arrive on schedule, the monitor alerts
This catches:
- Deployments that hang
- Deployments that silently fail
- Pipeline infrastructure outages (CI/CD platform down)
- Deploys that never start (cron scheduler failures, webhook misses)
Example: GitHub Actions heartbeat step
- name: Signal deploy complete
  if: success()
  run: curl -fsS --retry 3 https://heartbeat.web-alert.io/your-heartbeat-id
Example: GitLab CI heartbeat step
signal-deploy:
  stage: deploy
  script:
    - curl -fsS --retry 3 https://heartbeat.web-alert.io/your-heartbeat-id
  when: on_success
HTTP Check Pattern: Validate Post-Deploy Health
After the deployment completes, external HTTP checks confirm the service is actually working from the user's perspective.
What to check:
- Your homepage or primary endpoint
- Your API health endpoint
- A critical user-facing workflow (login page, dashboard, checkout)
- Your webhook or integration endpoints
Why external checks matter:
Internal health checks (like Kubernetes liveness probes) only verify the application process is running. External checks verify the full stack: DNS resolution, load balancer routing, SSL termination, application response, and content correctness.
A service can pass internal health checks while being unreachable externally due to:
- DNS propagation delays after a deploy
- Load balancer configuration changes
- CDN cache invalidation failures
- Firewall rule updates
- SSL certificate rotation issues
Version Endpoint Pattern: Confirm the Right Code Is Running
Add a version or build endpoint to your application that returns the current deployment version:
GET /health
{
  "status": "ok",
  "version": "v2.4.1",
  "commit": "a1b2c3d",
  "deployed_at": "2026-03-08T14:30:00Z"
}
After deployment, your monitoring or deployment script checks this endpoint to confirm the new version is actually serving traffic. This catches:
- Rolling updates that stall partway through
- Load balancers still routing to old instances
- Deployments that report success but don't actually update the running containers
- Blue-green switches that didn't flip
Smoke Test Pattern: Validate Key Workflows
Go beyond simple status checks. After each deployment, run a lightweight smoke test suite that exercises critical paths:
- Authentication — Can a test user log in?
- Data retrieval — Does the API return expected data?
- Write operations — Can the service process a test event?
- External integrations — Are webhooks, email, and notification services connected?
Keep smoke tests fast (under 60 seconds) and deterministic. They should run after every deploy, not just nightly.
Common CI/CD Failure Modes
| Failure Mode | Symptom | Detection Method |
|---|---|---|
| Build hangs | Pipeline runs indefinitely | Build duration monitoring, timeout alerts |
| Deploy fails silently | Pipeline completes but service isn't updated | Version endpoint check, heartbeat monitoring |
| Rolling update stalls | Some pods updated, others stuck on old version | Version endpoint check, pod status monitoring |
| Database migration timeout | Deploy blocks on schema change | Deploy duration monitoring, health check failure |
| Config/secret missing | App starts but crashes on first request | Post-deploy HTTP check with content validation |
| Memory leak in new version | Service works initially, degrades over hours | Response time monitoring, delayed health checks |
| Incompatible dependency | Service crashes after traffic builds up | Error rate monitoring, external health checks |
| Certificate not renewed | Deploy succeeds but HTTPS breaks | SSL monitoring, external HTTPS checks |
| Queue backlog | Workers deploy successfully but can't process jobs | Heartbeat monitoring for job processors |
| Feature flag misconfiguration | Service works but feature behaves unexpectedly | Content validation, smoke tests |
Building a CI/CD Monitoring Stack
Minimum viable monitoring
For small teams with simple pipelines:
- Heartbeat monitor for each deployment pipeline — alert if a deploy doesn't complete on schedule
- HTTP check on your primary endpoint — alert if the service is unreachable after deploy
- SSL check — alert before certificate expiry, catch deploy-related certificate issues
This takes 10 minutes to set up and catches the most common deployment failures.
Comprehensive monitoring
For teams with complex pipelines, multiple services, and strict SLAs:
- Heartbeat monitors for every pipeline stage (build, test, deploy, post-deploy)
- HTTP checks on all critical endpoints from multiple regions
- Content validation to confirm correct responses, not just status codes
- Response time monitoring with baseline comparison
- Version endpoint checks after each deploy
- Smoke test suite triggered post-deployment
- SSL and DNS monitoring for infrastructure changes
- On-call routing so the deploying engineer is alerted first
- Status page updates to communicate deploy-related issues
CI/CD Platform Integration Tips
GitHub Actions
- Use the
if: success()condition for heartbeat signals so they only fire on successful deploys - Set
timeout-minuteson deployment jobs to catch hangs - Use environment protection rules to require manual approval for production deploys
- Configure deployment status webhooks to notify your monitoring system
GitLab CI
- Use
when: on_successfor heartbeat jobs - Configure pipeline timeout settings
- Use deployment environments with approval gates
- Leverage GitLab's built-in deployment tracking with external monitoring
Jenkins
- Add a post-build step for heartbeat signals
- Configure build timeout plugins
- Use the deployment notification plugin to trigger external monitoring checks
- Set up pipeline failure notifications to your alerting channels
General best practices
- Don't monitor just the pipeline — monitor the result. A green pipeline that produces a broken deployment is the most dangerous kind of failure.
- Set deploy-time alerts to high priority. Deployment failures need immediate attention because they affect all users.
- Include deploy context in alerts. The alert should tell you which commit, which service, and which environment failed.
- Keep a deploy log. Record every deployment with timestamp, version, deployer, and health check results. This is invaluable during incident investigations.
How Webalert Helps
Webalert provides the external monitoring layer that validates your deployments from the user's perspective:
- Heartbeat monitoring — Verify that deployments complete on schedule. If your pipeline doesn't send the expected heartbeat, get alerted immediately.
- HTTP/HTTPS checks — Validate that your endpoints are returning correct responses after each deploy, from multiple global regions.
- Content validation — Go beyond status codes. Check that response bodies contain expected content.
- Response time tracking — Detect deployment-related performance regressions.
- SSL monitoring — Catch certificate issues that deployments can introduce.
- Multi-channel alerts — Get notified via Email, SMS, Slack, Discord, Microsoft Teams, or webhooks — wherever your team works.
- On-call scheduling — Route deployment failure alerts to the deploying engineer or on-call rotation.
- Status pages — Automatically update your status page when deployment-related incidents occur.
See features and pricing for the full details.
Summary
- Deployments cause 60–80% of outages — your CI/CD pipeline is both your most powerful tool and your biggest risk.
- Monitor the full cycle — build status, deployment completion, post-deploy health, and rollback triggers.
- Use heartbeat monitoring to verify deploys complete. If the heartbeat doesn't arrive, something failed.
- Run external health checks after every deployment. Internal checks aren't enough — verify from the user's perspective.
- Check the version endpoint to confirm the new code is actually serving traffic.
- Automate rollbacks based on monitoring signals. The faster you detect, the faster you recover.
- Start simple — a heartbeat monitor and an HTTP check catch the majority of deployment failures.
The best CI/CD pipeline ships code fast and confirms it works. Monitoring is what closes the loop.