When your database goes down, your application goes down. It doesn't matter how resilient your application code is — if the database won't accept connections, your users see errors.
Database failures are also among the most expensive failures. Every query fails. Every page that needs data fails. Revenue, session data, order processing — all of it stops until the database is back.
Yet most teams monitor their databases less rigorously than their web servers. They assume the database is running because the application was working an hour ago. They find out about database problems the same way their users do.
This guide covers how to monitor MySQL, PostgreSQL, and Redis effectively — from connectivity checks to performance monitoring — and how to get alerted before your users notice a problem.
Why Database Monitoring Is Different
Databases fail differently from web applications. Where a web app might return a 500 error, a database failure often manifests as:
- Connection timeout — The application hangs waiting for a database connection that never comes
- Connection refused — The database process isn't running or the port is blocked
- Authentication failure — Credentials changed or the user was revoked
- Connection pool exhaustion — Too many concurrent connections, new ones are rejected
- Replication lag — Read replicas are serving stale data, causing subtle data inconsistencies
- Disk full — The database can't write new data, causing partial failures
Many of these failure modes don't produce obvious errors immediately — they cause slowness and intermittent failures that escalate into full outages over time. Early detection is everything.
The Database Monitoring Stack
Complete database monitoring has three layers:
Layer 1: Connectivity monitoring (external) Can anything connect to the database at all? Is the port open? Is the process running? This is the most fundamental check — if it fails, everything else is moot.
Layer 2: Application-layer monitoring (via health endpoints) Does your application successfully connect to the database? Does a test query succeed? This layer sits one level up and catches authentication failures, permission issues, and query-level problems.
Layer 3: Performance and capacity monitoring (internal) How many connections are active? What's the query latency? Is replication keeping up? Is disk usage growing? This layer requires internal access to database metrics.
This guide focuses primarily on Layers 1 and 2 — the external and application-layer checks that catch the outages that matter most.
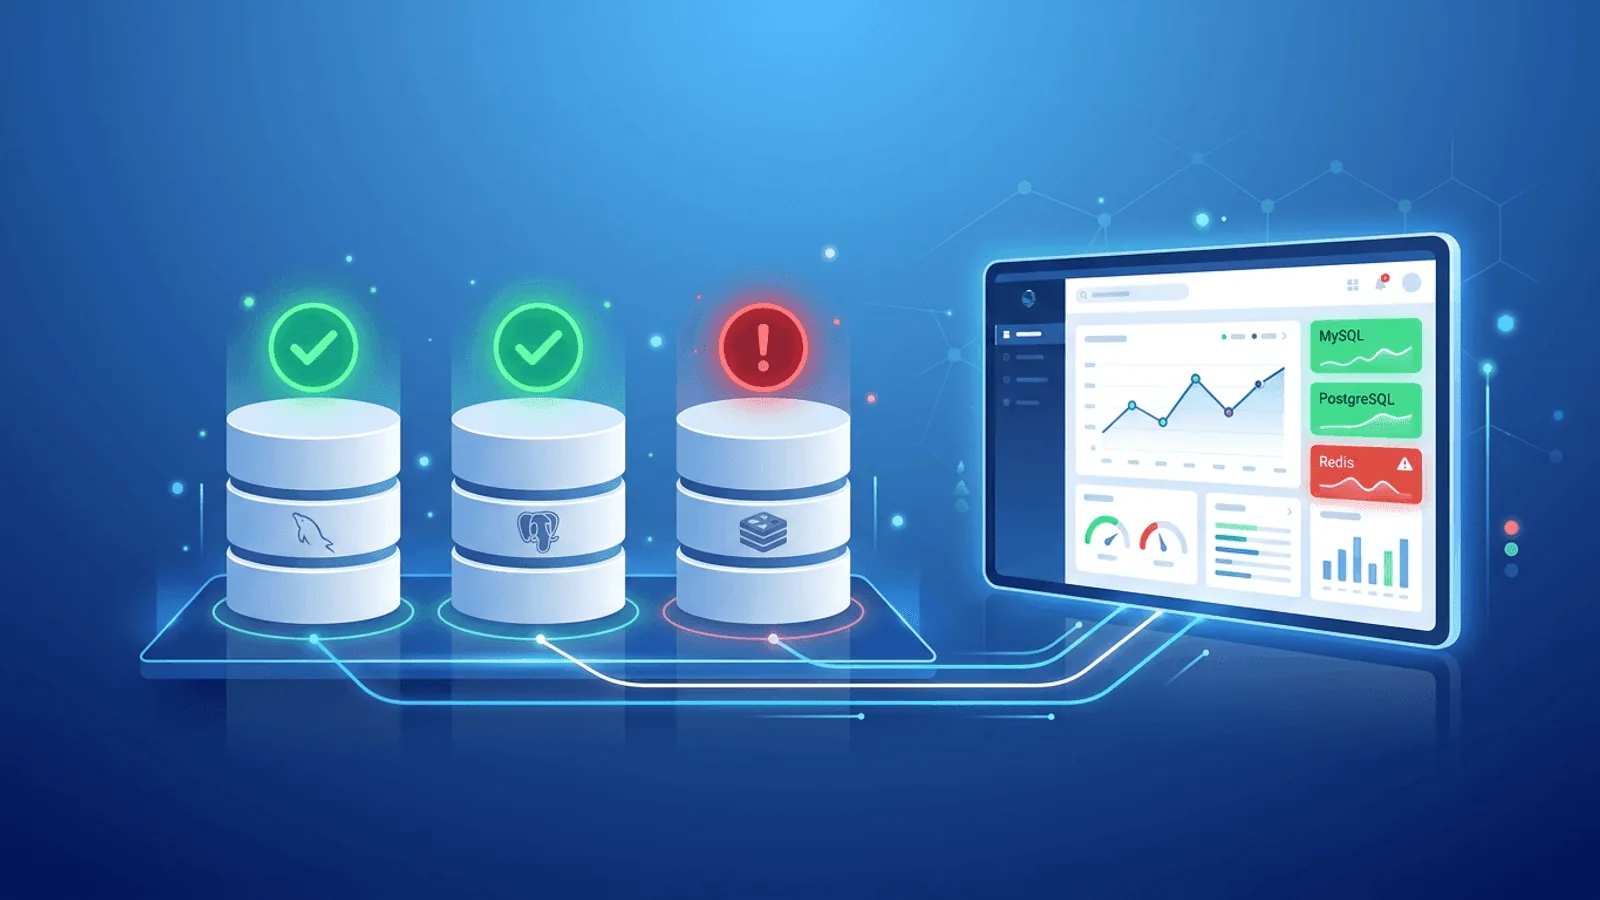
MySQL Monitoring
MySQL is the world's most widely deployed open-source relational database. It's the "M" in the LAMP and LEMP stacks and runs under most WordPress, Laravel, and PHP applications.
TCP port check
MySQL listens on port 3306 by default. The simplest database health check is a TCP connection test to that port:
TCP check: your-db-host.com:3306
If the TCP check fails, MySQL is either not running or unreachable due to a firewall change. This check runs from outside your database host and detects:
- MySQL process stopped (crash, OOM kill, manual stop)
- Host unreachable (network issue, instance shutdown)
- Firewall or security group change blocking the port
- Port binding failure after a restart
Configure in Webalert: Create a TCP monitor with your database host and port 3306.
Application health endpoint
Rather than connecting directly to MySQL for monitoring, expose a health endpoint in your application that tests the database connection:
# FastAPI example
from sqlalchemy import text

@app.get("/health/db")
async def database_health():
    try:
        async with engine.connect() as conn:
            await conn.execute(text("SELECT 1"))
        return {"status": "ok", "database": "connected"}
    except Exception as e:
        return JSONResponse(
            status_code=503,
            content={"status": "error", "database": str(e)}
        )
// Express + mysql2 example
app.get('/health/db', async (req, res) => {
  try {
    await pool.execute('SELECT 1');
    res.json({ status: 'ok', database: 'connected' });
  } catch (err) {
    res.status(503).json({ status: 'error', database: err.message });
  }
});
Monitor this endpoint with an HTTP check that validates the response body contains "status":"ok". This catches:
- Successful TCP connection but failed authentication
- MySQL running but application credentials revoked
- Database-level permission issues
- MySQL running but accepting no new connections (max_connections reached)
MySQL-specific failure modes
max_connections exceeded
MySQL has a configurable limit on simultaneous connections (default: 151). When it's reached, new connections are rejected with Too many connections. Your application starts returning errors even though MySQL is "running."
Detection: Your application health endpoint returns 503. TCP check passes (process is running) but application check fails.
InnoDB buffer pool exhaustion When MySQL runs low on memory, query performance degrades significantly before queries start failing outright.
Detection: Response time increase on your application endpoints, visible in response time monitoring before the full outage.
Replication lag (with read replicas) If your application reads from replicas, replication lag means reads return stale data. This causes subtle data inconsistency bugs rather than hard failures.
Detection: Application-level checks that verify recently written data is readable from the replica.
PostgreSQL Monitoring
PostgreSQL is the most feature-rich open-source relational database and is increasingly the default choice for new applications. It's known for correctness, reliability, and extensibility.
TCP port check
PostgreSQL listens on port 5432 by default:
TCP check: your-db-host.com:5432
Same as MySQL — this catches process crashes, host unreachability, and firewall changes.
Application health endpoint
# FastAPI + asyncpg example
import asyncpg

@app.get("/health/db")
async def database_health():
    try:
        conn = await asyncpg.connect(DATABASE_URL)
        await conn.fetchval("SELECT 1")
        await conn.close()
        return {"status": "ok", "database": "connected"}
    except Exception as e:
        return JSONResponse(
            status_code=503,
            content={"status": "error", "database": str(e)}
        )
// Go + pgx example
http.HandleFunc("/health/db", func(w http.ResponseWriter, r *http.Request) {
    err := pool.QueryRow(context.Background(), "SELECT 1").Scan(nil)
    if err != nil {
        w.WriteHeader(503)
        json.NewEncoder(w).Encode(map[string]string{"status": "error", "database": err.Error()})
        return
    }
    json.NewEncoder(w).Encode(map[string]string{"status": "ok", "database": "connected"})
})
PostgreSQL-specific failure modes
Connection pool exhaustion (max_connections)
PostgreSQL has a max_connections setting (default: 100). Unlike MySQL, PostgreSQL spawns a new process per connection, making connection exhaustion particularly resource-intensive.
Common solution: Use a connection pooler like PgBouncer between your application and PostgreSQL. Monitor PgBouncer's health separately.
Detection: Application health endpoint returns 503 with connection error. TCP check passes.
Write-ahead log (WAL) disk space If PostgreSQL's WAL fills the disk, writes fail. PostgreSQL enters a read-only mode or crashes.
Detection: Application health endpoint fails for write operations. Disk space monitoring (if available) shows high usage.
Autovacuum blocking Long-running transactions prevent autovacuum from cleaning up dead tuples, causing table bloat and eventually query slowdowns.
Detection: Response time increase on database-heavy endpoints, caught by response time monitoring.
Streaming replication lag PostgreSQL streaming replication can fall behind under heavy write loads or network issues. Read replicas serve stale data.
Detection: Application-level data consistency checks on read replicas.
Redis Monitoring
Redis is an in-memory data store used for caching, session management, queues, pub/sub, and real-time leaderboards. It's not a persistent primary database for most applications, but losing Redis often makes the application unusable anyway — sessions invalidate, caches miss, queues stop processing.
TCP port check
Redis listens on port 6379 by default:
TCP check: your-redis-host.com:6379
This catches Redis process crashes and network unreachability.
Application health endpoint
# FastAPI + aioredis example
import aioredis

@app.get("/health/cache")
async def cache_health():
    try:
        redis = await aioredis.from_url(REDIS_URL)
        await redis.ping()
        await redis.close()
        return {"status": "ok", "cache": "connected"}
    except Exception as e:
        return JSONResponse(
            status_code=503,
            content={"status": "error", "cache": str(e)}
        )
Redis-specific failure modes
Memory limit reached (maxmemory)
Redis has a configurable maxmemory limit. When it's reached, Redis's eviction policy kicks in. With noeviction policy, write commands fail with an error. With volatile or allkeys eviction, keys start being evicted unexpectedly.
Detection: Application errors on Redis write operations, application health endpoint reports cache errors.
RDB snapshot or AOF write failure If Redis is configured for persistence and fails to write snapshots or append-only log entries (e.g., disk full), it may refuse writes or crash.
Detection: Redis process crash detected by TCP check failing.
Redis running but application can't authenticate
If Redis is configured with a password (requirepass) and the application's password is wrong or expired, connections fail authentication.
Detection: Application health endpoint returns 503 with authentication error. TCP check passes.
Keyspace eviction surprise Under memory pressure, Redis evicts keys that your application expects to exist. Sessions disappear, caches miss unexpectedly.
Detection: Application-level monitoring that tracks cache hit rates and session validity.
What to Monitor: The Database Monitoring Checklist
TCP connectivity (all databases)
- MySQL port 3306
- PostgreSQL port 5432
- Redis port 6379
- Any other database ports in use
Check every 1 minute. Configure alerts after 2 consecutive failures.
Application health endpoints
-
/health/db— Tests active database query (SELECT 1 or equivalent) -
/health/cache— Tests Redis ping -
/healthor/readyz— Combined check for all dependencies
Use content validation: verify response contains "status":"ok", not just HTTP 200.
Response time
- Track response time on database-heavy endpoints
- Alert when sustained response time exceeds 2-3x baseline
- This catches degradation (max connections, bloat, slow queries) before full outage
SSL certificates for database connections
If your database uses SSL/TLS for connections (mandatory for cloud-managed databases like RDS, Cloud SQL, Azure Database):
- Monitor certificate expiry for your database SSL cert
- Alert at 30 and 7 days before expiry
Heartbeat for database-dependent jobs
If you have jobs that read/write the database on a schedule (backups, ETL, data cleanup):
- Set up heartbeat monitoring for each critical job
- Alert if the heartbeat is missed within the expected window
Alerting Strategy for Database Issues
Database failures are almost always P1 — they affect all users, not just some. Tier your alerts accordingly:
Immediate (page on-call):
- TCP check fails (database unreachable)
- Application health endpoint returns 503
- Response time >5x baseline sustained for 2+ minutes
Urgent (alert team channel):
- Response time 2-3x baseline sustained
- Heartbeat missed for database-dependent jobs
Informational:
- SSL certificate expiring within 30 days
How Webalert Monitors Databases
Webalert provides the external monitoring checks your database needs:
- TCP port monitoring — Check that MySQL (3306), PostgreSQL (5432), and Redis (6379) ports accept connections, every minute
- HTTP health endpoint monitoring — Check your application's
/health/dband/health/cacheendpoints with content validation - Response time tracking — Detect gradual database performance degradation before it becomes an outage
- SSL certificate monitoring — Track database SSL cert expiry for cloud-managed databases
- Heartbeat monitoring — Verify database backups and ETL jobs complete on schedule
- Multi-region checks — Confirm your database is reachable from multiple locations (useful for cloud databases with network restrictions)
- Fast alerting — Slack, Discord, Microsoft Teams, SMS, email — alerts to whoever is on-call when a database check fails
- On-call scheduling — Route database alerts to the DBA or backend engineer on rotation
Your database is the foundation your application is built on. Make sure someone is watching it.
See features and pricing for the full details.
Summary
- Database failures are P1 by definition — every user is affected, revenue stops, sessions break.
- TCP port checks are your first line of defense — they catch process crashes, network issues, and firewall changes within minutes.
- Application health endpoints add depth — they catch authentication failures, connection pool exhaustion, and query-level problems that TCP checks miss.
- Redis failures are often overlooked — losing a cache layer often makes the application as unusable as losing the primary database.
- Monitor response time as an early warning signal — database degradation shows up in response time before it causes outright failures.
- Layer your alerts: TCP failure → immediate page. Response time degradation → urgent channel alert. SSL/heartbeat → informational.
The database doesn't need to be completely down to cause serious problems. Good monitoring catches the warning signs early.