
Connection Refused vs Reset vs Timed Out: What They Mean
Connection refused, reset, and timed out mean very different things. What each error reveals about where a failure is, and how to monitor and debug them.

Packet Loss Monitoring: Causes, Detection, and Fixes
What packet loss is, what causes it, how to monitor and measure it, what counts as acceptable, and how to diagnose and fix it before users notice.
10 Best Free Uptime Monitoring Tools in 2026 (Compared)
Compare the 10 best free uptime monitoring tools — check intervals, monitor limits, alert channels (email/Slack/SMS), and which free uptime monitor is right for you.
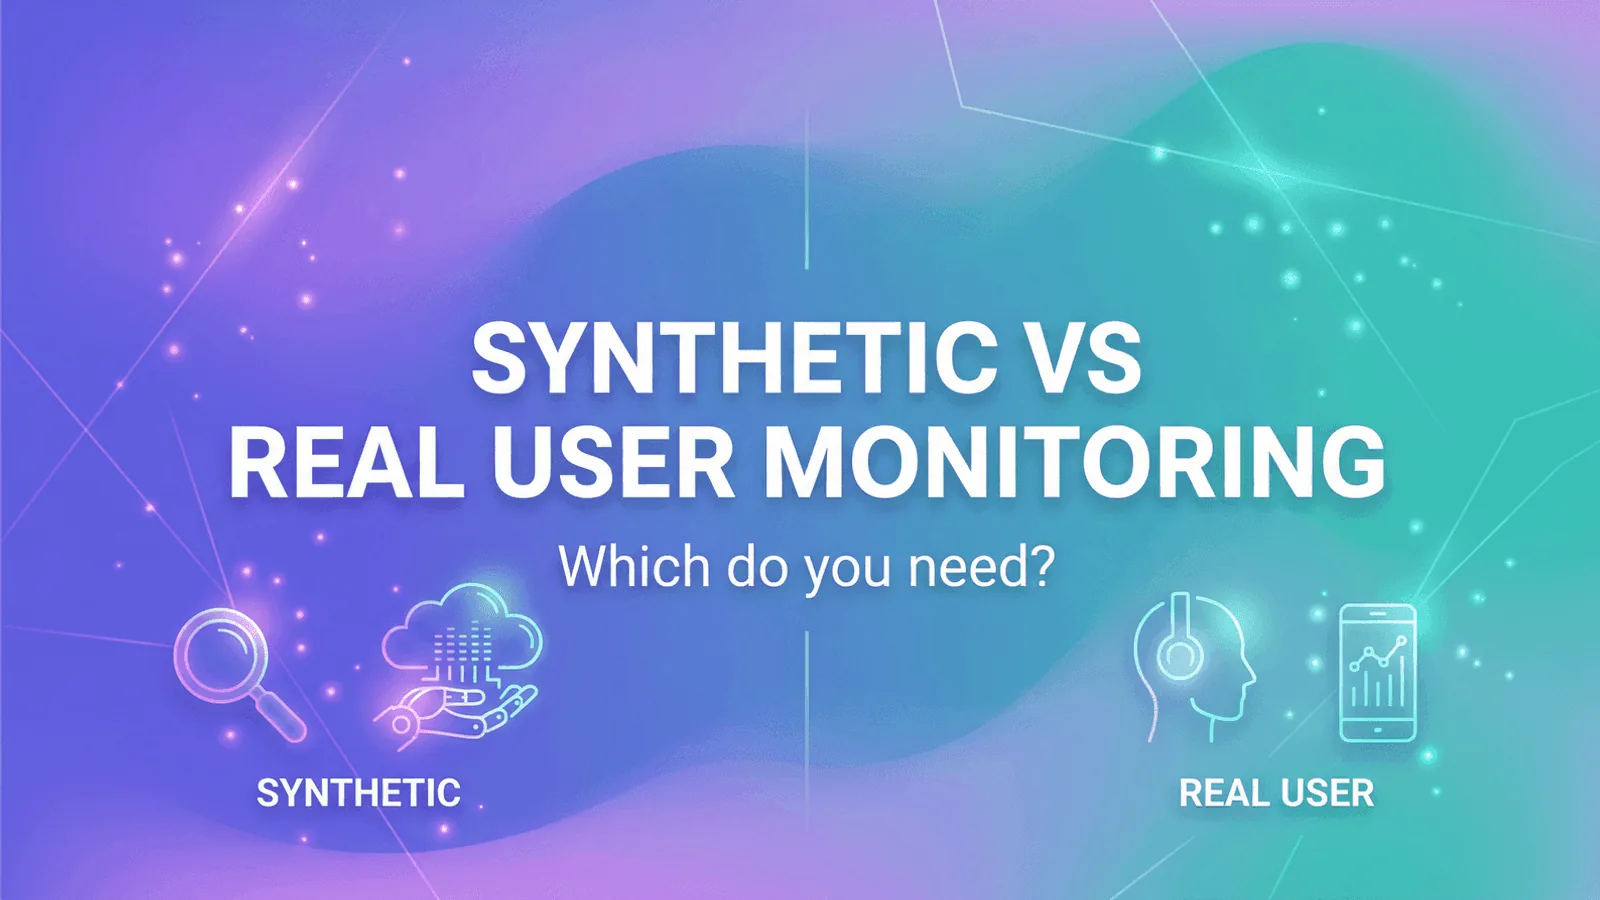
Synthetic Monitoring vs Real User Monitoring (RUM): Key Differences
Synthetic monitoring vs RUM: which catches downtime first, which measures real user experience, and when to use one, the other, or both. Complete comparison guide.
Website Down Checker: How to Check If Your Website Is Down & Fix It
Is your website down or just down for you? Use a website down checker to verify real outages, rule out local DNS/cache issues, and fix common downtime causes in minutes.

How to Evaluate a Vendor SLA: What to Look For
How to read and evaluate a vendor SLA before you sign — uptime definitions, service credits, exclusions, claim windows, and the questions to ask.

How to Create a Website Status Report (Template & Metrics)
Build a website status report stakeholders trust: which uptime, performance and incident metrics to include, a reusable template, and how to automate the data.

Cloud SLAs Compared: What AWS, Azure & GCP Actually Guarantee
Compare AWS, Azure and GCP uptime SLAs — what 99.9%, 99.95% and 99.99% really guarantee, how service credits work, and why the SLA is not your real uptime.

Is My Website Down? How to Check From Outside in 60 Seconds
Find out if your website is really down or only down for you. Step-by-step external checks: DNS, ping, multi-region, third-party tools, and what to do next.

Uptime Downtime Calculator: 99% to 99.999% Allowed Downtime
How much downtime does each uptime percentage actually allow? Full tables from 99% to 99.999% in seconds, minutes, hours and days per day, month and year.

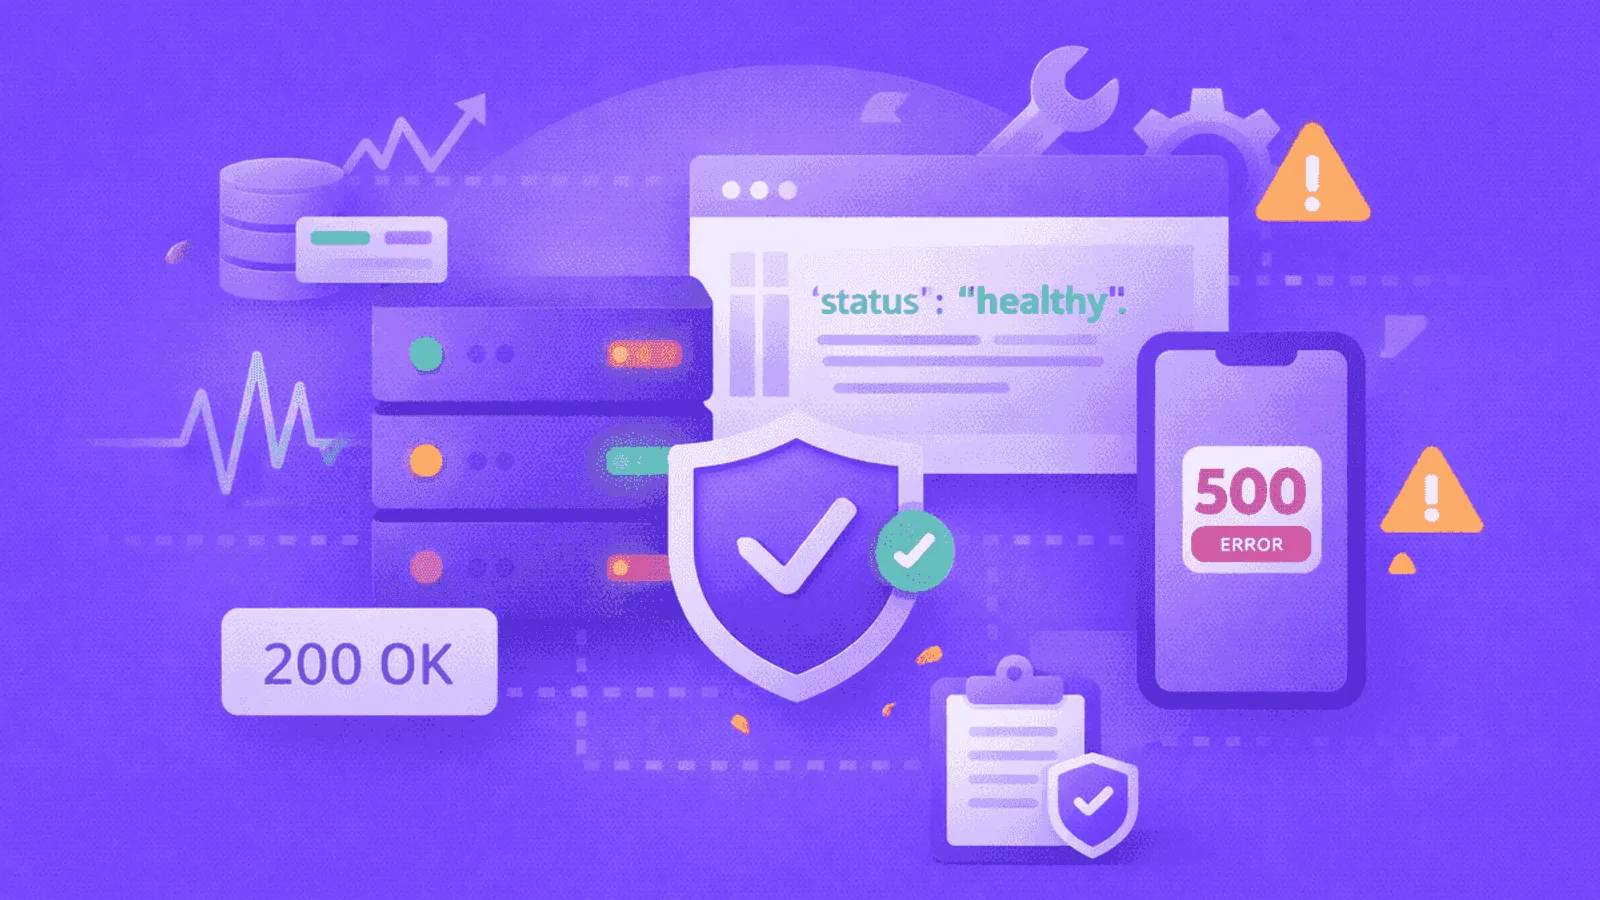
Response Body Validation Monitoring: When 200 OK Lies
HTTP 200 does not mean healthy. Validate response bodies for login pages, empty JSON, error templates, missing fields, and stale builds to catch false-green outages.
INP Monitoring: Interaction to Next Paint Guide
Monitor Interaction to Next Paint (INP) in production. Catch click and input lag before Core Web Vitals slip and SEO suffers.
Auth0, Okta, Clerk: Identity Provider Monitoring
Monitor Auth0, Okta, Clerk, and other identity providers in production. Catch SSO outages, JWT issues, and login failures before users do.

DDoS Monitoring: Detect & Mitigate Traffic Spikes
Monitor DDoS attacks in production. Detect traffic spikes, layer 7 floods, and origin saturation before sites go down.
OpenTelemetry Monitoring: Traces, Metrics, and Logs
Set up OpenTelemetry monitoring in production. Instrument traces, metrics, and logs, then surface incidents without vendor lock-in.
Ruby on Rails Monitoring: Production Uptime Guide
Monitor Ruby on Rails apps in production. Track requests, ActiveRecord, Sidekiq, Action Cable, and deploys before users hit errors.
AI Agent Monitoring: Tool Calls, Loops, and Cost
Monitor AI agents in production. Track tool-call success, runaway loops, cost spikes, and trajectory failures before users notice.
API Rate Limit Monitoring: 429 Errors and Throttling
Monitor API rate limits and 429 throttling errors. Track quota usage, retry-after headers, and avoid surprise outages from third-party caps.
Supabase & Firebase Monitoring: Backend Uptime Guide
Monitor Supabase and Firebase backends in production. Track auth, database, functions, and storage uptime before users hit failures.
5xx Error Rate Monitoring: 500, 502, 503 Alert Guide
Track 5xx server error rates in production. Set alerts on 500, 502, 503 patterns and distinguish app bugs from infrastructure failures.

Vector Database Monitoring: Pinecone, Weaviate, pgvector
Monitor vector databases powering RAG and AI features. Track Pinecone, Weaviate, and pgvector uptime, query latency, and index health.
AI API Monitoring: OpenAI, Anthropic, and Gemini Uptime
Monitor LLM APIs in production. Track OpenAI, Anthropic, and Gemini uptime, latency, rate limits, and failover so AI features stay reliable.
Health Check Endpoints: /health, /livez, /readyz Guide
Design health check endpoints that catch real failures. Learn liveness vs readiness, deep checks, and what to expose to monitors and Kubernetes.
MongoDB Monitoring: Uptime, Replicas, and Clusters
MongoDB fails differently than SQL. Learn to monitor replica sets, sharded clusters, slow queries, and connection pools for production.
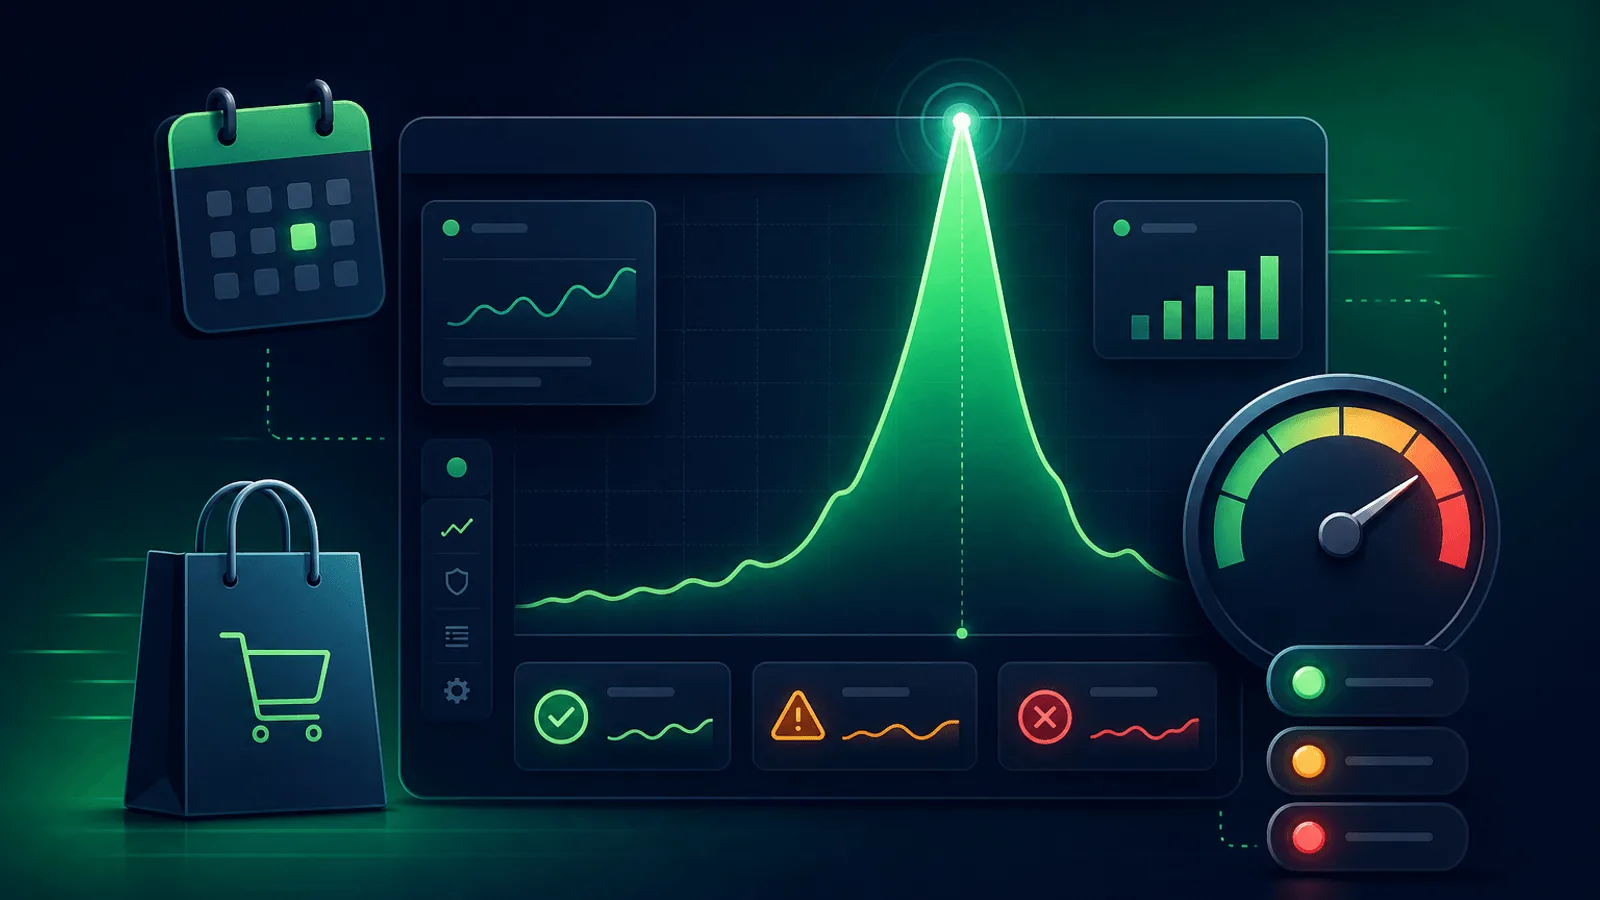
Peak Traffic Monitoring: Black Friday and Launch Days
High-traffic events expose hidden weaknesses. Learn how to prepare monitoring for Black Friday, product launches, and viral traffic spikes.
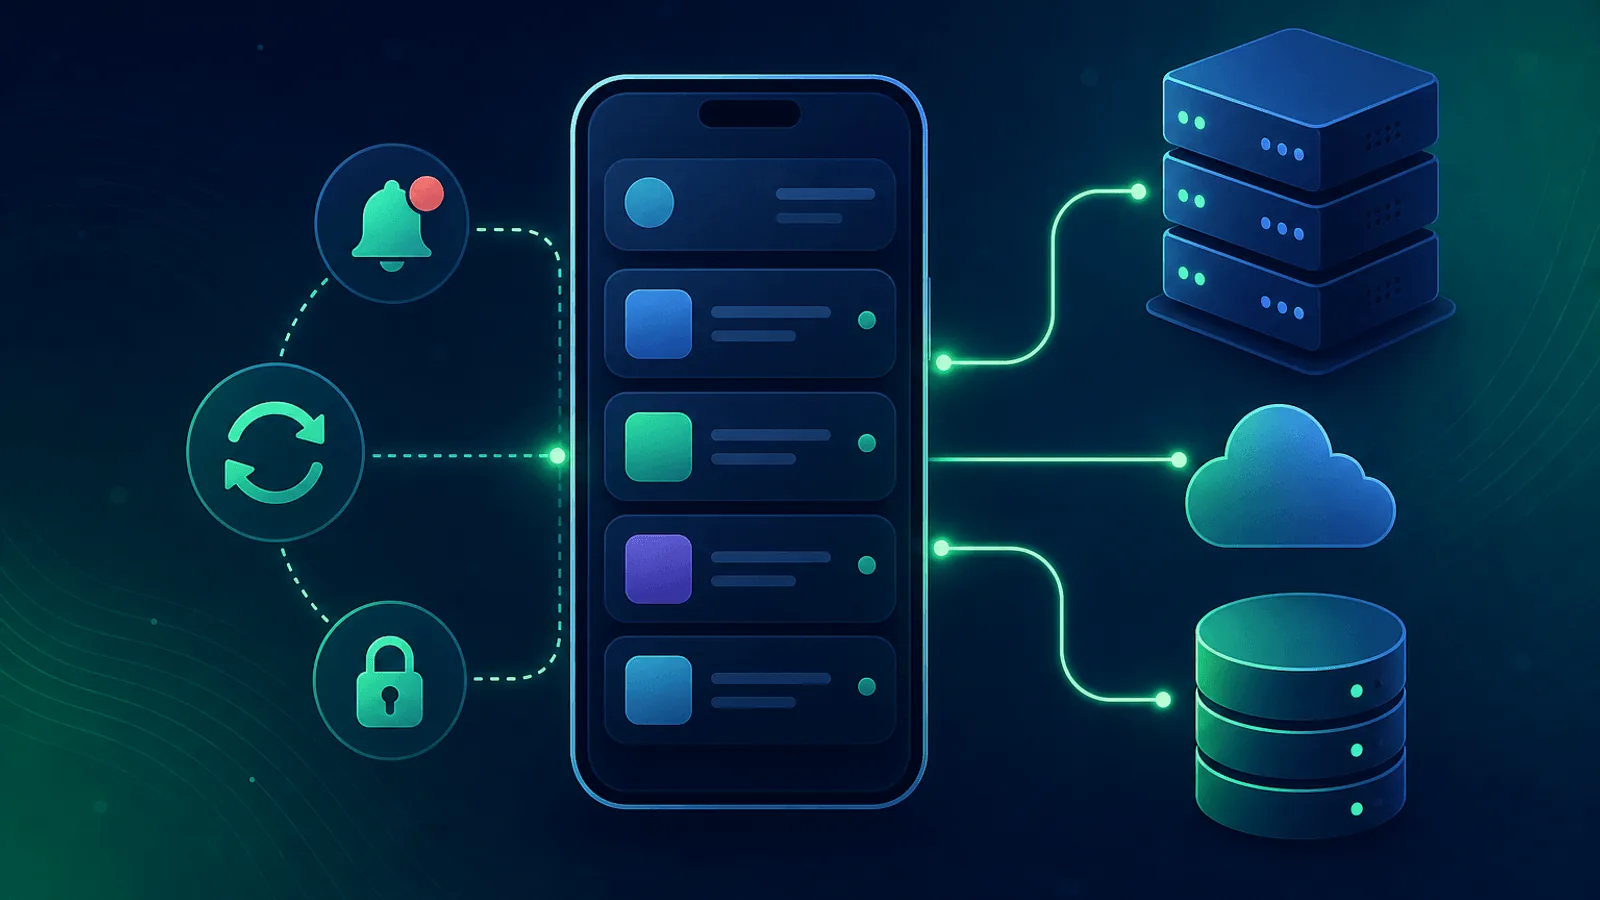
Mobile App Backend Monitoring: API Uptime Guide
Mobile apps fail when the backend fails. Learn how to monitor APIs, push, auth, and offline sync for iOS and Android apps in production.
gRPC Monitoring: Health Checks for Microservices
gRPC fails differently than REST. Learn how to monitor gRPC health, deadlines, streaming, and TLS across your microservice mesh.
How to Monitor a Magento Store for Downtime
Magento powers high-volume stores. Learn how to monitor checkout, extensions, cron, and Adobe Commerce for revenue-saving uptime.
How to Monitor Your Login and Authentication Flow
When login breaks, your whole product breaks. Learn how to monitor sign-in forms, OAuth, SSO, and password reset flows end-to-end.
WebSocket Monitoring: Keep Real-Time Features Online
WebSocket connections fail silently. Learn how to monitor handshakes, latency, message delivery, and reconnect logic for real-time apps.
How to Monitor a WooCommerce Store for Downtime
WooCommerce powers millions of stores. Learn how to monitor checkout, plugins, payment gateways, and WordPress for revenue-saving uptime.
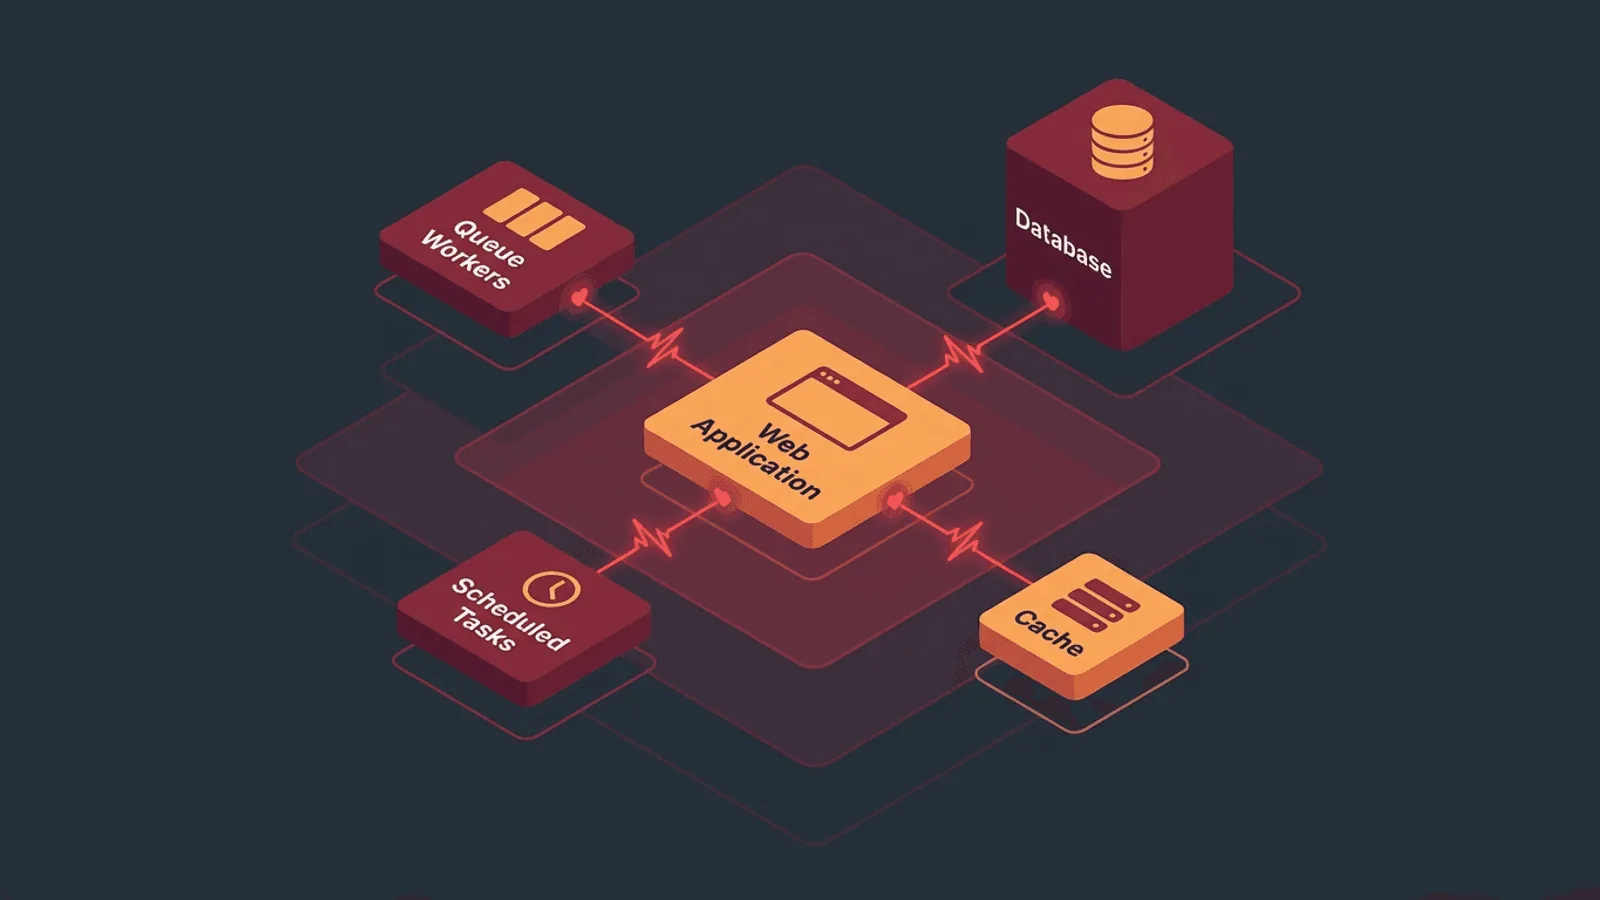
How to Monitor a Django App in Production
Django apps fail beyond the web layer. Learn to monitor Celery workers, scheduled tasks, database health, and deployments.
Website Downtime Cost Calculator: What Every Minute Offline Really Costs
Use this downtime cost calculator framework to estimate lost revenue, support load, churn risk, and the real business impact of every minute offline.
Website Monitoring Checklist: What to Set Up Before an Outage
Use this website monitoring checklist to set up uptime, SSL, DNS, API, cron, alerting, and status page coverage before the next outage.
How to Monitor a Laravel App in Production
Laravel apps fail in ways that HTTP checks alone miss. Learn how to monitor queues, scheduled tasks, API routes, and deployments.
How to Monitor a Shopify Store for Downtime
Shopify outages cost sales every minute. Learn how to monitor your store, checkout flow, and third-party apps for downtime.
Nginx Monitoring: Uptime, Errors, and Performance
Nginx powers a third of the web. Learn how to monitor Nginx for uptime, error rates, slow responses, and misconfigurations before users notice.

How to Monitor a Next.js App in Production
Next.js apps fail differently than traditional sites. Learn how to monitor SSR, API routes, ISR, and edge middleware for real uptime.

Website Security Monitoring: Detect Threats Fast
Hackers change your site silently. Learn how to detect defacement, malware injection, unauthorized changes, and DNS hijacking with monitoring.
Website Monitoring for Non-Technical Founders and PMs
You don't need to be a developer to monitor your website. Learn what to watch, what alerts mean, and how to keep your site reliable.
How to Monitor a Single-Page Application (SPA)
SPAs can return 200 OK with a blank screen. Learn how to monitor React, Vue, and Angular apps with checks that catch real failures.
Multi-Tenant SaaS Monitoring: Per-Customer Uptime
Multi-tenant failures are hard to detect with global checks. Learn how to monitor per-customer uptime, isolate noisy neighbors, and alert by tier.
How to Monitor a REST API: Endpoints, Auth, Errors
REST API monitoring goes beyond ping checks. Learn which endpoints to watch, how to validate responses, and when to alert.
GraphQL API Monitoring: Resolver Performance, Errors, and Uptime
GraphQL monitoring needs more than a 200 response. Learn how to monitor resolver errors, query latency, and endpoint uptime with actionable alerts.
Cloudflare Monitoring: How to Detect Origin Outages Behind a CDN
Your CDN can mask partial failures. Learn how to monitor Cloudflare-routed websites and detect origin outages before customers report them.
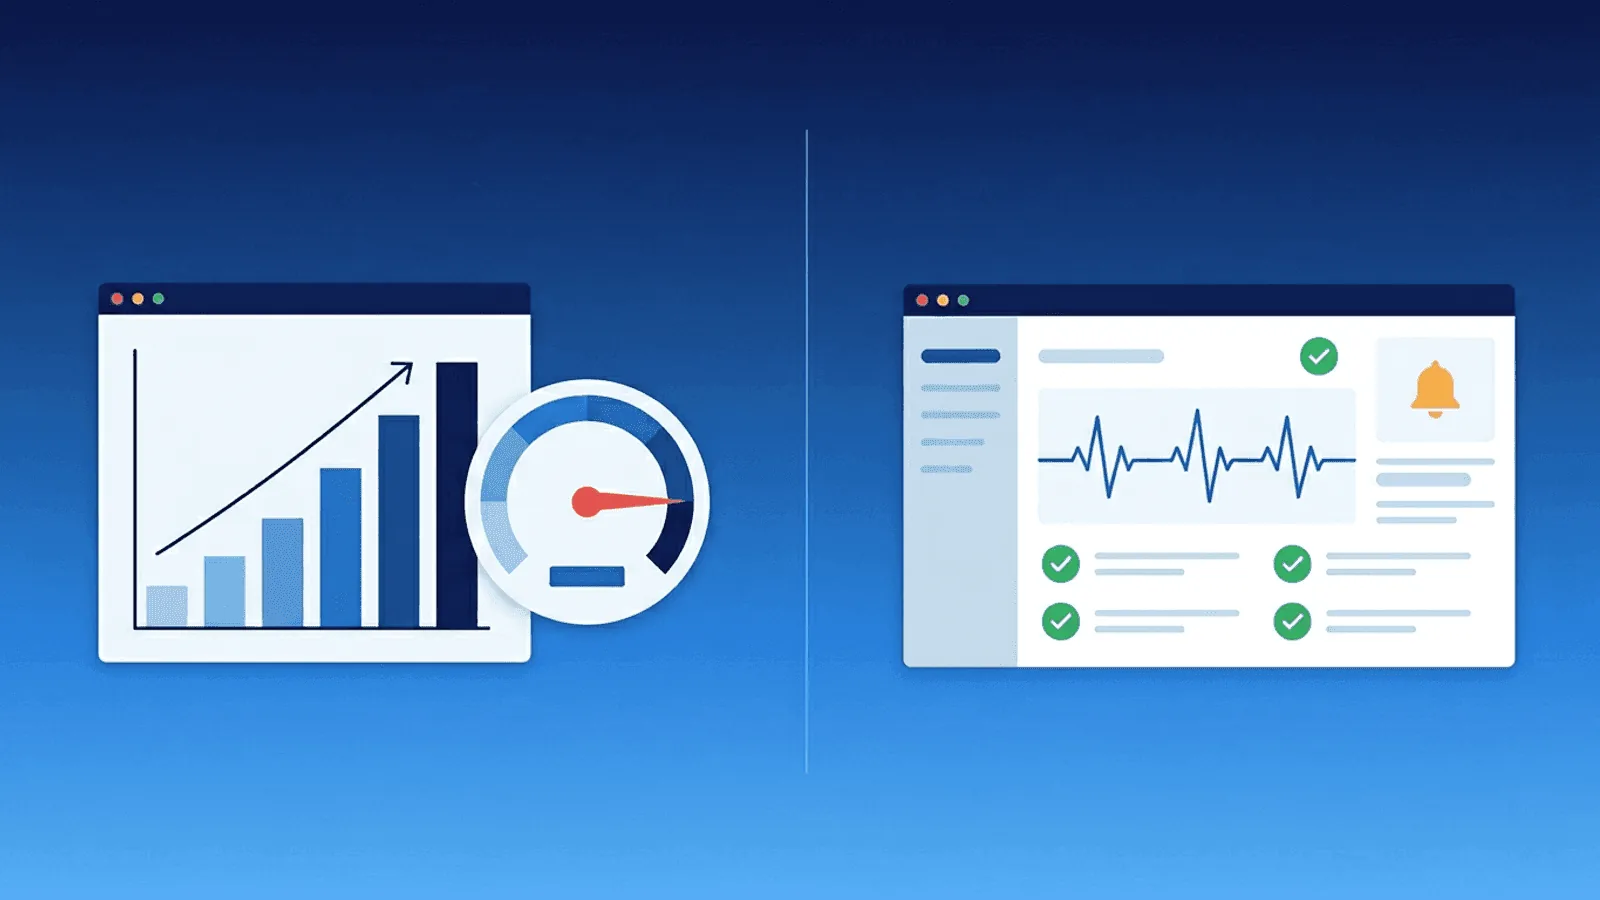
Load Testing vs Monitoring: What's the Difference and When Do You Need Each?
Load testing and monitoring solve different problems. Learn when to use each, how they complement each other, and why you need both for reliable systems.
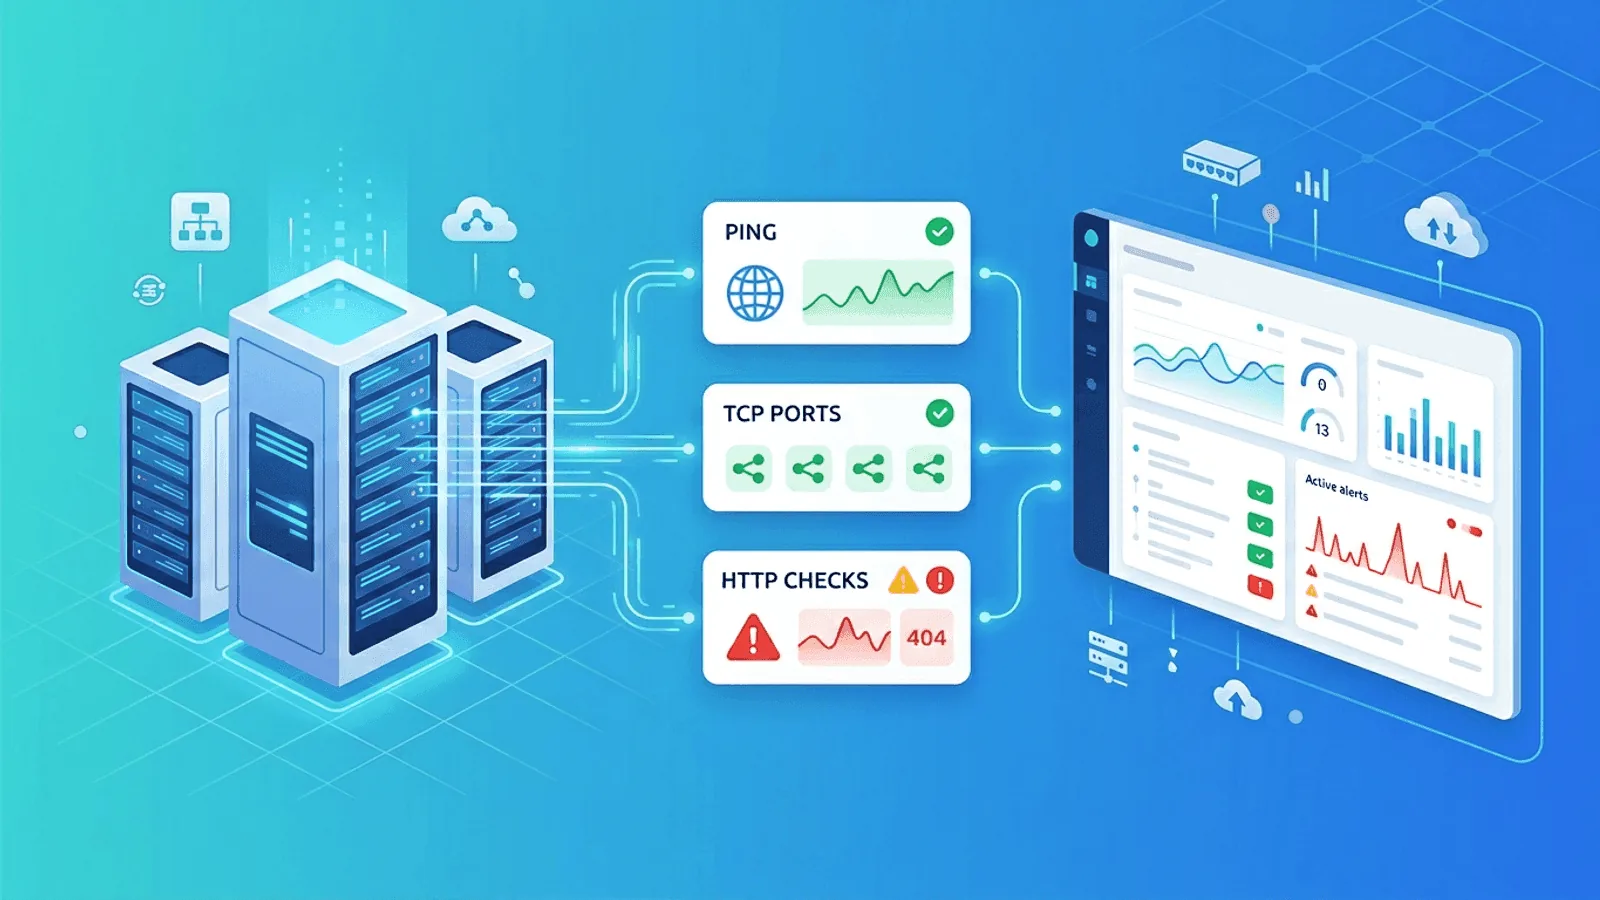
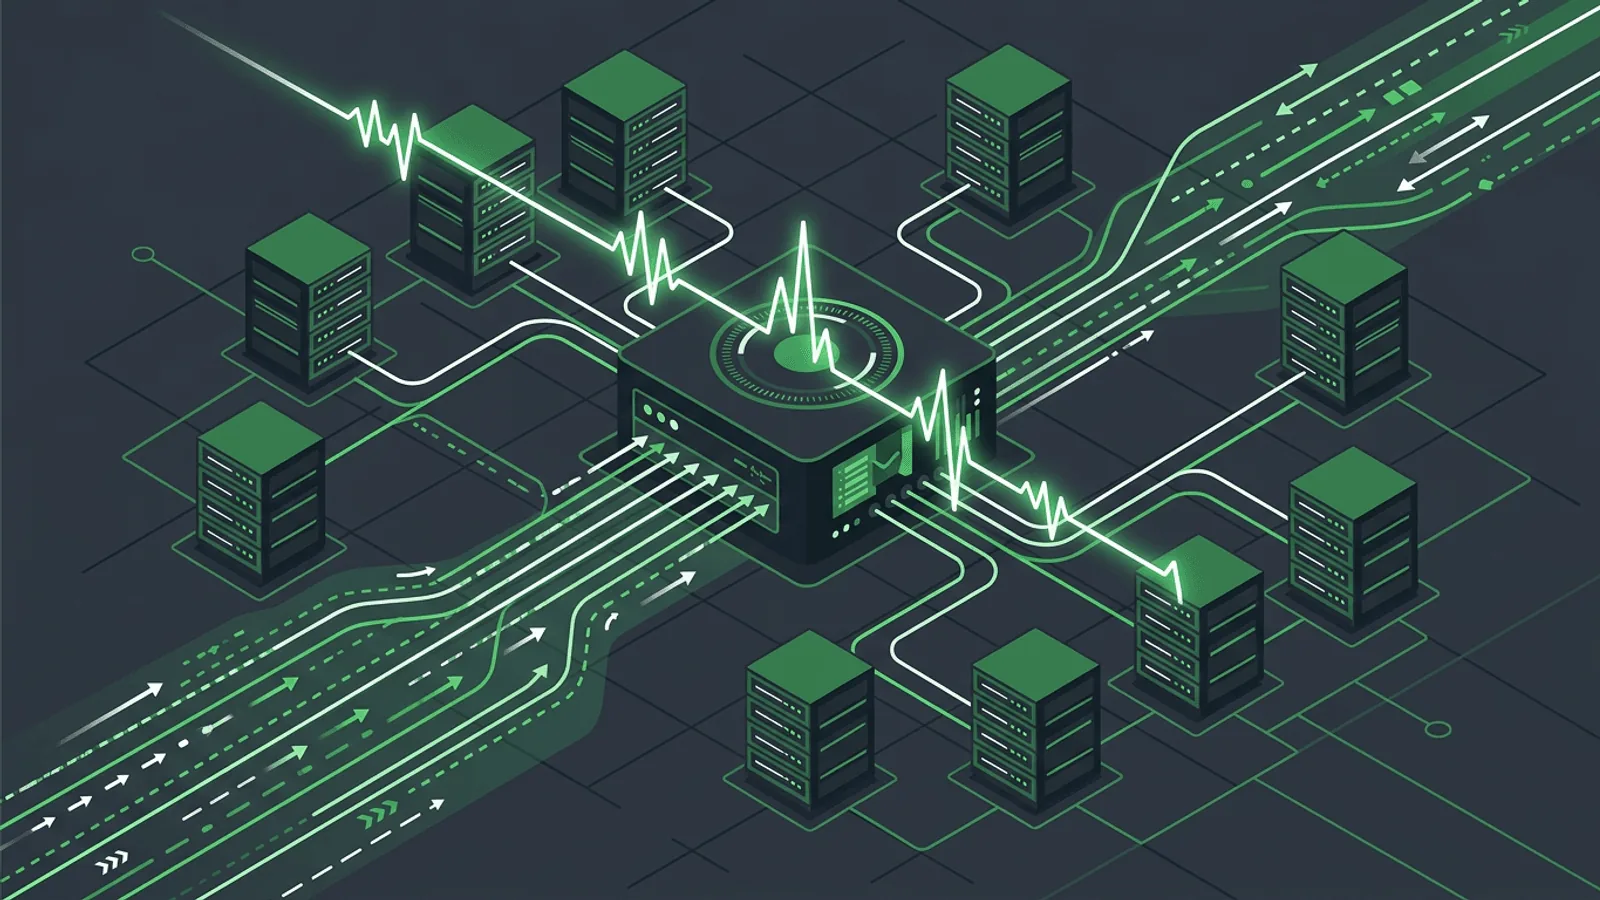
Server Monitoring Basics: Uptime, Reachability, and Response Checks
Server monitoring starts with uptime, reachability, and response checks. Learn what to monitor first and how to catch failures before users notice.
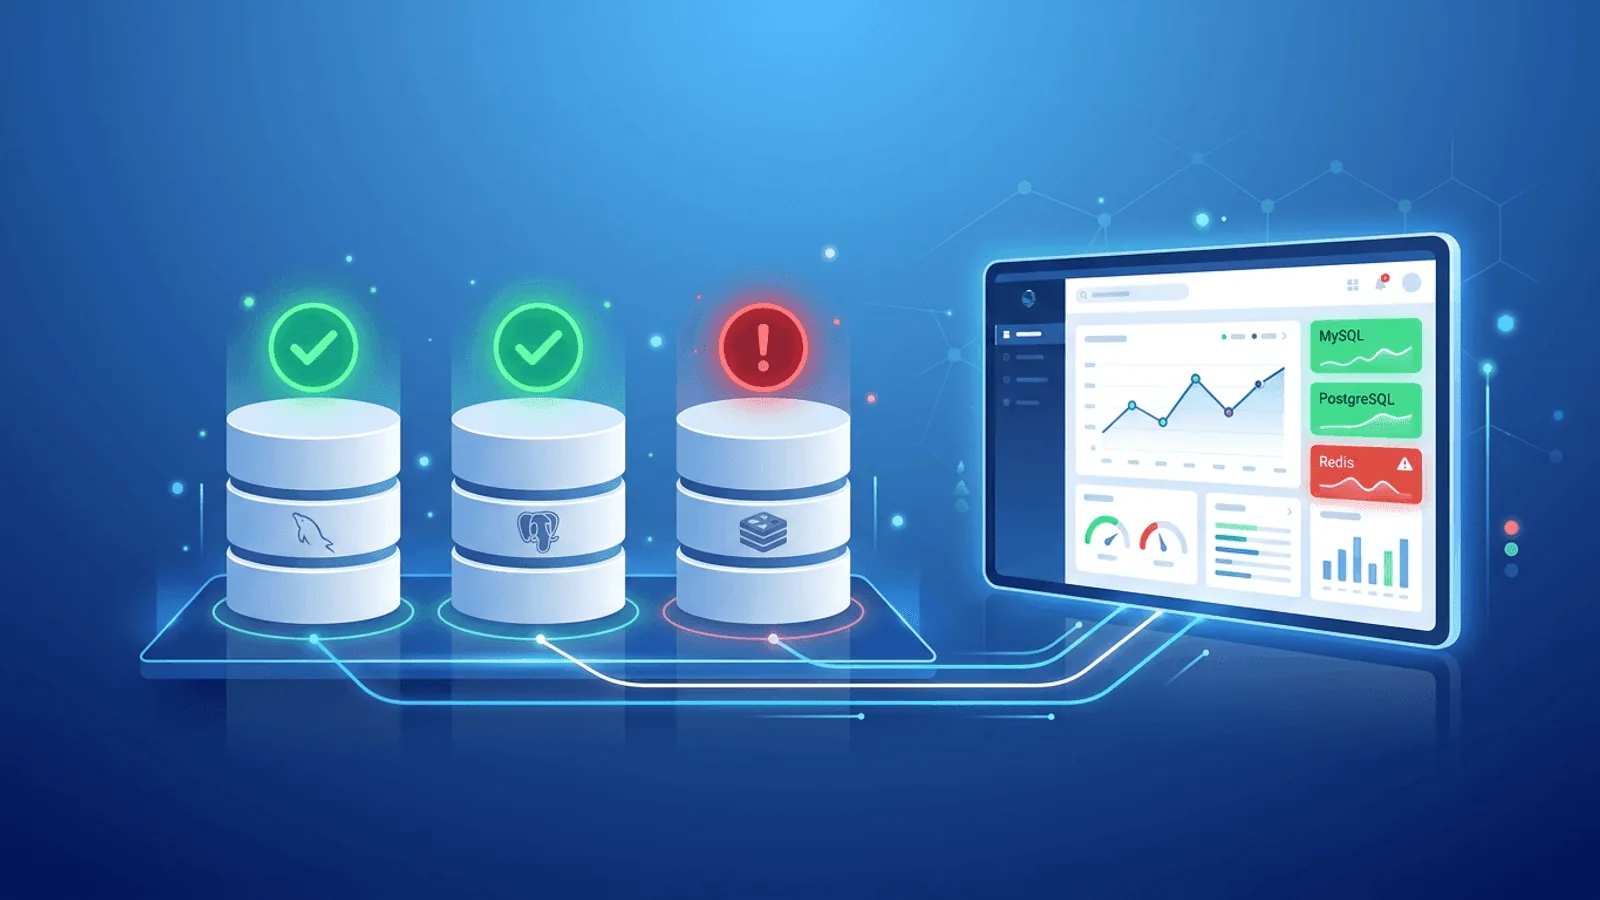
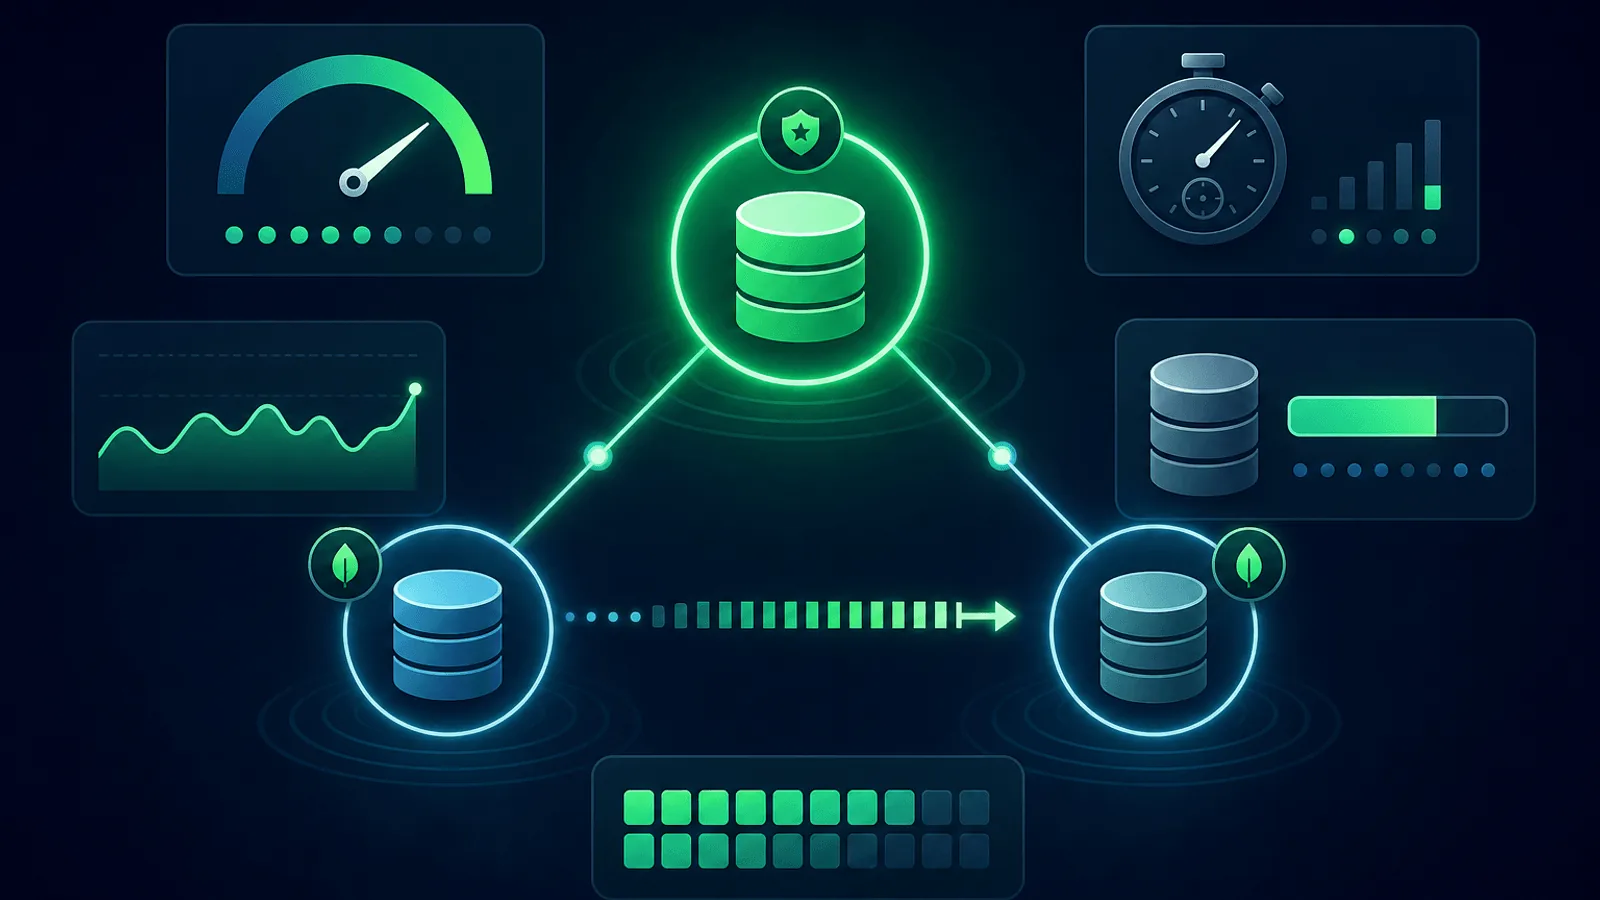
Database Monitoring: How to Monitor MySQL, PostgreSQL, and Redis Uptime
Database downtime brings your entire application down. Learn how to monitor MySQL, PostgreSQL, and Redis uptime, connectivity, and performance from outside.
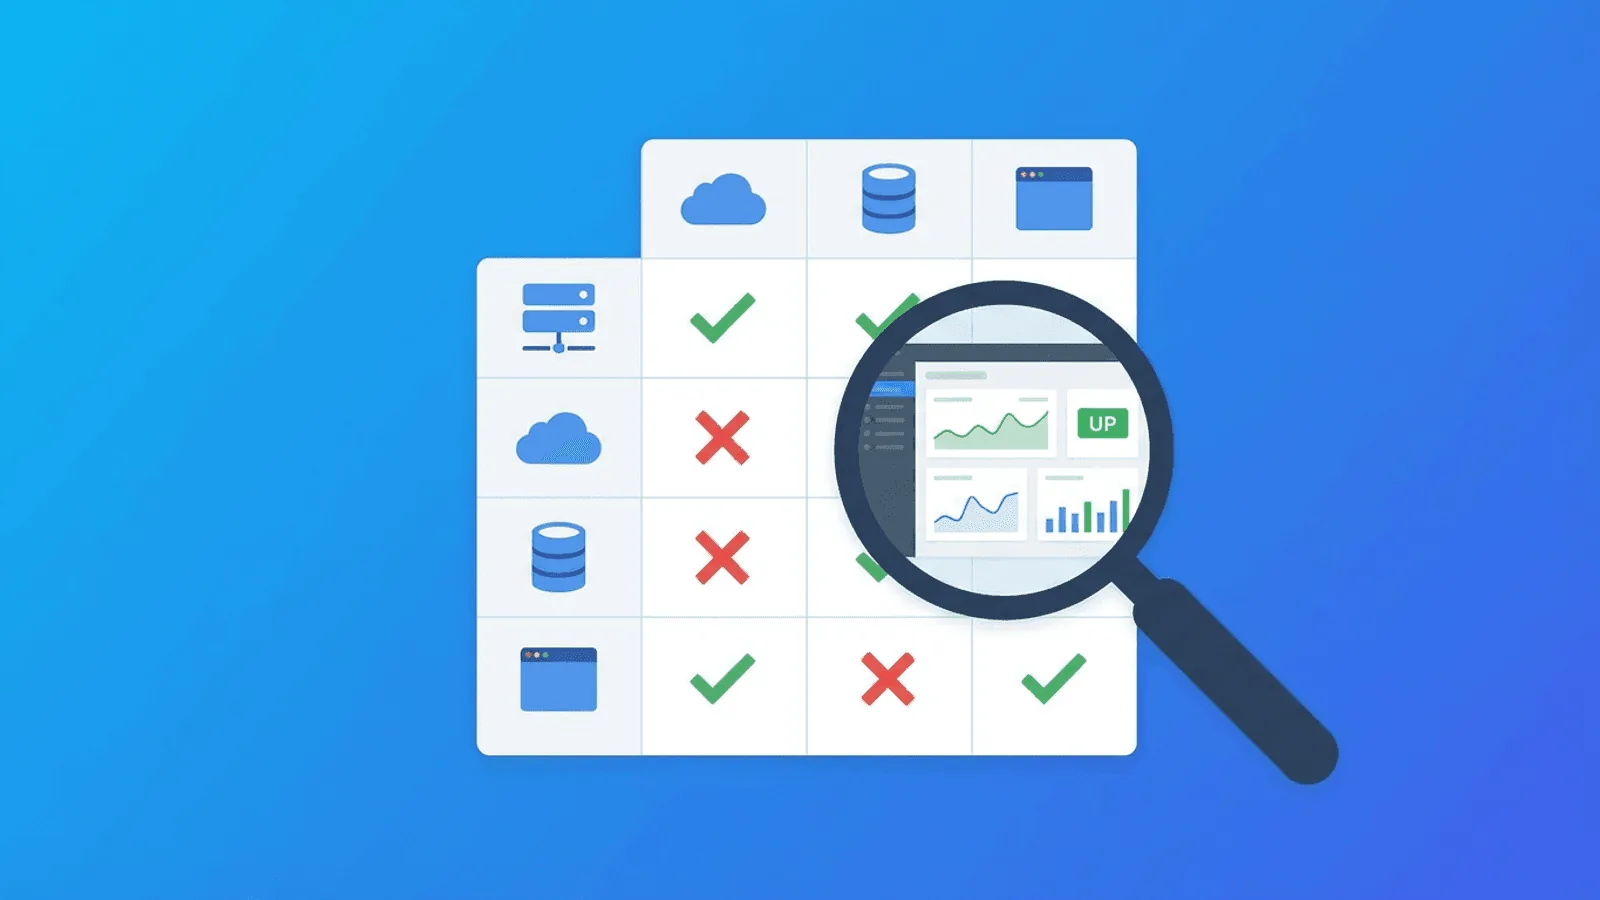
How to Choose a Website Monitoring Tool: The Complete Buyer's Guide
Not all monitoring tools are equal. This buyer's guide covers the features that matter, red flags to avoid, and how to find the right fit for your team.
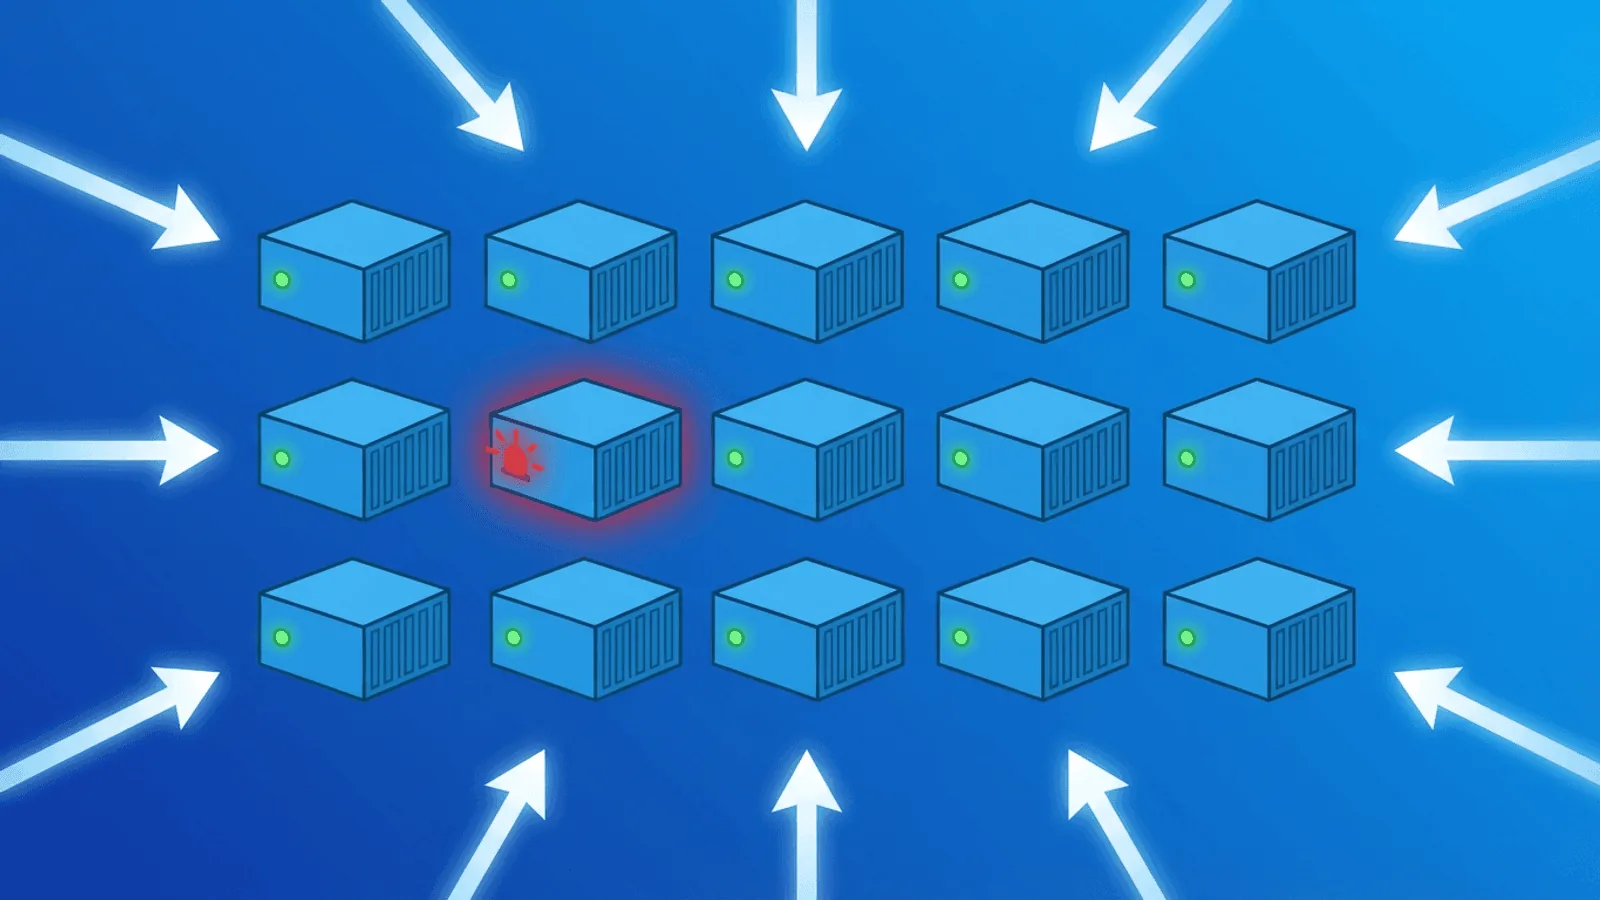
Docker Container Monitoring: Why HEALTHCHECK Isn't Enough
Docker HEALTHCHECK only sees inside the container. Learn to catch OOMKilled restarts, crash loops & port binding failures with external monitoring.
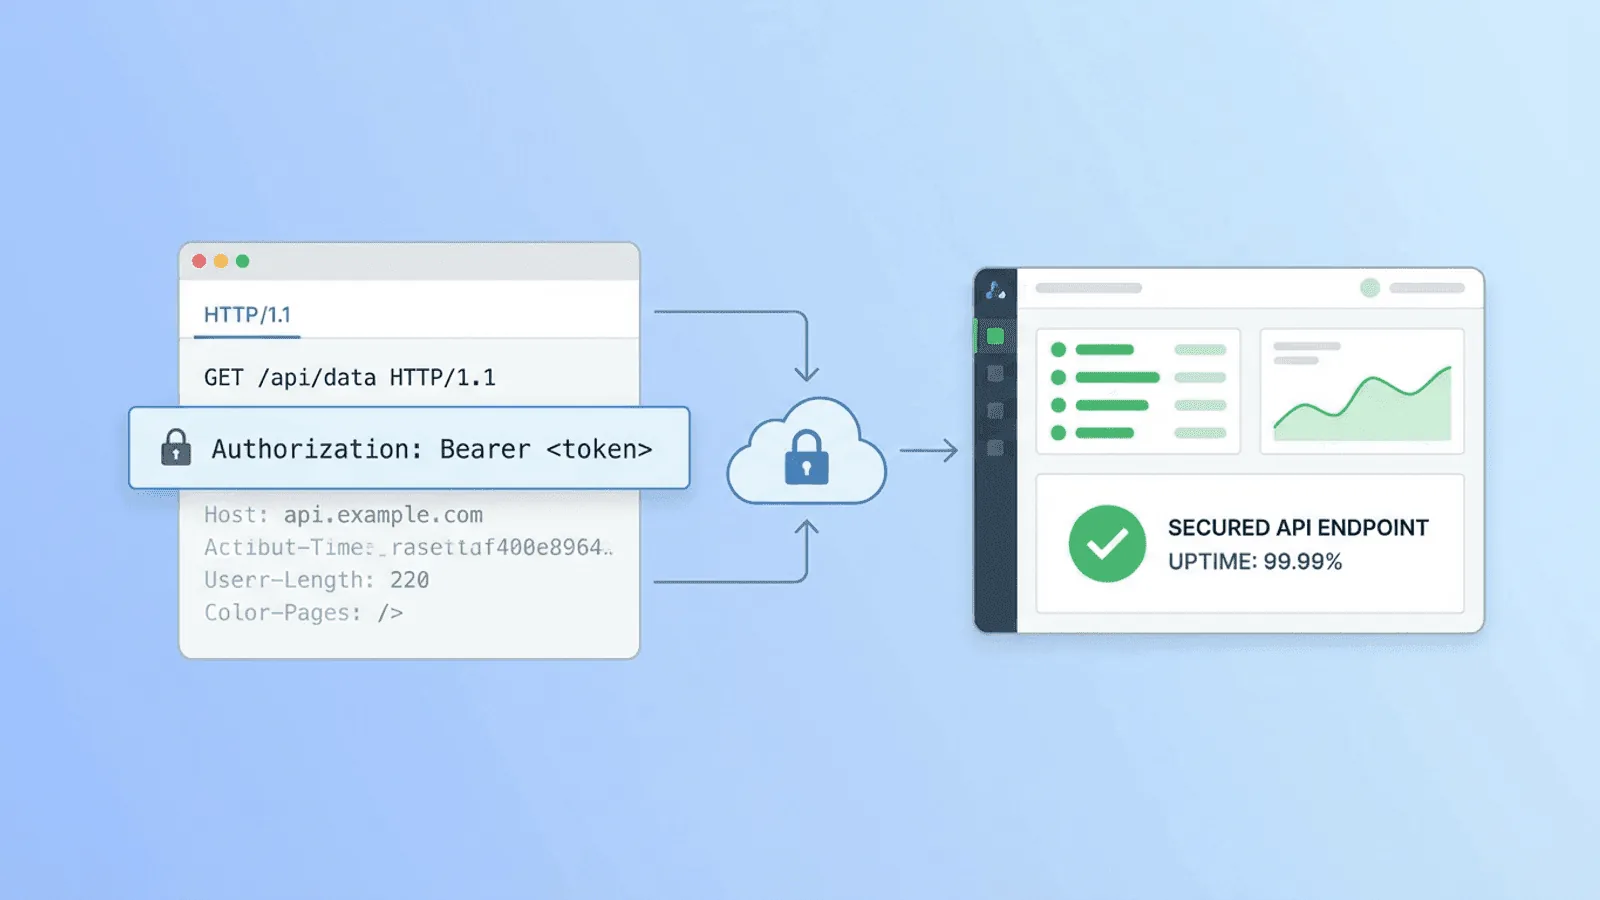
How to Monitor Authenticated APIs: Bearer Tokens, API Keys, and Custom Headers
Most monitoring tools only check public URLs. Here's how to set up uptime monitoring for APIs that require authentication — bearer tokens, API keys, and custom headers.
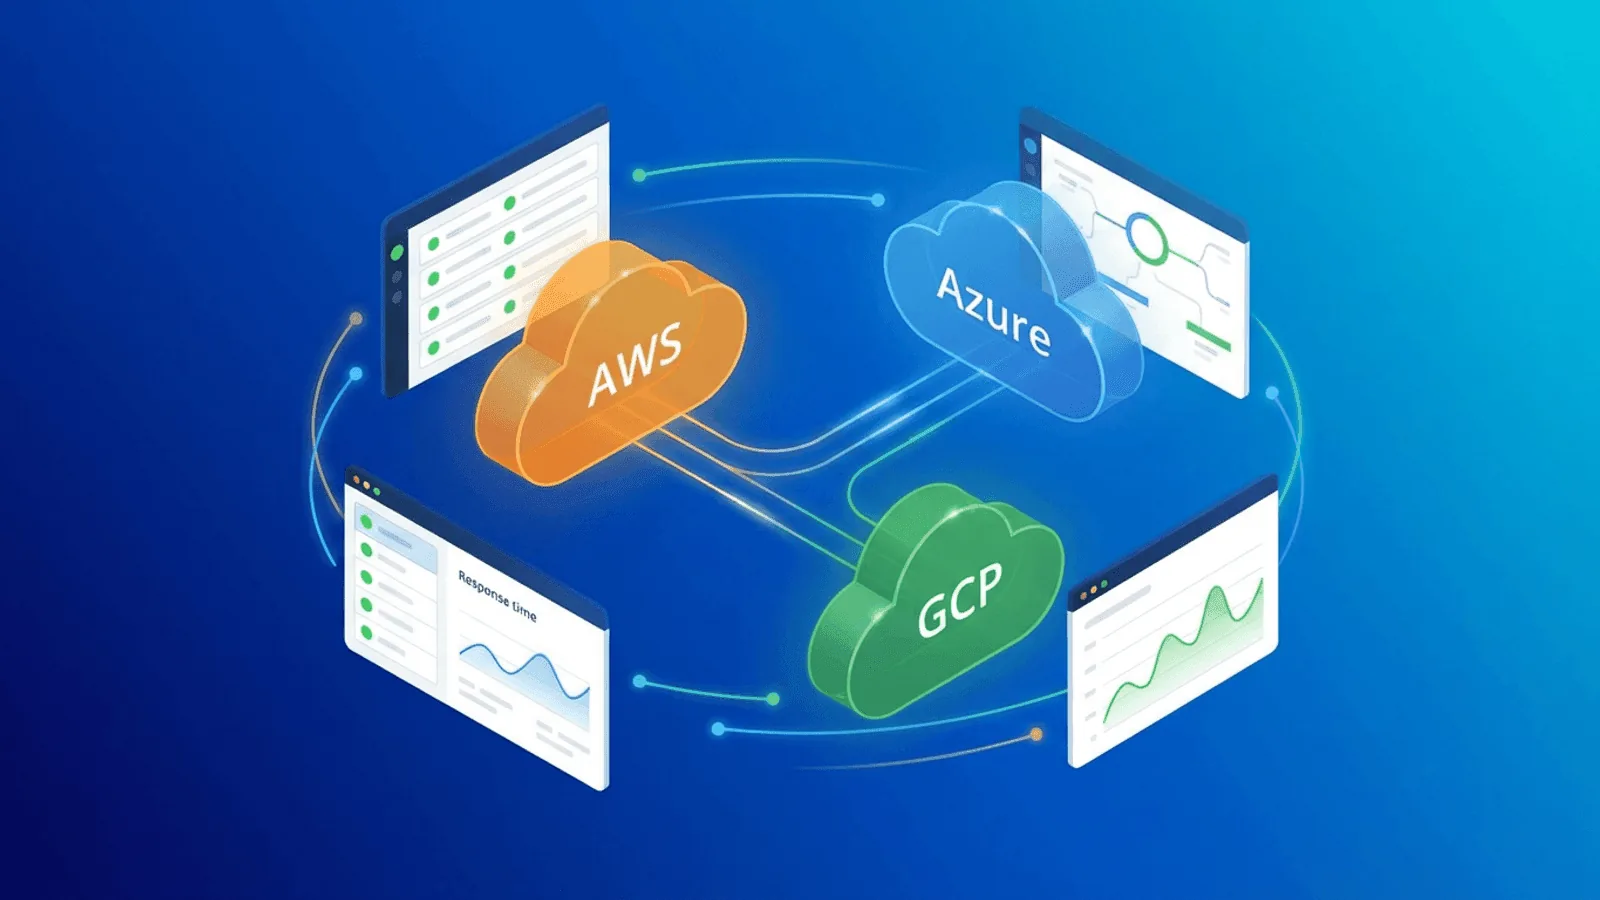
Cloud Infrastructure Monitoring: AWS, Azure, and GCP Uptime Best Practices
Your cloud provider's uptime isn't your uptime. Learn how to monitor AWS, Azure, and GCP infrastructure externally and catch outages before users do.

How to Prevent Website Outages: A Proactive Monitoring Guide
Most outages are preventable. Learn the top causes of downtime and how to catch every one of them before your users do.
Monitoring for Startups: Set Up Reliability Before Your First 1,000 Users
You don't need a platform team to monitor your product. Here's the practical startup playbook — what to monitor, when, and how to grow into it.
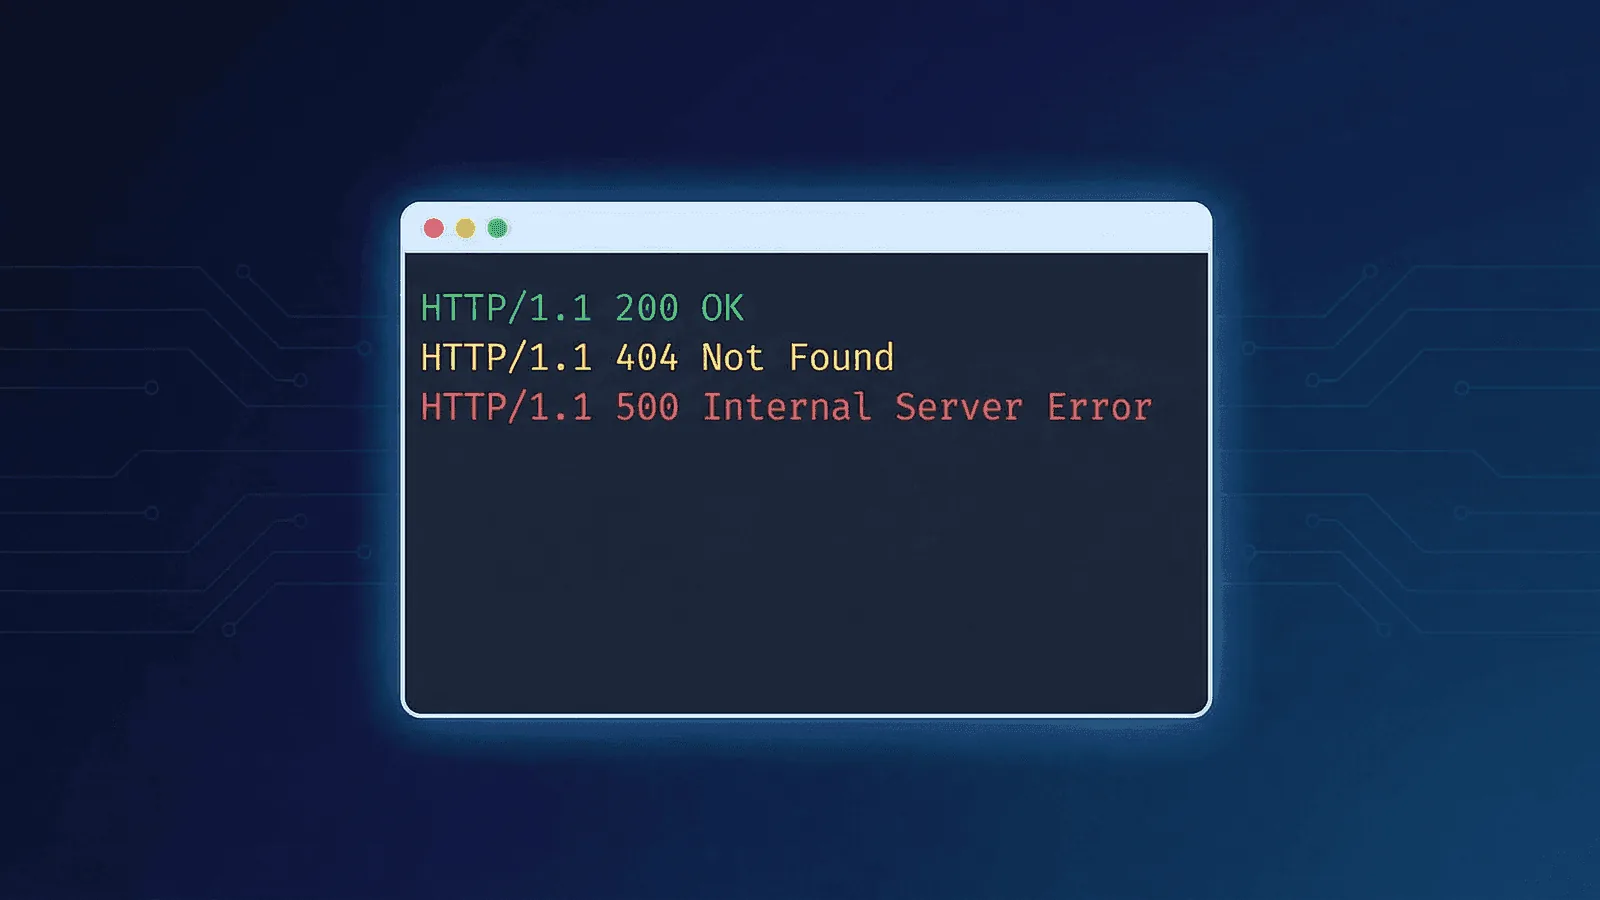
HTTP Status Codes Explained: A Complete Guide for Website Monitoring
Every HTTP status code explained — from 200 OK to 503 Service Unavailable. Learn which codes matter for uptime monitoring and when to alert.
Status Page Software: What to Look For in 2026
Choosing status page software? Compare features, pricing, and must-haves: uptime display, incidents, notifications, and custom domain.
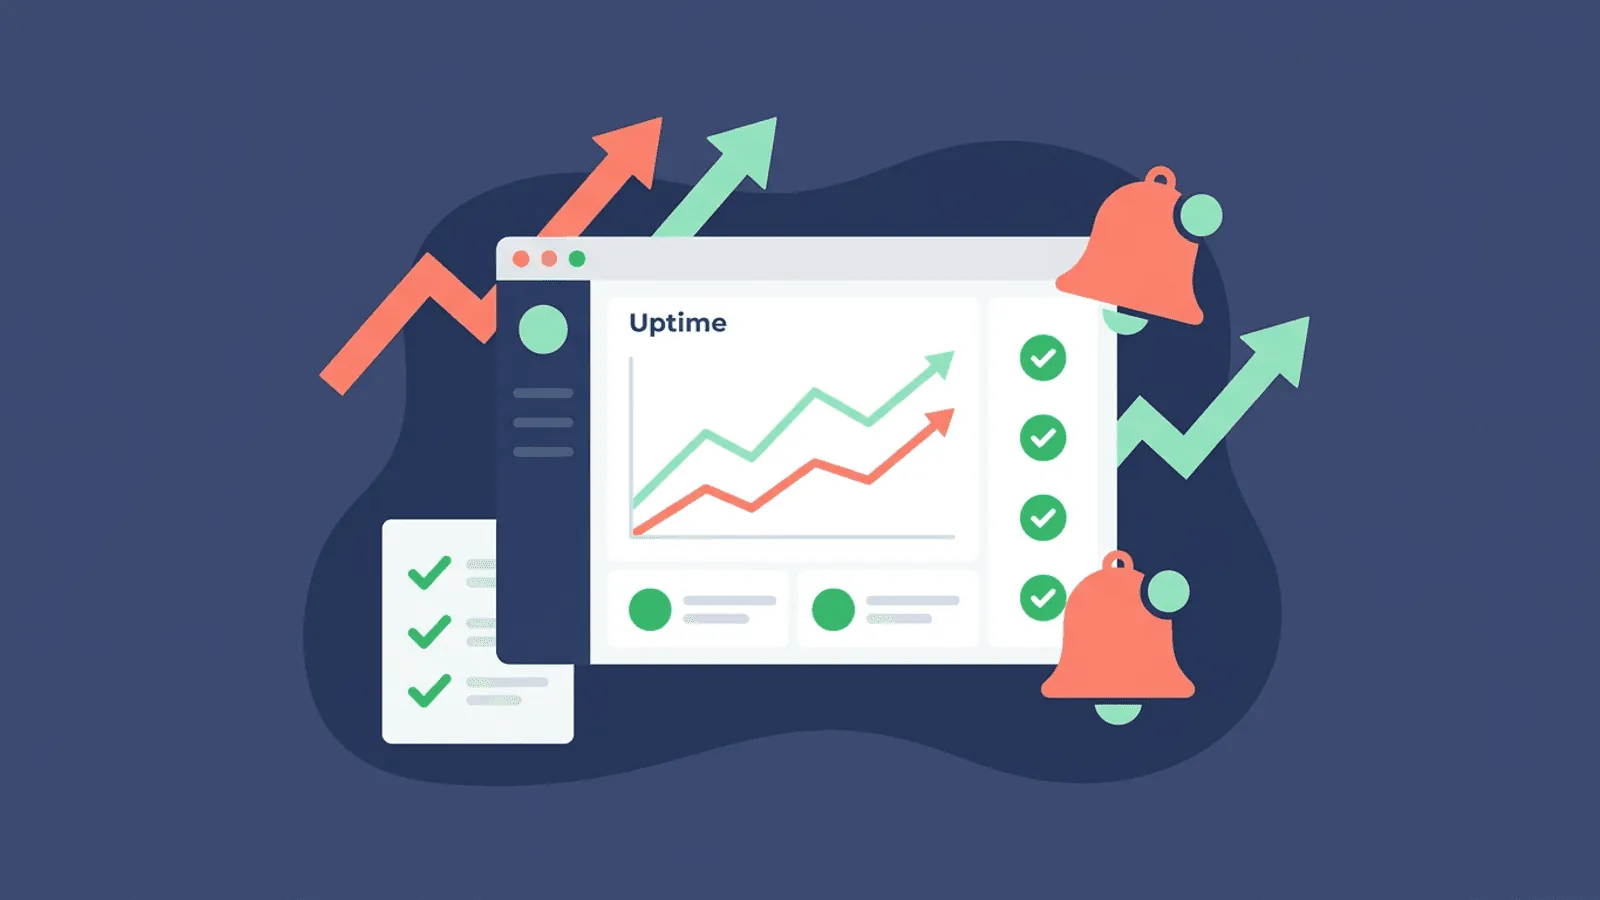
What Is Uptime Monitoring? A Complete Beginner's Guide
Uptime monitoring explained: what it is, how it works, and why your website needs it. Simple guide for beginners.

Website Monitoring for Agencies: Keep Client Sites Online
Monitor all your client websites from one place. Uptime monitoring for agencies: best practices, reporting, and staying proactive.
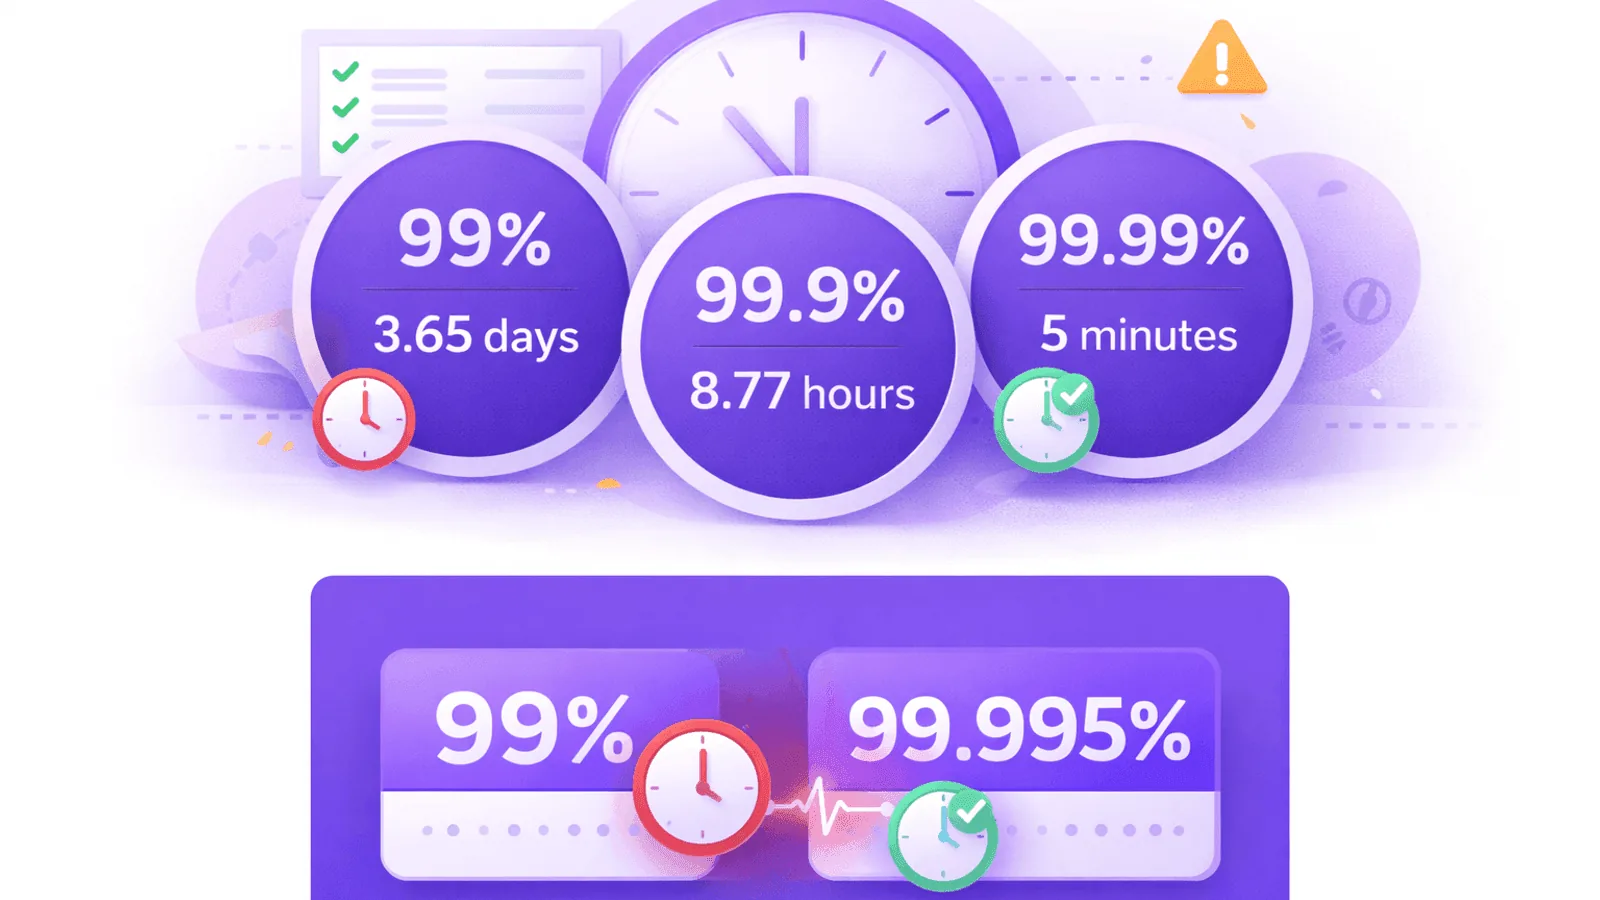
99.9% vs 99.99% Uptime: Downtime Per Month/Year Calculator
How much downtime do 99.9%, 99.99%, and 99.999% SLAs allow? See the exact minutes per month and hours per year for each availability tier, plus how to choose the right SLA target.
WordPress Uptime Monitoring: Keep Your Site Always Online
Monitor your WordPress site for downtime, slow performance, and plugin issues. A practical guide to uptime monitoring for WP.
Calculate Website Uptime: Why 99.9% Isn't Enough
Learn to calculate website uptime, understand SLA percentages, and discover why that impressive 99.9% uptime guarantee still means hours of downtime every year.
API Uptime Monitoring & Health Checks Guide
Your API is the backbone of modern applications. Learn how to monitor API endpoints, set up health checks, and catch failures before your users do.
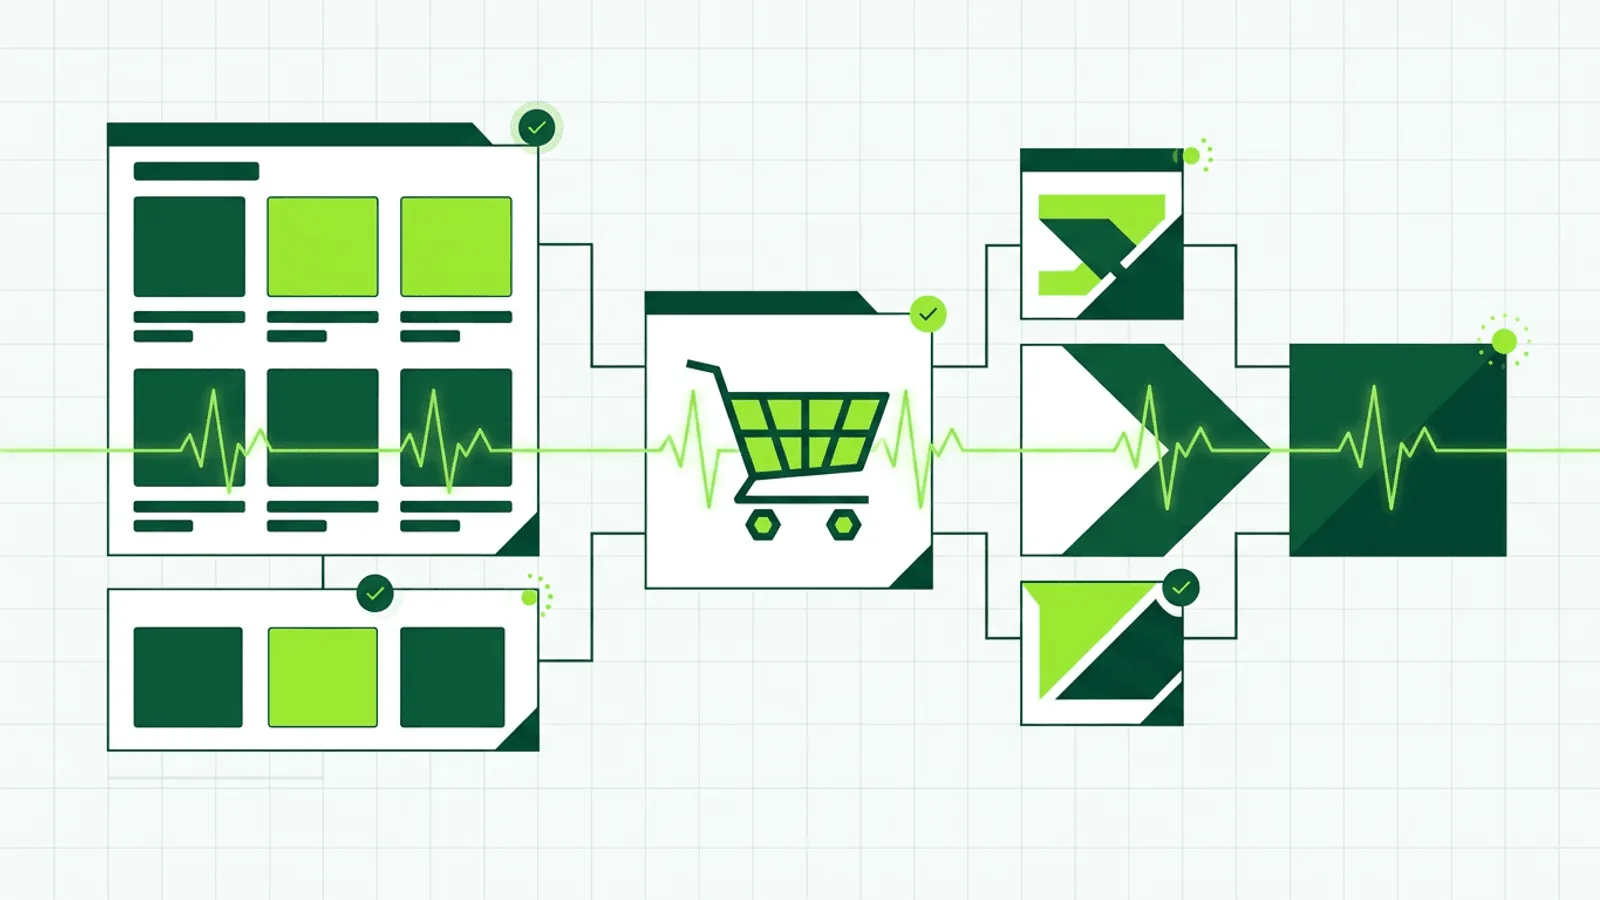
Website Monitoring for E-commerce: Every Second Counts
E-commerce sites lose $5,600 per minute of downtime. Learn which pages to monitor and how to protect revenue during peak sales.
1-Minute vs 5-Minute Monitoring Check Intervals
Should you check every minute or every 5 minutes? Learn how to choose the right monitoring interval for your website — and when faster checks actually matter.
Why Every SaaS Needs Uptime Monitoring (Day 1)
A practical guide for new SaaS founders on why uptime monitoring matters from launch day — and how to set it up in minutes.