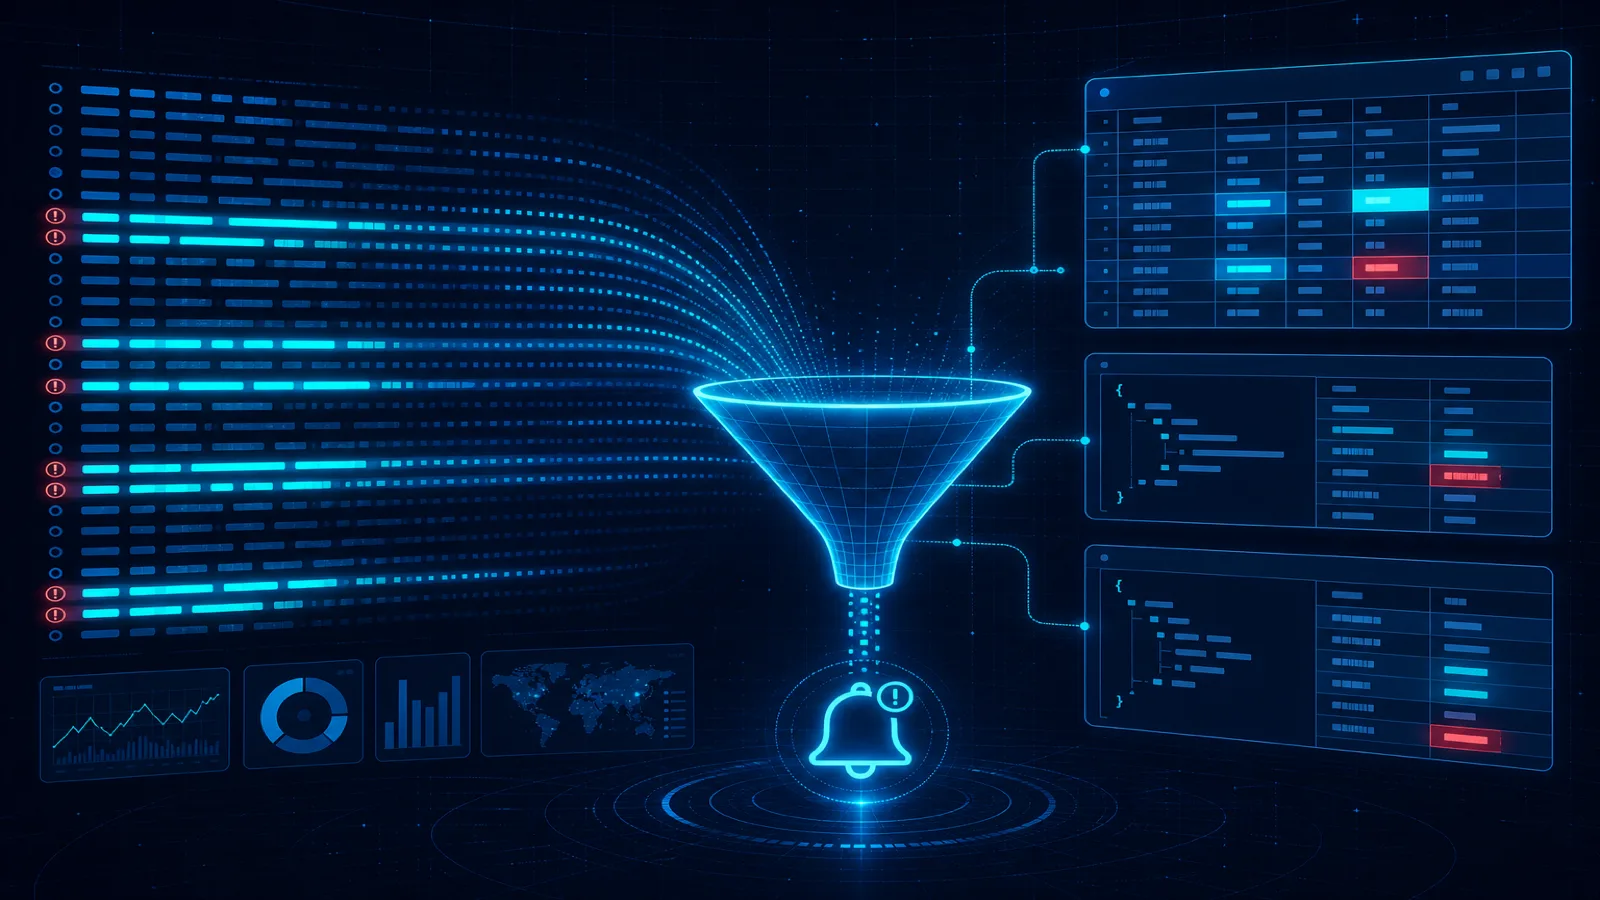
Short answer: Log monitoring detects patterns in timestamped application and infrastructure events, but it only sees what running components successfully emit and ship. Use structured fields and trace correlation for diagnosis, monitor the logging pipeline itself, and keep independent uptime checks for outside-in failures. The OpenTelemetry primer explains how logs complement traces and metrics; see observability vs monitoring.
Application logs are the most detailed record of what your system actually did. When something breaks at 3 a.m., the log is where you go to find out why — which endpoint, which query, which user, which line of code. Log monitoring is the practice of watching those logs continuously for errors, anomalies, and patterns, instead of only opening them during an incident. It's one of the four layers of modern monitoring (alongside uptime, error tracking, and real-user monitoring), and it answers the question no outside-in check can: what is happening inside the application?
But logs have a structural blind spot that catches teams off guard. Logs only get written when your code runs and reaches the point where it logs. If DNS is broken, if the CDN edge is failing, if a third-party API is down, or if the log shipper itself has stopped — your logs go silent, and silence looks identical to "everything is fine." This guide explains what log monitoring is, what it catches, what it can't, and how to pair it with outside-in monitoring so a silent log line never fools you into thinking the site is healthy.
What Is Log Monitoring?
Log monitoring is the continuous ingestion, indexing, and alerting over application and system logs. A log is a timestamped record of an event inside your software — an HTTP request, a database query, a background job, an exception, a login. Log monitoring takes that firehose of events and turns it into signals you can act on:
- Ingestion — collectors (Fluentd, Vector, Promtail, the Datadog/Logtail agents) ship logs from your hosts and containers to a backend.
- Indexing and search — the backend (Elasticsearch, ClickHouse, Datadog Logs, Better Stack, Parseable) parses structured fields and lets you query them.
- Alerting — rules fire when log patterns cross a threshold: error rate above 1%, a specific exception string appears, a security event triggers, a queue depth log line repeats too often.
The shift from "we have logs" to "we monitor logs" is the shift from reactive debugging (open the log after someone complains) to proactive detection (the log alerts you before anyone complains). For a deeper treatment of where logs fit in the broader observability stack — alongside traces and metrics — see our OpenTelemetry monitoring guide.
What logs catch well
Logs are the best source of truth for anything that happens inside your application boundary:
- Application errors and exceptions. A 500 with a stack trace, a null reference, a handled-but-logged warning. Logs give you the exact line and the request context.
- Slow queries. The database log that shows a 12-second
SELECTis the root cause behind a slow page — see our MySQL slow query monitoring guide and PostgreSQL monitoring guide. - Background job failures. A Sidekiq/BullMQ/Celery worker that retried five times and gave up writes it to the log — see job queue monitoring and dead-letter queues.
- Security and audit events. Failed logins, permission escalations, DDoS traffic spikes, suspicious user agents.
- Business events. Order placed, payment succeeded, signup completed — useful for funnel debugging and for correlating business drops with technical failures.
For all of these, logs are the authoritative record. No outside-in check will tell you which query was slow or which worker died — only the log will.
What logs miss (the structural blind spot)
Here's the failure mode that bites every team eventually: logs only get written when your code runs and reaches a logging statement. That means there's a wide class of outages that produce no log lines at all, and a monitoring setup that only watches logs will read "all quiet" while users stare at a blank page.
The cases logs are blind to:
- DNS and routing failures. If DNS is broken, the request never reaches your origin, so no application log is ever written. Your log dashboard shows zero errors — because there are zero requests. See DNS propagation monitoring.
- CDN and edge failures. A Cloudflare or Fastly edge returning 520s serves an error page to the user without touching your origin. No origin log. See Cloudflare monitoring and Cloudflare 5xx errors 520-526.
- Third-party API outages. If Stripe goes down, your integration may fail before logging — or you may degrade gracefully and never log an error at all, while the user experience is still broken. See third-party API monitoring.
- The log shipper itself going down. This is the worst one. If your log collector stops shipping, your dashboard shows a flat line of zero new logs — which looks identical to "no errors." Teams have run for hours thinking they were healthy because their log pipeline was the thing that broke. A silent log stream is not a healthy log stream.
- SSL certificate expiry and content/SEO changes. Logs don't tell you your cert expired or your
robots.txtaccidentally blocked Googlebot. See SEO health monitoring. - "Slow but working" user experience. Logs tell you a request took 12 seconds; they don't tell you what the user felt or whether the page actually rendered. That's the job of real-user monitoring and synthetic monitoring.
The unifying problem: logs are an inside-out signal. They tell you what your application did. They cannot, by construction, tell you what users experienced when the failure happened outside your application boundary.
Structured logging makes monitoring possible
The single highest-leverage thing you can do for log monitoring is to emit structured logs — JSON key-value pairs instead of free-text lines. Free-text logs require fragile regex parsing; structured logs let you alert on level=error, filter by route=/checkout, group by user_id, and compute error rates per endpoint in seconds.
Every modern log backend (Datadog, Better Stack, Parseable, Loki, Elasticsearch) is built around structured fields. If your logs are still 2026-07-09 03:14:22 ERROR something broke, the first project is not "set up better alerting" — it's "start emitting JSON." Once logs are structured, log-based alerting becomes straightforward: alert when count(level=error) / count(*) > 0.01 over a 5-minute window, or when a specific error.code appears.
Log alerting without the noise
Log monitoring's biggest practical failure is alert fatigue. Logs are verbose, and naive rules ("alert on any ERROR") will page you for every handled exception, every retried-and-recovered request, and every benign warning. The discipline is the same as for any alerting:
- Alert on rates and ratios, not individual lines. A single ERROR is a log entry; a sustained 5% error rate is an incident. See anomaly detection for moving beyond static thresholds.
- Use sustained windows. A 60-second error spike that recovers is not a page; a 5-minute one is.
- Suppress during known incidents. When you've declared an incident, suppress the cascade of duplicate log alerts and post a single update to your status page. See alert flapping detection.
- Correlate with user impact. A log error that doesn't produce a user-facing failure (because a retry or fallback handled it) is a note, not a page. Pair log alerts with outside-in checks to confirm impact.
Practical monitoring baseline
- Standardize timestamp, severity, service, environment, release, trace ID, event name, and safe error fields.
- Alert on rates or absence for high-value events, not broad keyword matches across every log line.
- Measure ingestion delay, dropped records, parse failures, quota use, and source silence end to end.
How Webalert Helps
Webalert doesn't ingest your application logs — and it shouldn't, because logs and outside-in monitoring answer different questions. Logs tell you why; Webalert tells you whether users are affected. The two are complements:
- Outside-in uptime and API monitoring catches every failure logs are blind to: DNS outages, CDN edge failures, SSL expiry, third-party API outages, and the case where your log shipper itself went down and your log dashboard went flat. When Webalert says the site is down but your logs are silent, the failure is outside your application boundary — and that's exactly the failure logs can't see.
- Heartbeat monitoring for your log pipeline. If your log collector emits a periodic heartbeat (or you configure your shipper to ping a heartbeat endpoint), Webalert's heartbeat monitoring alerts you the moment the shipper stops — so a silent log stream never gets mistaken for a healthy one. See also cron job monitoring for scheduled-task heartbeats.
- Monitor your log backend as a dependency. Your log ingest endpoint (Datadog, Logtail, Better Stack) is itself an external API. Monitor it like any other dependency — see third-party API monitoring and monitoring authenticated APIs.
- Response-time and TTFB monitoring catches the "slow but working" case that logs alone underweight — the request that returned 200 but took 12 seconds.
- Content change detection catches the SEO, content, and configuration changes that logs never record.
The mental model: logs are your inside-out microscope, Webalert is your outside-in alarm. Run both, and a failure in either one won't leave you blind.
Summary
Log monitoring is the continuous alerting over application and system logs, and it's the best source of truth for anything that happens inside your application boundary — errors, slow queries, background job failures, security events, and business events. The structural blind spot is that logs only get written when your code runs and reaches a logging statement, so a wide class of outages (DNS, CDN edge, third-party APIs, SSL expiry, content/SEO changes) and the failure of the log shipper itself produce no log lines at all — and silence looks identical to healthy. The two highest-leverage improvements are emitting structured JSON logs (so alerting is possible at all) and pairing log monitoring with outside-in uptime monitoring so a silent log stream never fools you. Alert on rates and ratios over sustained windows, suppress noise during known incidents, and treat logs and outside-in checks as complements: logs tell you why, outside-in tells you whether.
Log monitoring checklist
- Logs emitted as structured JSON (not free-text) with consistent fields (
level,route,status,request_id) - Log shipper (Fluentd/Vector/Promtail/agent) under its own monitoring
- Heartbeat on the log pipeline so a silent shipper is caught, not mistaken for healthy
- Log backend ingest endpoint monitored as an external dependency
- Alert on error rate (e.g., >1% over 5 min), not on individual ERROR lines
- Sustained alert windows (5 min) to avoid flapping on transient spikes
- Duplicate log alerts suppressed during declared incidents
- Log alerts correlated with outside-in checks to confirm user impact
- Outside-in uptime monitoring covers DNS, CDN edge, SSL, and third-party APIs (the cases logs can't see)
- Slow-query logs feeding into database monitoring
- Background job logs feeding into job queue monitoring
Frequently Asked Questions
What is log monitoring?
Log monitoring is the continuous ingestion, indexing, and alerting over application and system logs. Instead of only opening logs reactively during an incident, log monitoring watches the log stream continuously and alerts when error rates, specific patterns, or anomalies cross a threshold. It's one of the four layers of modern monitoring, alongside uptime monitoring, error tracking, and real-user monitoring.
What can't log monitoring detect?
Log monitoring can't detect outages that produce no log lines — and there are more of these than people expect. DNS failures, CDN edge errors, third-party API outages, SSL certificate expiry, content/SEO changes, and the failure of the log shipper itself all produce zero application logs. A log-only monitoring setup will read these as "all quiet" while users experience an outage. Pair log monitoring with outside-in uptime monitoring to cover these cases.
How do I monitor that my log shipper is still working?
Set up a heartbeat. Have your log collector emit a periodic signal (or ping a heartbeat endpoint) every minute. If the heartbeat stops, an outside-in monitor alerts you immediately — so a silent log stream is caught as a shipper failure instead of being mistaken for a healthy system with no errors. Webalert's heartbeat monitoring is built for exactly this.
Do I need log monitoring if I already have uptime monitoring?
Yes — they answer different questions. Uptime monitoring tells you whether users can reach your site and whether it's fast; it can't tell you which database query caused the 12-second response or which worker died. Log monitoring tells you why things break inside the application. You need both: logs are the inside-out microscope, uptime monitoring is the outside-in alarm.