Your web server is responding. Your database is healthy. Your status page is green.
But the welcome emails stopped going out three hours ago. Subscription renewals are stuck in "pending." The nightly data export hasn't run since Tuesday. User avatar uploads process successfully on the frontend but the thumbnails never get generated.
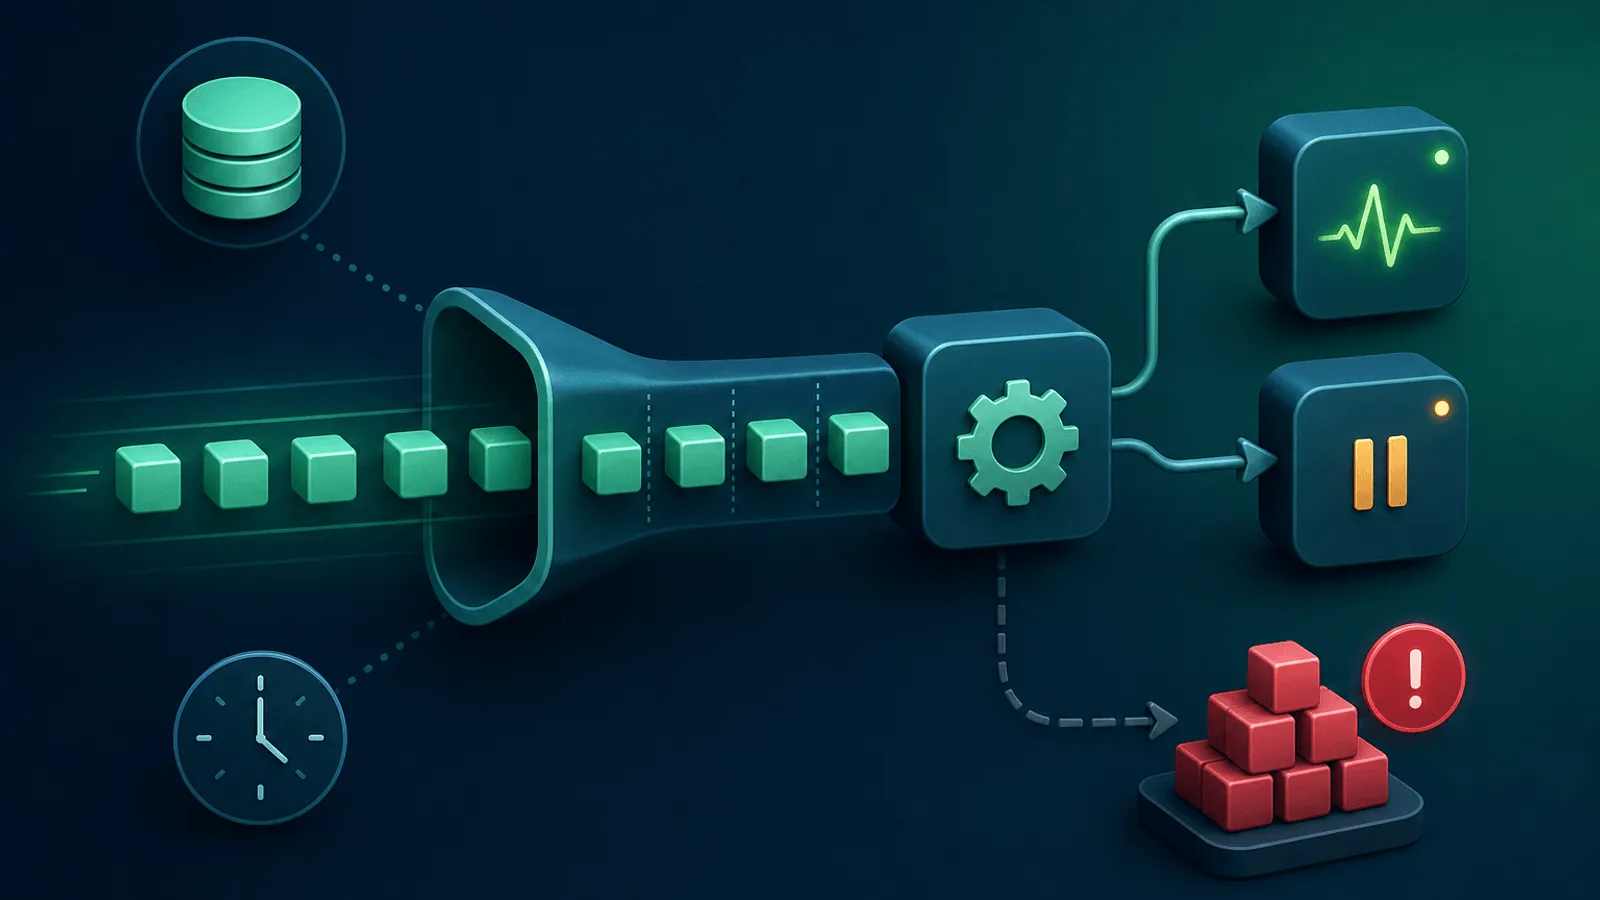
All of these failures share the same root cause: background jobs that stopped running — silently, without a 500 response or an alert. The web layer looks fine because the web layer is fine. The queue is the problem.
Background job queues are the dark matter of web infrastructure. They power a huge share of what your product actually does, yet most monitoring setups ignore them entirely. This guide covers how to monitor job queues across the major implementations — Sidekiq, BullMQ, RabbitMQ, and Amazon SQS — so the next consumer crash or dead letter pile-up doesn't become a support ticket on Monday morning.
Why Queue Monitoring Is Different
A web request fails visibly: the user sees an error, your uptime monitor fires, your error tracker lights up. A failed background job is invisible:
- No user interaction — The job runs without anyone waiting for the response
- Deferred failure — The user submitted the form successfully; they just never get the email
- No HTTP response — There's no status code to check, no latency to measure
- Consumer crashes hide — A crashed worker means jobs pile up in the queue rather than failing loudly
- Retry storms — A job that keeps failing retries N times over hours before hitting the dead letter queue
- Timing dependencies — Scheduled jobs that miss their window fail completely without any signal
Queue monitoring requires a completely different set of signals than web monitoring.
What to Monitor (Every Queue System)
These metrics apply regardless of which queue implementation you use.
1) Queue Depth (Backlog)
The number of jobs waiting to be processed. A healthy queue stays near zero; a growing queue means consumers are falling behind or dead.
- Alert on sustained growth — A queue that grows for 10 minutes is a problem even if no consumer has crashed
- Alert on sudden spikes — A sharp jump usually means a publisher bug creating runaway jobs
- Per-queue baselines — A queue that normally sits at 50 jobs and spikes to 5,000 is a crisis; one that normally sits at 5,000 isn't
2) Dead Letter Queue (DLQ) Depth
The dead letter queue holds jobs that exhausted all retries. Every job in the DLQ is a failed user action that needs investigation:
- Alert on any growth — A DLQ that's accumulating jobs is the single most actionable queue signal
- Alert on spikes — A sudden flood of DLQ entries usually means a bad deploy or a dependency failure
- Alert per job class — Different job types failing at once vs. a single type identifies whether it's infrastructure or code
3) Consumer Count and Health
If consumers go to zero, the queue fills indefinitely. Monitor:
- Active consumer count — Alert when it drops below the minimum needed for your throughput
- Consumer idle time — Consumers stuck "processing" the same job for too long are hung, not healthy
- Consumer crash rate — Frequent restarts are a leading indicator of a bad job class crashing workers
4) Job Latency (Age of Oldest Job)
How long jobs wait before being picked up. A healthy queue processes jobs within seconds to minutes.
- Alert on increasing latency — Even without queue depth growing, increasing wait time signals degraded throughput
- Alert per priority class — A high-priority queue backing up while a low-priority one is fine means consumer misconfiguration
5) Job Processing Time (Duration)
How long individual jobs take to run.
- Alert on p95/p99 regressions — A job that normally takes 1 second suddenly taking 30 suggests a slow dependency
- Alert on hung jobs — Jobs executing for longer than their expected maximum are likely deadlocked or waiting on a failed dependency
- Track per job class — Aggregate duration hides which specific job type is slow
6) Error Rate and Retry Rate
- Error rate per job class — A spike in errors for one class is a code bug; errors across all classes is infrastructure
- Retry exhaustion rate — The proportion of jobs hitting max retries; rising rates predict DLQ accumulation
- Poison pill detection — A single malformed job that causes every consumer to crash is a poison pill
7) Heartbeat Monitoring
The most reliable queue health check is a scheduled job that pings a heartbeat URL:
- Have your scheduler enqueue a "heartbeat" job every N minutes
- That job executes and calls a heartbeat endpoint (your monitoring tool records the call)
- If the heartbeat endpoint stops receiving pings, the queue or consumers have failed
This catches the failure mode that everything else misses: a queue that isn't actually processing anything, because there are no jobs currently in flight to measure. See Cron Job Monitoring: Background Tasks for the implementation pattern.
Monitoring by Queue System
Sidekiq (Ruby)
Sidekiq stores queues in Redis and exposes extensive metrics through its Web UI and the Sidekiq::Stats API.
Key metrics to track:
Sidekiq::Stats.new.enqueued— total jobs waitingSidekiq::Stats.new.dead— jobs in the dead setSidekiq::Stats.new.retry_size— jobs awaiting retrySidekiq::Queue.all.each { |q| q.size }— per-queue depthsSidekiq::Workers.new.size— number of currently-processing jobsSidekiq.redis { |r| r.info }— Redis memory and connection health
Common pitfalls:
- Redis memory exhaustion is the most common Sidekiq outage; monitor Redis memory separately
sidekiq-cronorsidekiq-schedulerjobs failing silently — add heartbeat jobs for each critical schedule- Queue priority misconfiguration: low-priority queues starving critical ones
Monitoring integration:
Expose a custom /sidekiq_health endpoint that returns 200 with queue depths and consumer counts in JSON. Monitor that endpoint with content validation.
BullMQ (Node.js)
BullMQ uses Redis and provides rich job lifecycle events. The Bull Board or Arena web UIs visualize the queues.
Key metrics:
queue.getWaitingCount()— pending jobsqueue.getFailedCount()— failed jobs (DLQ equivalent)queue.getDelayedCount()— scheduled-for-future jobsqueue.getActiveCount()— currently processingqueue.getCompletedCount()(optional, auto-cleaned)- Worker event:
worker.on('error', ...)— expose worker errors to your APM
Common pitfalls:
autorun: falseon workers after deployment restarts causes silent consumer death- Concurrency configured too high floods downstream dependencies
- Long-running jobs blocking the event loop if CPU-bound work runs in-process
Monitoring integration:
Add a /queue-health endpoint in your Express app that calls getWaitingCount() + getFailedCount() for critical queues and returns JSON. Monitor with content validation checking failed stays at zero.
RabbitMQ
RabbitMQ is a full AMQP broker with its own management API (http://host:15672/api).
Key metrics:
messages_readyper queue — waiting to be consumedmessages_unacknowledgedper queue — delivered but not yet ackedconsumersper queue — active consumer countmemory— broker memory usage; alarms trigger when threshold is crosseddisk_free— disk alarms can pause publishingpublish_rateanddeliver_rate— production/consumption throughput
Common pitfalls:
- Memory alarm triggers flow control, which pauses all publishers — a RabbitMQ memory issue looks like every service is broken
- Prefetch (
basic.qos) misconfiguration causes individual consumers to hoard messages - Unacknowledged message buildup indicates consumers are taking messages but not completing them
Monitoring integration:
Poll the management API (/api/queues/vhost/queue-name) for messages_ready and messages_unacknowledged. Alert when either exceeds threshold. Also monitor the management API's own health endpoint (/api/health/checks/aliveness-test/vhost).
Amazon SQS
SQS is a managed queue service with CloudWatch metrics built in.
Key metrics:
ApproximateNumberOfMessagesVisible— jobs waiting in the queueApproximateNumberOfMessagesNotVisible— messages being processed (in-flight)ApproximateAgeOfOldestMessage— age of the oldest job; rises when consumers are slow or deadNumberOfMessagesSent/NumberOfMessagesDeleted— throughput tracking- Dead letter queue:
ApproximateNumberOfMessagesVisibleon the DLQ
Common pitfalls:
- Visibility timeout shorter than job execution time causes the same message to be processed multiple times
- Lambda concurrency limits causing processing to stop while messages pile up
- SQS FIFO queues becoming stuck due to a single bad message blocking the message group
Monitoring integration:
Set CloudWatch alarms on ApproximateAgeOfOldestMessage (your most sensitive signal) and ApproximateNumberOfMessagesVisible on the DLQ. Forward these to your alerting channels.
Common Queue Failure Modes
| Failure | User Impact | How to Detect |
|---|---|---|
| All consumers crashed | No jobs processed; queue grows | Consumer count alert + heartbeat |
| Redis down (Sidekiq/BullMQ) | Queue inaccessible; jobs cannot be enqueued or dequeued | Redis uptime check + queue health endpoint |
| DLQ accumulating | Failed user actions silently piling up | DLQ depth alert |
| Consumer stuck on poison pill | One bad message blocks the worker | Job duration alert + consumer idle time |
| Retry storm from bad deploy | Rapid DLQ accumulation, CPU spike | Error rate + retry rate per job class |
| Scheduled job missing | Nightly exports, report generation not running | Heartbeat monitoring |
| Visibility timeout exceeded (SQS) | Duplicate job processing | ApproximateNumberOfMessagesNotVisible + duplicate detection |
| RabbitMQ memory alarm | All publishing paused | Broker memory + alarm status |
| Consumer misconfiguration after deploy | Jobs queued but not processed | Consumer count + queue depth combo alert |
| Long-running job blocking worker | Throughput degraded, other jobs wait | Job duration p99 alert |
Setting Up Queue Monitoring
Quick start (15 minutes)
- Heartbeat job — Enqueue a no-op job every 5 minutes that pings a heartbeat monitor URL
- Health endpoint — Expose queue depths and consumer count as JSON at a
/queue-healthURL - Content validation check on
/queue-health— Alert ifdeadorfailedis non-zero, orconsumersdrops below 1 - DLQ alert — Monitor your DLQ depth; alert the moment it starts growing
Comprehensive setup (1 hour)
Add to the quick start:
- Per-queue depth alerts with dynamic baselines (alert on growth, not just absolute size)
- Consumer count alerts per queue with minimum thresholds
- Job duration p95/p99 from your APM, with regression alerts
- Retry rate tracking — alert when retry rate for any job class exceeds X% per hour
- Redis/broker health — Separate uptime and memory checks on the underlying store
- Per-scheduled-job heartbeats — Critical cron-triggered jobs each get their own heartbeat
What to Do When Queue Monitoring Fires
Queue depth growing / consumers at zero:
- Check whether the consumer process is running (Sidekiq, BullMQ worker, Lambda, ECS task)
- Look at recent deploys — misconfigured startup, wrong environment variable
- Check the underlying broker (Redis, RabbitMQ) for memory or connection issues
- Restart consumers and watch queue drain
DLQ accumulating:
- Pull a sample of DLQ jobs and inspect their payloads and error messages
- Identify whether it's one job class or many — single class = code bug; all classes = infrastructure
- Fix the root cause before re-queuing DLQ jobs (re-queuing before fixing causes the same accumulation)
- Use a DLQ replay strategy: small batches, monitor for recurrence
Heartbeat missed:
- Confirm whether the scheduler is still enqueuing the heartbeat job
- Check whether the heartbeat job is being picked up (queue depth for the heartbeat queue)
- Check broker connectivity from the scheduler
- Check consumer logs for the heartbeat job class
Poison pill blocking a consumer:
- Identify the stuck job ID from consumer metrics
- Move it to the DLQ or delete it
- Restart the affected consumer
- Add validation for the payload shape that caused the poison pill
How Webalert Helps
Webalert provides the external monitoring layer for your background job infrastructure:
- Heartbeat monitoring — Pair with a job that pings a heartbeat URL; alert the moment jobs stop processing
- HTTP checks with content validation — Monitor
/queue-healthendpoints for consumer count and DLQ depth - Cron monitoring — Confirm scheduled jobs fire on time with configurable expected intervals
- Multi-channel alerts — Email, SMS, Slack, Discord, Microsoft Teams, webhooks
- Status pages — Communicate background processing incidents to users
- 5-minute setup — Start with a heartbeat and health endpoint check today
See features and pricing for details.
Summary
- Background jobs fail silently. The web layer looks healthy while the queue is broken.
- Monitor queue depth, dead letter queue depth, consumer count, job latency, and job duration.
- The most reliable check is a heartbeat job: enqueue → execute → ping a URL. If the ping stops, the queue or consumers have failed.
- Different queue systems expose different signals: Sidekiq via Redis/API, BullMQ via queue methods, RabbitMQ via management API, SQS via CloudWatch.
- DLQ accumulation is the single most actionable signal — it means real user actions have permanently failed.
- Alert on DLQ growth, consumer count drops, and missed heartbeats as your three primary queue health metrics.
The web layer shows you symptoms. Queue monitoring shows you causes.