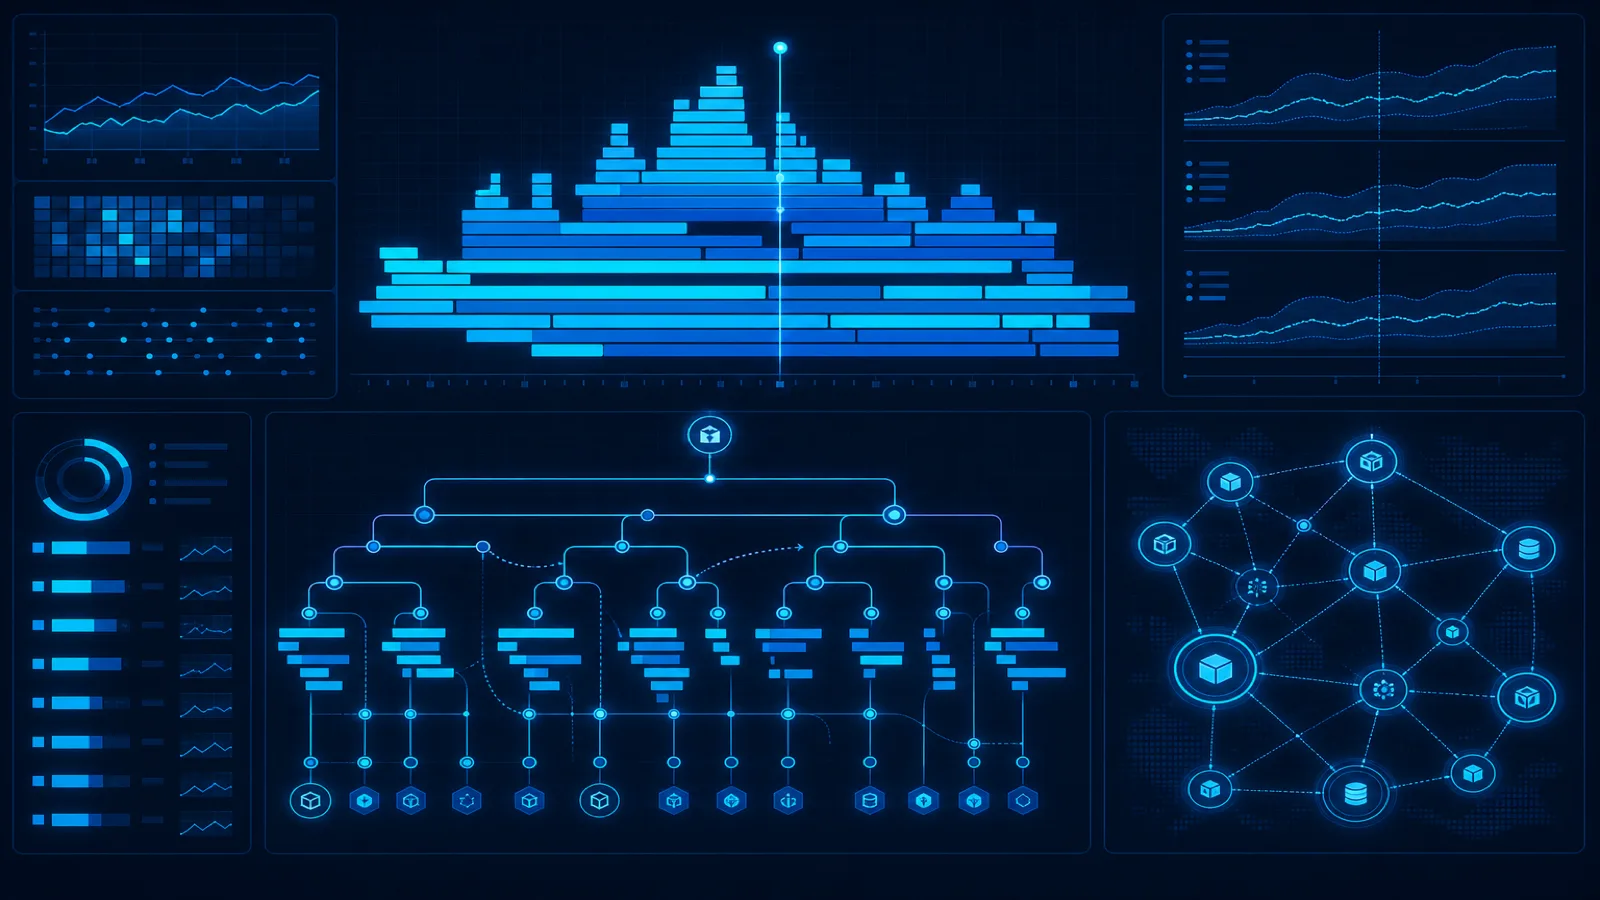
Short answer: Application Performance Monitoring (APM) instruments application requests and dependencies to measure latency, throughput, errors, and code-level execution paths. It is strongest for diagnosing why a service is slow or failing; independent uptime checks still confirm whether users can reach it when agents or telemetry fail. See the OpenTelemetry observability primer, observability vs monitoring, and OpenTelemetry guide.
Application Performance Monitoring (APM) is the deepest of the monitoring layers — the one that instruments your code at the function level, traces requests as they cross service boundaries, and tells you exactly which span of which service made a request slow. Tools like Datadog, New Relic, AppDynamics, Dynatrace, and OpenTelemetry-based stacks sit inside your application, watch every database call and downstream HTTP request, and produce service maps, flame graphs, and per-endpoint error rates. When you need to know which microservice caused the 4-second checkout latency, APM is the only layer that answers.
But APM is also the most expensive and operationally heavy monitoring layer, and a common mistake is adopting it before the team needs it — paying Datadog-scale prices and carrying agent overhead for an app where uptime monitoring plus error tracking would cover 90% of the cases. This guide explains what APM is, what it measures, when it's worth the cost, when it isn't, and how it fits alongside the outside-in monitoring that catches what APM can't.
What APM is
APM is the continuous instrumentation of your application's runtime to measure performance and errors at the request, service, and function level. An APM agent (Datadog's dd-trace, New Relic's agent, the OpenTelemetry SDK) wraps your HTTP handlers, database drivers, cache clients, and downstream HTTP calls, and emits three kinds of signal:
- Traces — a tree of spans representing one request's journey through your system. A checkout request becomes a root span with child spans for
DB.query(users),HTTP.call(stripe),cache.get(session), each with its own duration. - Metrics — aggregated per-service and per-endpoint numbers: request rate, error rate, latency percentiles (p50, p95, p99), throughput. These are the four golden signals in numeric form.
- Service maps and dependencies — a live graph of which service calls which, with health overlaid on each edge.
The payoff is root-cause attribution. When checkout is slow, APM's flame graph shows you that 3.8 of the 4 seconds were spent in HTTP.call(stripe) waiting for a tokenization request — something no outside-in check can tell you. For a deeper treatment of the traces/metrics/logs model that underpins modern APM, see our OpenTelemetry monitoring guide.
What APM measures well
APM owns the inside-out performance layer. Its strengths:
- Per-service and per-span latency. The exact span that burned the time. See latency percentiles for why p95/p99 matter more than averages.
- Service-to-service dependency maps. A live diagram of your architecture with health on every edge — invaluable in a microservices environment.
- Throughput and error rate per endpoint. The four golden signals (latency, traffic, errors, saturation) measured per route.
- Distributed traces across services. A single request that hit the API, the auth service, the database, and a payment provider — traced end to end with the contribution of each.
- Apdex and SLO tracking. APM backends compute satisfaction scores and error budgets from the underlying span data.
For a mature microservices deployment, APM is non-negotiable — you cannot debug cross-service latency without it.
When you actually need APM (and when you don't)
The honest question most teams skip: do we need APM yet, or are we paying for it because Datadog's sales deck said observability is non-negotiable? APM earns its cost when:
- You have multiple services. A single-service app rarely needs distributed tracing; the spans never cross a boundary. Once you have 3+ services calling each other, APM's service map and cross-service traces start paying for themselves.
- Latency is revenue-critical and hard to localize. If checkout being 500ms slower costs you conversions and you can't tell whether it's the DB, the cache, or a downstream API, APM is the tool that localizes it.
- You have the operational maturity to act on it. APM produces a firehose of data; a team without SLOs, without on-call discipline, and without time to tune instrumentation will drown in it. See monitoring for startups for the "reliability before scale" framing.
APM is often overkill when:
- You run a single service. No service boundaries means distributed traces have nothing to span. Uptime + error tracking + response-time monitoring covers most of what you'd use APM for.
- You're early-stage. The cost (Datadog and New Relic scale into four-figure monthly bills fast) and agent overhead exceed the diagnostic value before complexity demands it. Start with uptime monitoring and error tracking; add APM when you genuinely can't localize a latency problem any other way.
- Your perf problems are external. If your slowness is a third-party API, a CDN, or DNS — APM sees the span but the fix is outside your code. Outside-in monitoring catches these faster and cheaper. See third-party API monitoring.
Many teams reconsidering their APM bill land on our Datadog alternative and New Relic alternative guides — not because APM is bad, but because they were paying for APM when they needed uptime monitoring.
What APM misses
APM is inside-out, so it shares the structural blind spot of every inside-out tool: it can only see requests that reach your instrumented code. The failures it can't catch:
- Total outages and routing failures. If the load balancer has no healthy targets or DNS is broken, no request reaches your agent, so APM records zero traffic — which looks like "quiet," not "down."
- CDN and edge failures. A 520 from the edge never touches your origin, so APM never sees it. See Cloudflare monitoring.
- Third-party dependencies outside your instrumented boundary. APM sees the span where you call Stripe, but if Stripe is globally down, APM tells you your calls are failing — it doesn't tell you Stripe is down for everyone else. Outside-in monitoring of the provider does.
- The APM agent itself going down. If the agent stops shipping, your dashboards go flat — indistinguishable from "no traffic." This is the same silent-shipper trap that hits log monitoring.
- Config, content, and SEO changes. A
robots.txtregression or a dropped schema field never produces a span. See SEO health monitoring. - The user's actual experience of "slow." APM measures server-side span durations; it doesn't measure what the user felt — page render time, INP, LCP. That's the job of real-user monitoring and synthetic monitoring. See black-box vs white-box monitoring for the full framing.
The pattern: APM tells you what your services did; it cannot tell you what users experienced when the failure happened outside your services.
APM vs uptime monitoring vs RUM vs error tracking
The cleanest way to think about the four layers is by the question each answers:
| Layer | Question it answers | Example failure it catches |
|---|---|---|
| Uptime monitoring (outside-in) | Can users reach and use my site? | DNS down, CDN 520, total outage |
| Error tracking (inside-out) | Is my code throwing exceptions? | Null pointer in calculate_tax() |
| APM (inside-out, deep) | Which service/span caused the slowness? | 3.8s spent in Stripe tokenization span |
| RUM (client-side) | What did real users actually experience? | INP 600ms on mobile checkout |
Mature teams run all four, weighted by complexity. A two-person startup with one service runs uptime + error tracking and is well-covered. A 50-engineer microservices org runs all four and still reaches for outside-in monitoring the moment a failure is outside their boundary. See monitoring for non-technical founders for the same logic in plain language.
Practical monitoring baseline
- Instrument inbound requests, outbound dependencies, errors, and critical business spans with trace context.
- Measure throughput, error ratio, and latency distributions by normalized operation and release.
- Control sampling and cardinality, monitor agent/export health, and retain outside-in availability checks.
How Webalert Helps
Webalert is the outside-in layer — the alarm that catches everything APM's inside-out instrumentation can't:
- Multi-region uptime and API monitoring catches total outages, DNS, CDN edge failures, and routing problems — the entire class of "APM shows zero traffic but the site is down."
- Independent endpoint and content checks cover the lower layer of a critical path. Webalert's published feature set does not list browser or multi-step transactions, so keep login/search/checkout journeys in a separate synthetic tool.
- Response-time and TTFB alerts give a lightweight, outside-in latency signal for teams that aren't ready to pay for full APM — and a user-perspective cross-check for teams that are.
- Monitor your APM backend as a dependency. The Datadog/New Relic ingest endpoint is itself an external API; monitor it with authenticated API monitoring so a flat APM dashboard never gets mistaken for a healthy app.
- Content change detection and SEO health monitoring catch the config and content failures APM never records.
- A focused outside-in complement for early-stage teams. Pair Webalert's availability checks with a separate error tracker when full APM is not yet justified; this is not built-in error tracking or a replacement for traces. See our Datadog alternative and New Relic alternative guides.
Webalert won't produce a flame graph — that's APM's job. But Webalert will tell you the moment your site is failing for users in a way your APM can't see, and confirm the moment it's recovered — often before your APM agent even has a span to show.
Summary
APM (Application Performance Monitoring) is the deepest monitoring layer: it instruments your code at the function level, traces requests across service boundaries, and attributes latency and errors to specific spans and services. It earns its cost when you have multiple services, revenue-critical latency you can't otherwise localize, and the operational maturity to act on its data. It's often overkill for single-service or early-stage apps, where uptime monitoring plus error tracking covers most cases at a fraction of the cost. APM's structural blind spot is the same as every inside-out tool: it only sees requests that reach your instrumented code, so total outages, DNS/CDN failures, third-party dependencies outside your boundary, the APM agent itself going down, and config/content changes all produce no signal — and silence looks like health. Pair APM with outside-in uptime monitoring, error tracking, and RUM, weighted by your complexity, and monitor your APM backend's ingest endpoint so a flat dashboard never fools you.
APM adoption checklist
- Multiple services calling each other before adopting distributed tracing
- SLOs defined (latency, error rate, availability) before paying for APM
- APM agent deployed to every service in the critical path (gaps = blind spots)
- Sample rate tuned to balance cost vs trace completeness
- APM backend ingest endpoint monitored as an external dependency
- Outside-in uptime monitoring covers total outages, DNS, CDN, and third-party APIs
- Separate browser or multi-step synthetic monitors walk login/search/checkout with assertions
- Error tracking in place alongside APM (APM shows slow; error tracking shows broken)
- RUM or synthetic monitoring covers the client-side experience APM can't see
- Cost reviewed quarterly — many teams over-pay for APM they under-use
Frequently Asked Questions
What is APM (Application Performance Monitoring)?
APM is the continuous instrumentation of your application's runtime to measure performance and errors at the request, service, and function level. An APM agent wraps your HTTP handlers, database drivers, and downstream calls, and emits traces (trees of spans showing one request's journey), metrics (per-endpoint latency, error rate, throughput), and service maps. It's the layer that tells you which service and which span caused a slow request.
When do I need APM?
You need APM when you have multiple services calling each other and latency problems you can't localize any other way. A single-service or early-stage app usually doesn't need APM — uptime monitoring plus error tracking covers most cases at a fraction of the cost. APM earns its cost (and operational overhead) when distributed traces and service maps start paying for themselves, which typically happens at 3+ services with revenue-critical latency.
Can APM detect when my website is down?
Not reliably. APM only sees requests that reach your instrumented code, so a total outage, DNS failure, CDN edge error, or routing problem produces zero traffic — which looks like "quiet" in APM, not "down." The APM agent itself going down also produces a flat dashboard indistinguishable from healthy. Pair APM with outside-in uptime monitoring to detect these failures.
What's the difference between APM and uptime monitoring?
APM is inside-out: it instruments your code and tells you which service and span caused a slow or failing request. Uptime monitoring is outside-in: it probes your site the way a user would and tells you whether users can reach and use it. APM answers "why is checkout slow?"; uptime monitoring answers "is checkout working at all for users?" Mature teams run both, because each catches failures the other can't.