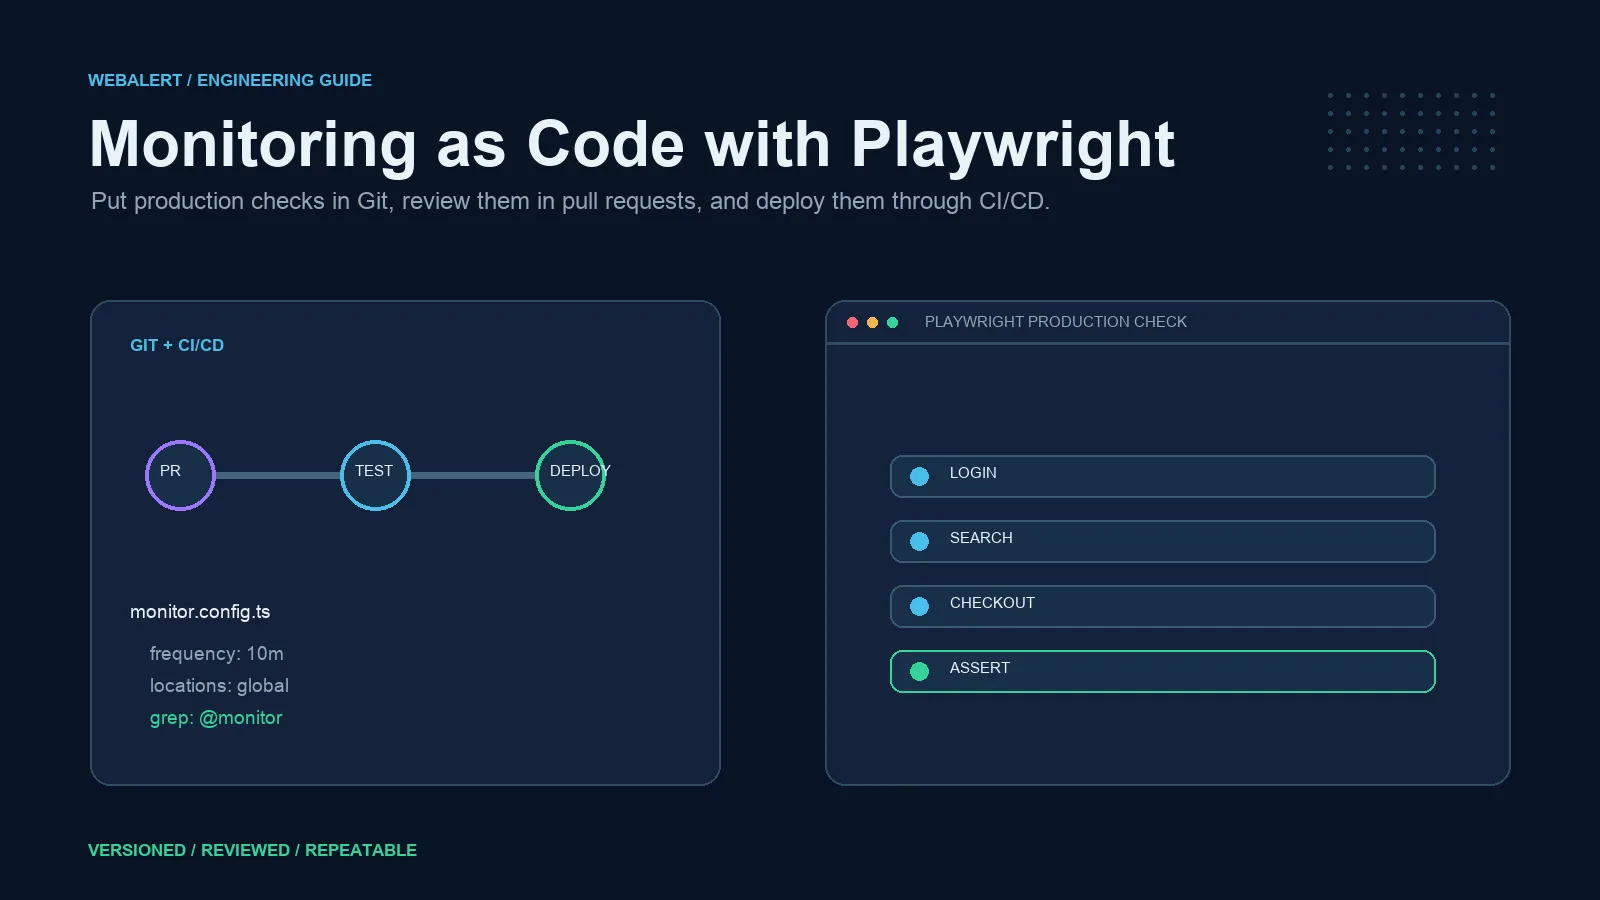
Monitoring as Code With Playwright and CI/CD
Manage production journeys as code with Playwright, GitHub Actions, safe test data, resilient locators, failure traces, deployment review, and alert ownership.
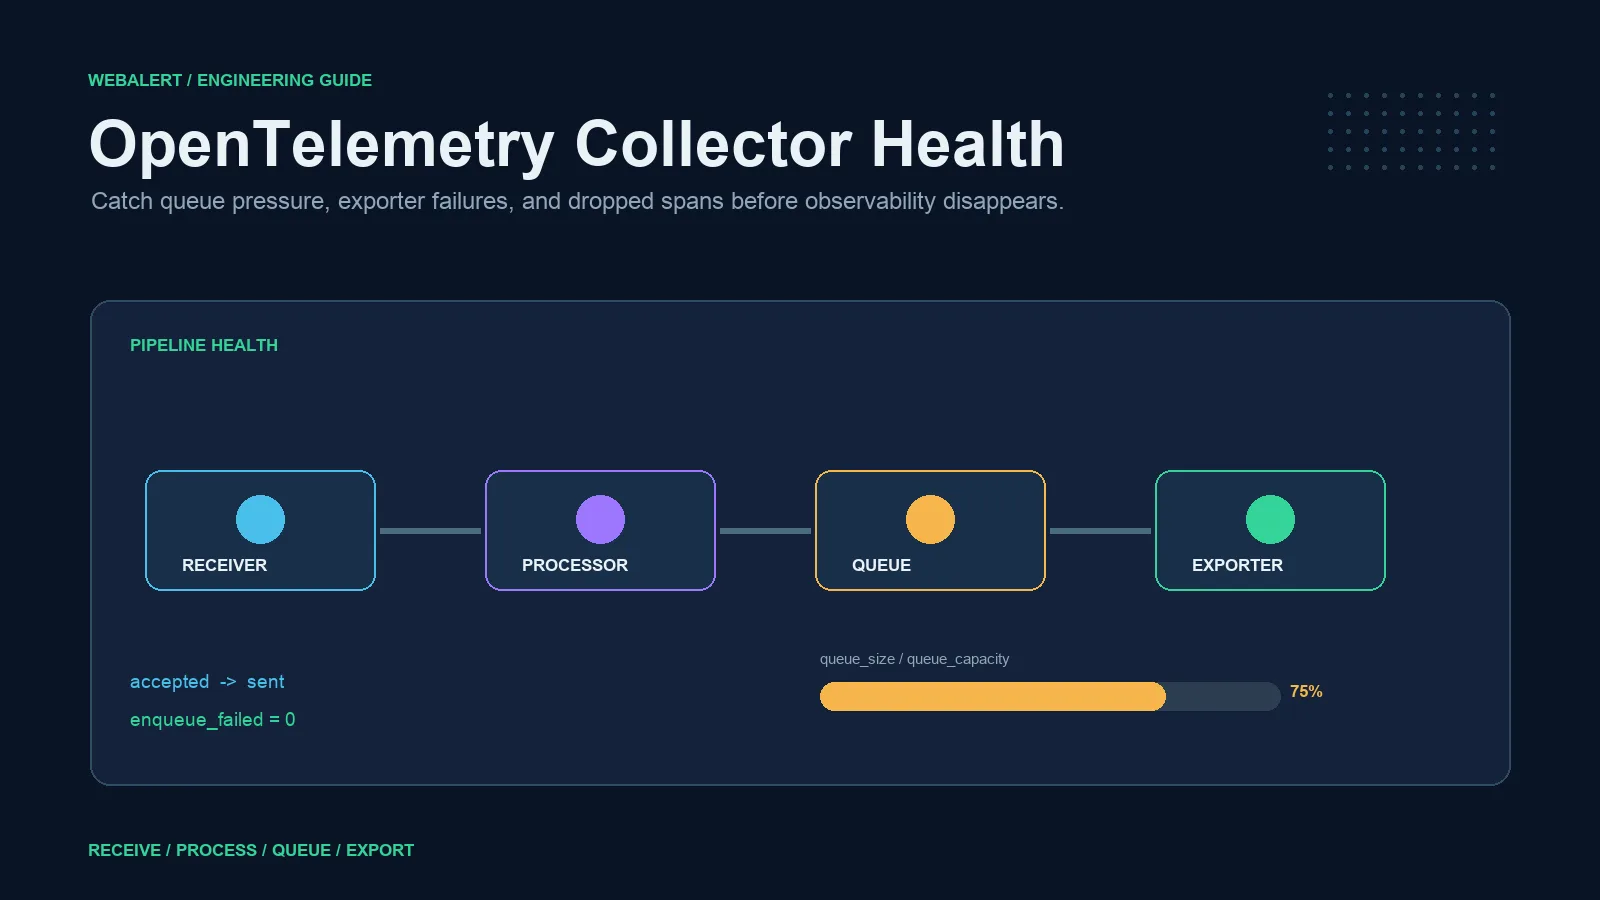
OpenTelemetry Collector Monitoring: Queues and Drops
Monitor Collector receive, refuse, enqueue, export and drop paths with queue utilization, exporter failures, memory pressure and end-to-end canaries.
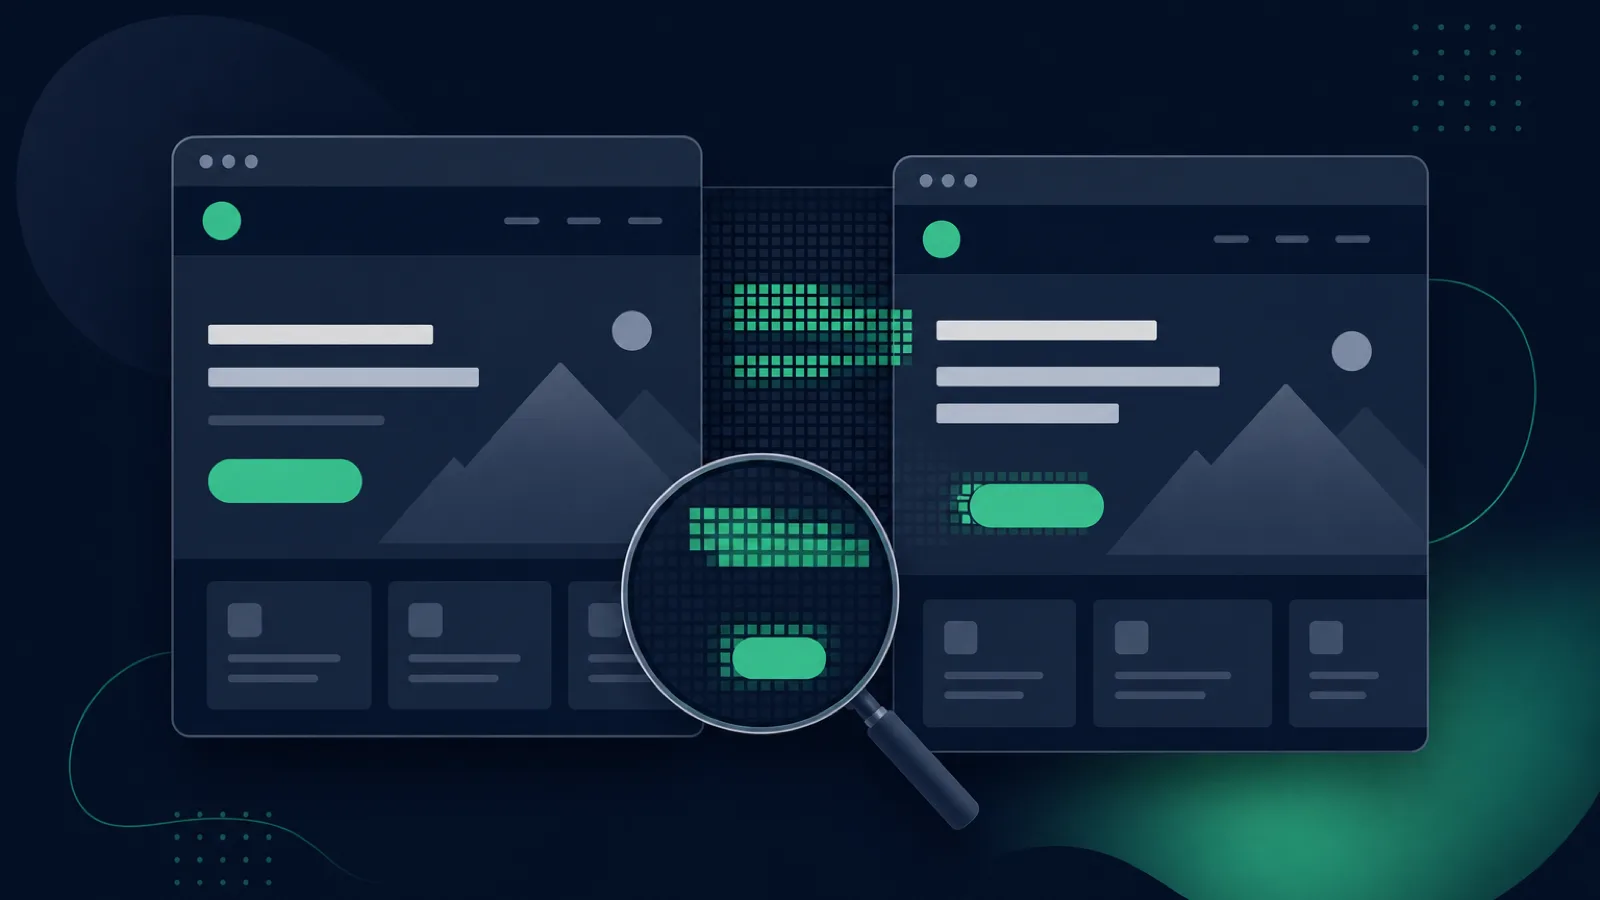
Visual Regression Monitoring: Stable Screenshot Comparisons
Detect layout, font, asset, theme, and overlay regressions with deterministic screenshots, masking, perceptual diffs, and DOM assertions.
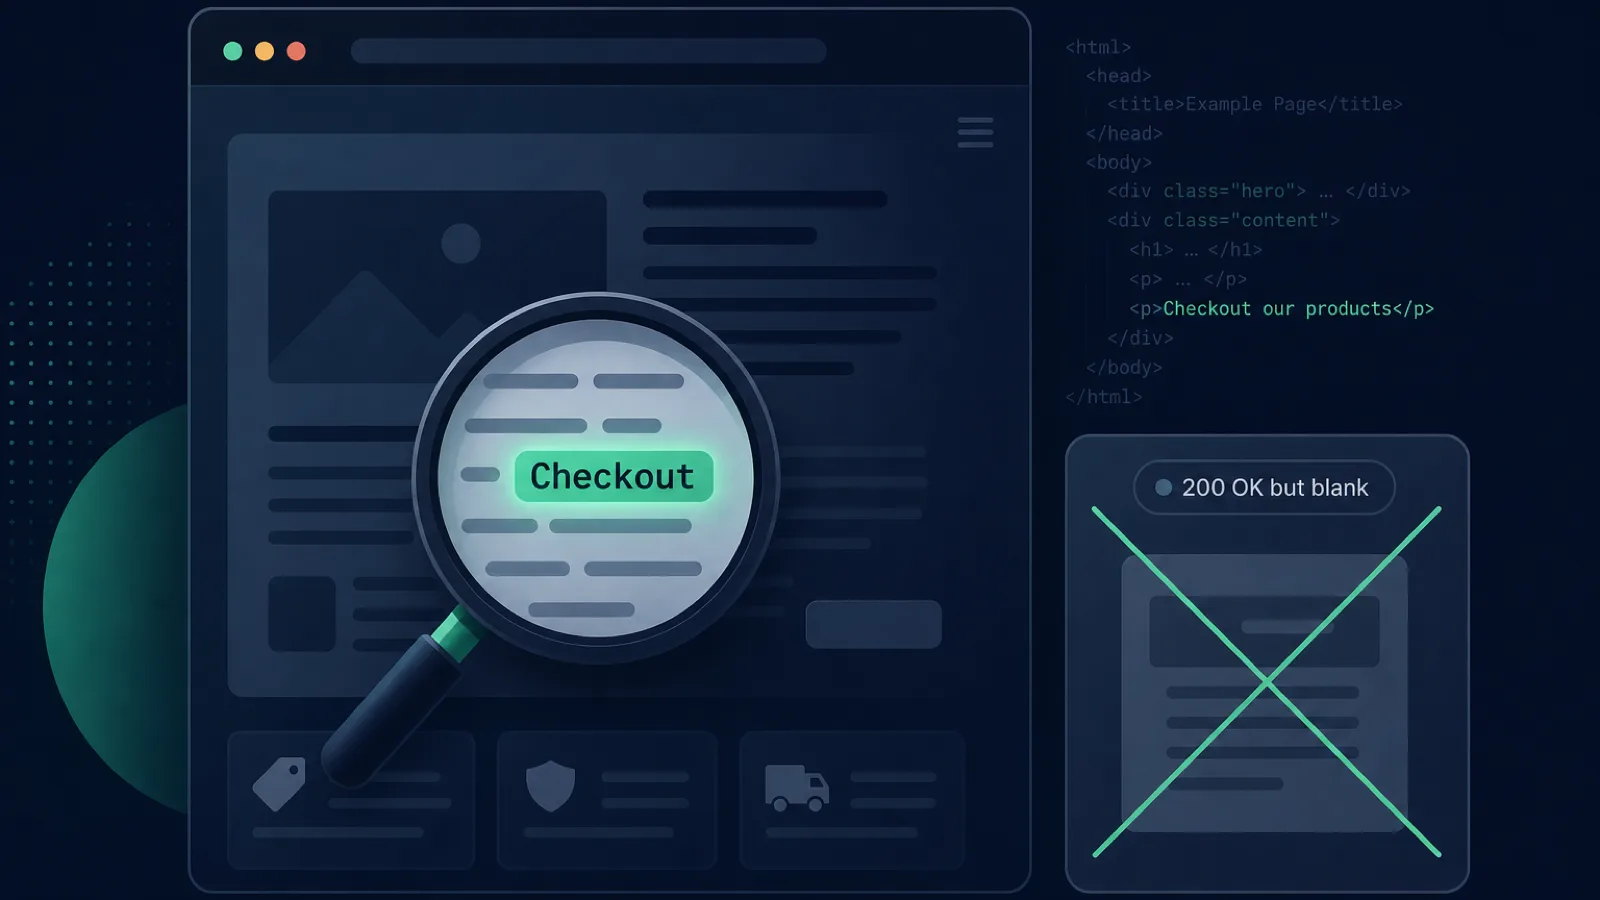
Keyword Monitoring: Validate Content Inside 200 Responses
Use must-contain and must-not-contain assertions to catch wrong content, error templates, and soft 404s, with browser checks for client-rendered pages.
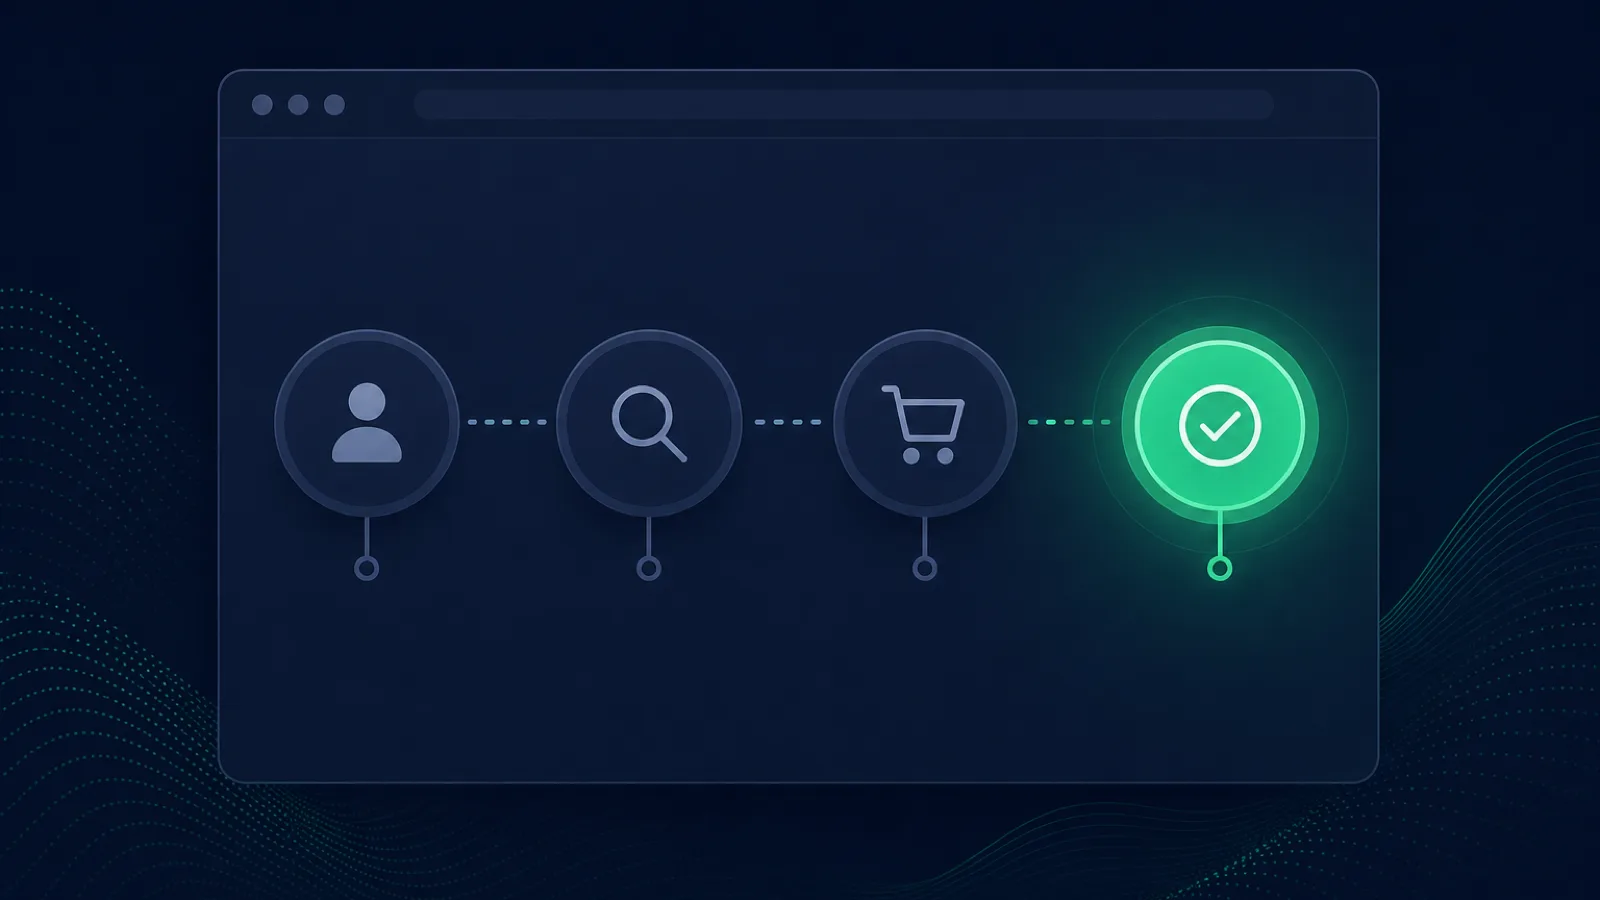
Transaction Monitoring: Multi-Step User Journeys
Monitor login, checkout and other multi-step browser journeys with safe test data, stable assertions, diagnostics and maintenance controls.
Error Monitoring vs Uptime Monitoring: Differences
Compare exception tracking with outside-in uptime checks, see which failures each misses, and combine both without duplicating noisy alerts.
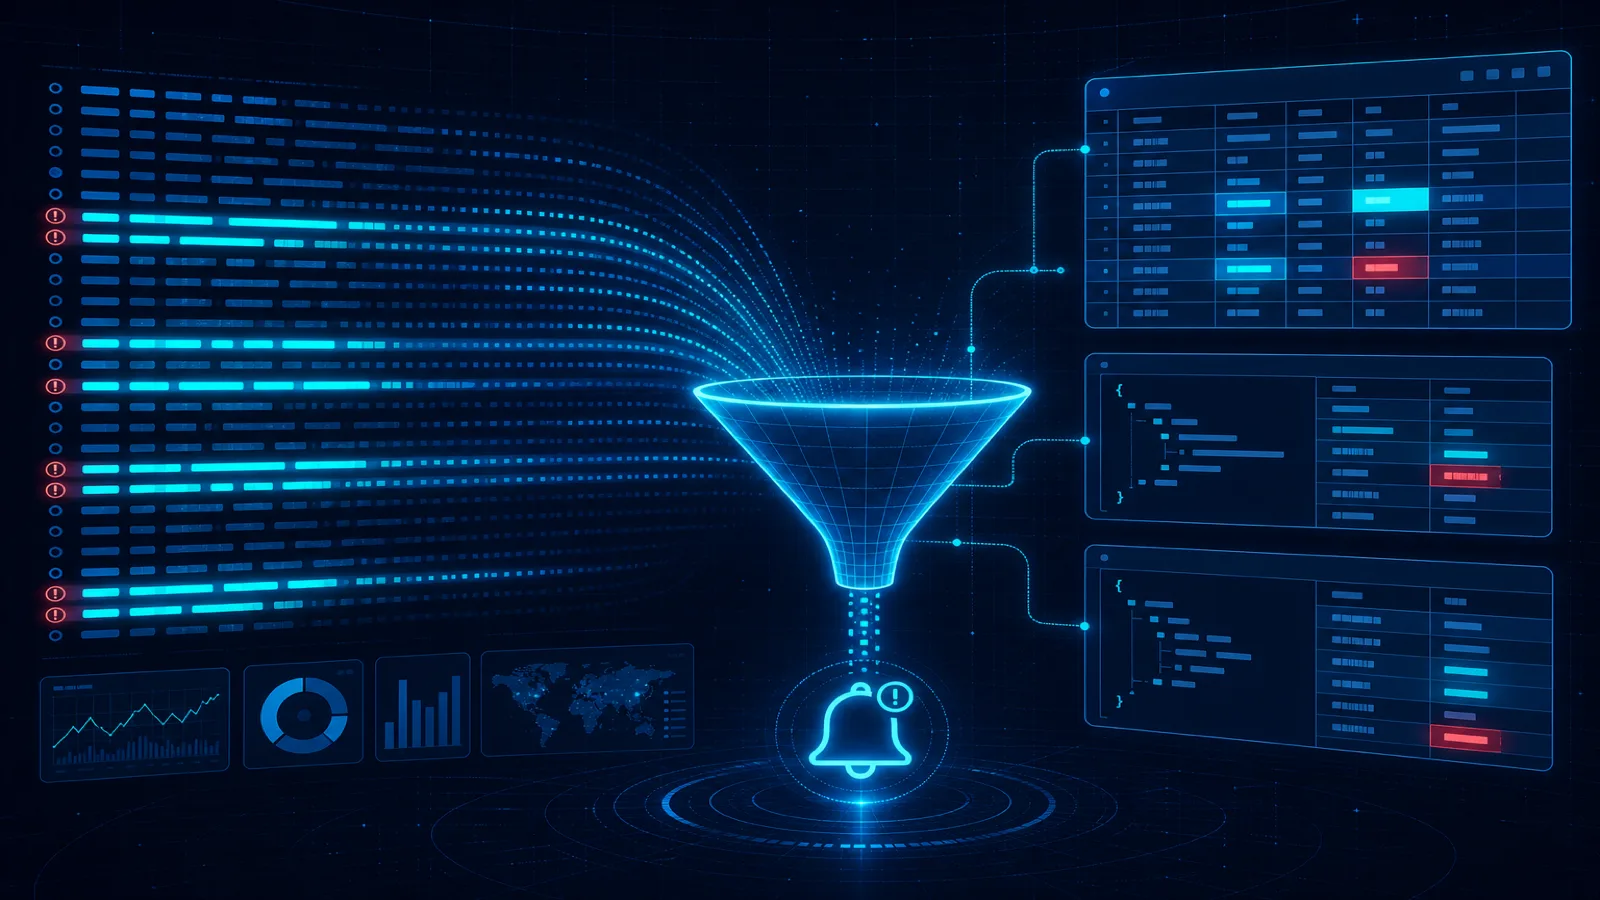
Log Monitoring: What Logs Catch, Miss, and Alert On
Build structured log monitoring with stable fields, rate-based alerts, correlation IDs and pipeline health while covering outages logs cannot observe.
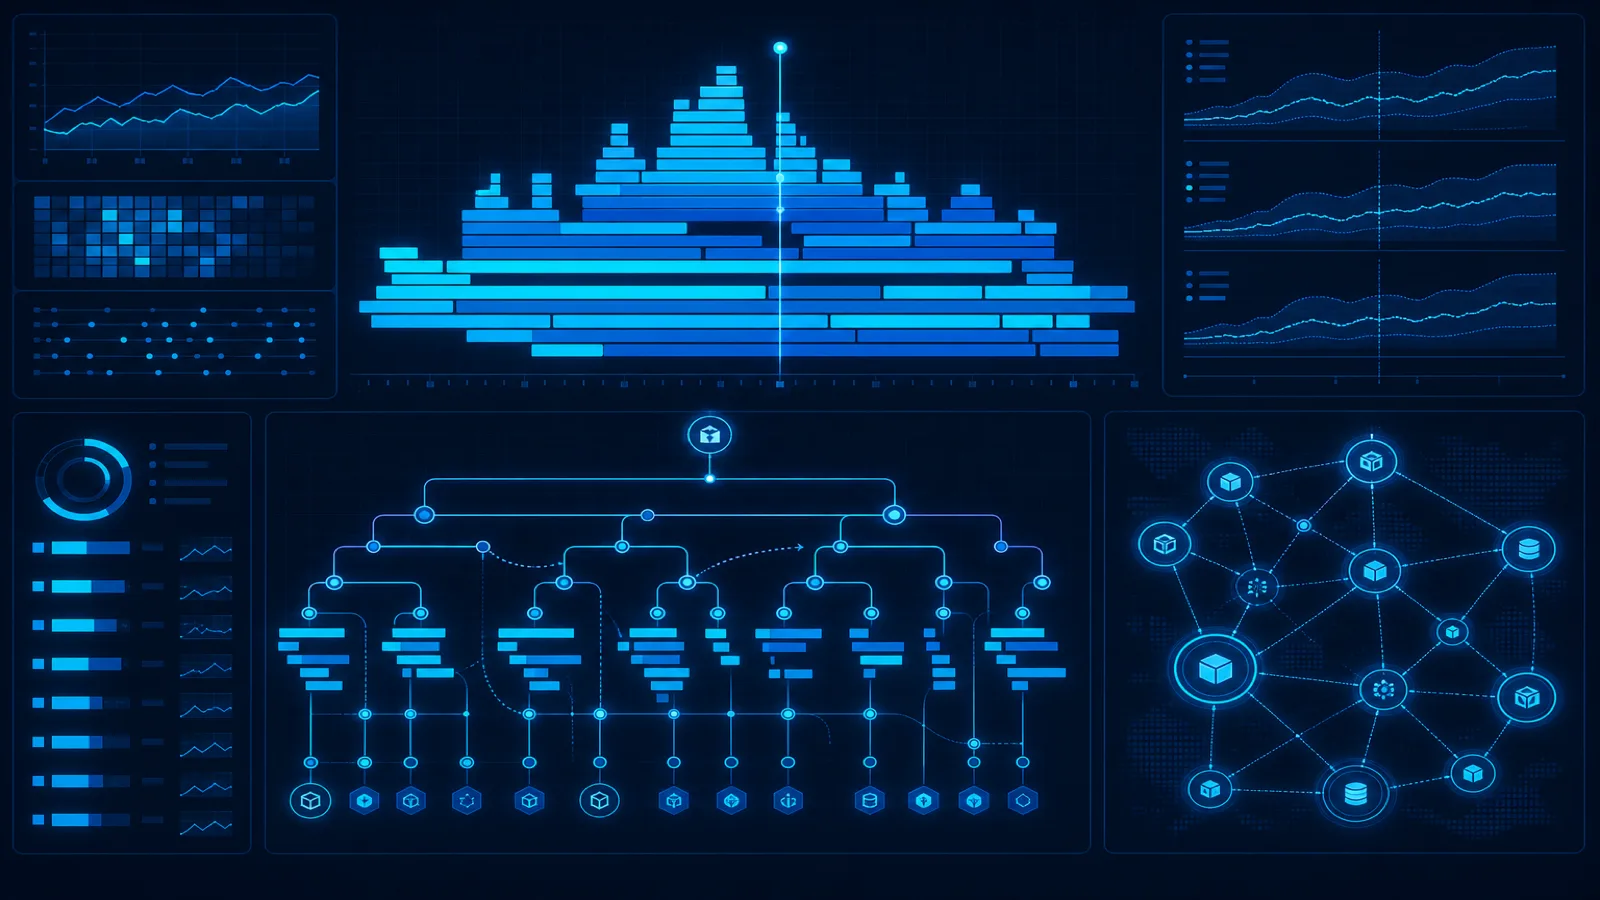
What Is APM? Application Performance Monitoring Guide
Learn how APM uses traces, spans, service maps, errors and latency to diagnose application performance, and how it differs from uptime monitoring.
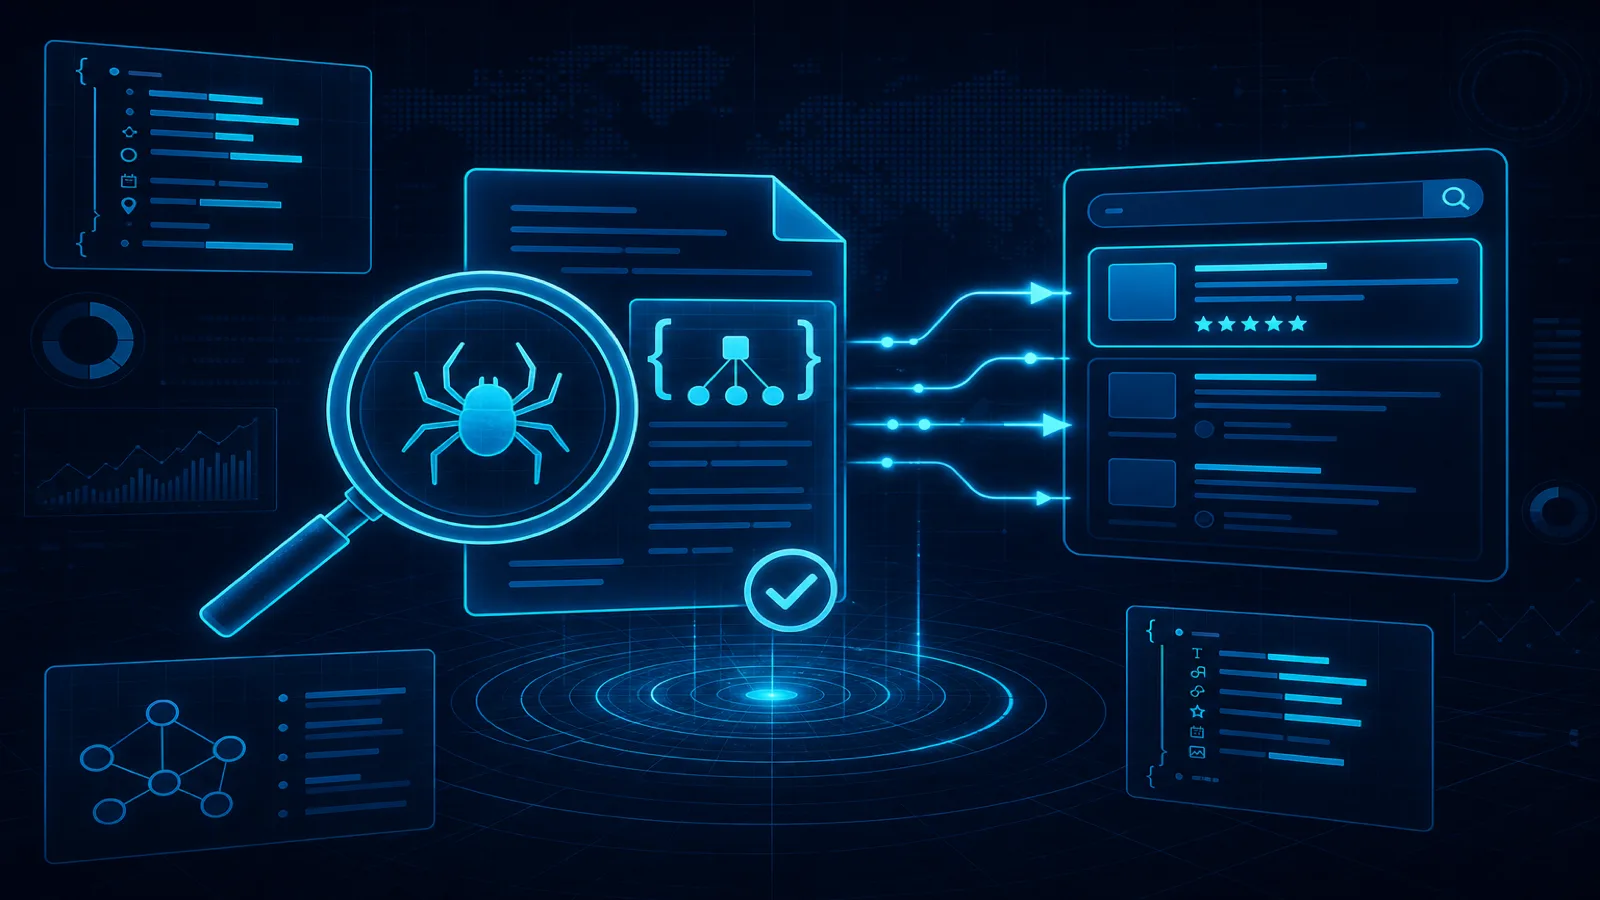
SEO Health Monitoring: Crawl, Index, Render & Schema Checks
Monitor crawl access, indexing directives, sitemap integrity, rendered content, canonicals, and structured-data eligibility as separate SEO controls.
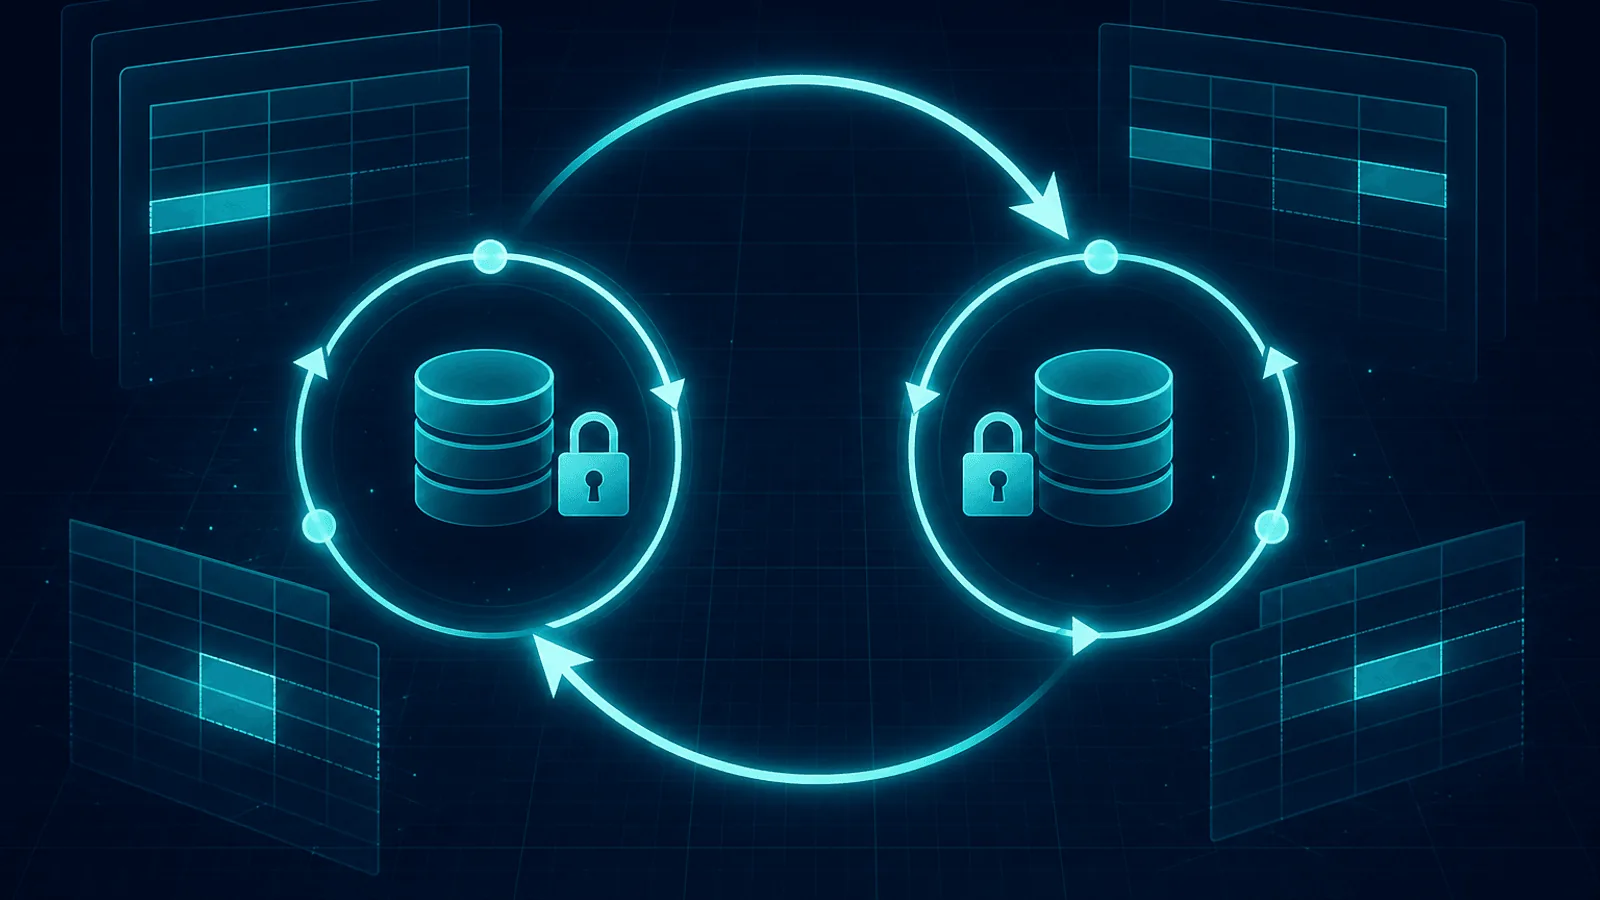
Database Deadlocks: Causes, Detection, and Prevention
Understand database deadlocks, inspect PostgreSQL and MySQL lock waits, prevent cycles with deterministic lock order, and retry aborted transactions safely.

Memory Leaks in Production: Detection and Debugging Guide
Detect production memory leaks by separating heap, RSS, native memory, cache growth, and workload effects; capture profiles safely before OOM restarts.
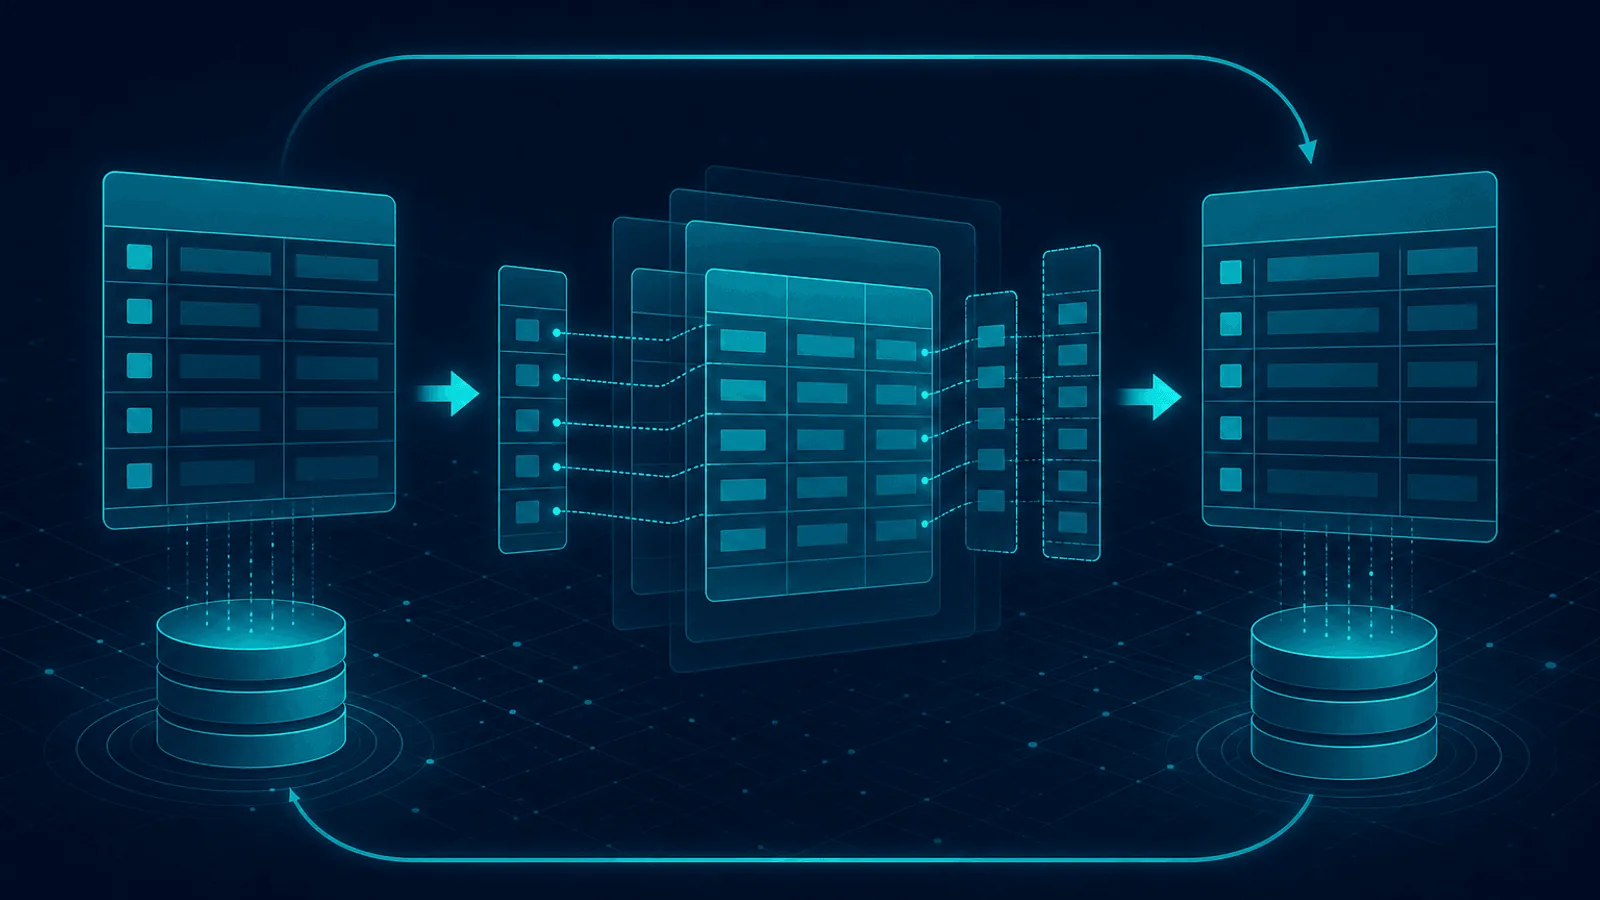
Zero-Downtime Database Schema Migrations: Safe DDL
Plan zero-downtime PostgreSQL and MySQL schema migrations with lock budgets, explicit DDL algorithms, expand-and-contract deploys, backfills, and rollback.

Backpressure in Distributed Systems: Practical Flow Control
Design backpressure with demand signals, bounded buffers, admission control, timeouts, load shedding, and queue metrics so slow consumers stay contained.

Handling 429 Too Many Requests from Rate-Limited APIs
Handle HTTP 429 responses safely with Retry-After, bounded exponential backoff, jitter, shared client budgets, idempotency, and rate-limit monitoring.

Queue Depth Monitoring: Backlog, Age, and Drain Rate
Monitor queue depth with oldest-message age, arrival rate, throughput, consumer health, and drain-time forecasts so backlog alerts reflect user impact.

Cache Stampede vs Thundering Herd: Prevention Patterns
Compare cache stampede, thundering herd, and cache avalanche; prevent synchronized misses with request coalescing, stale data, TTL jitter, and load limits.
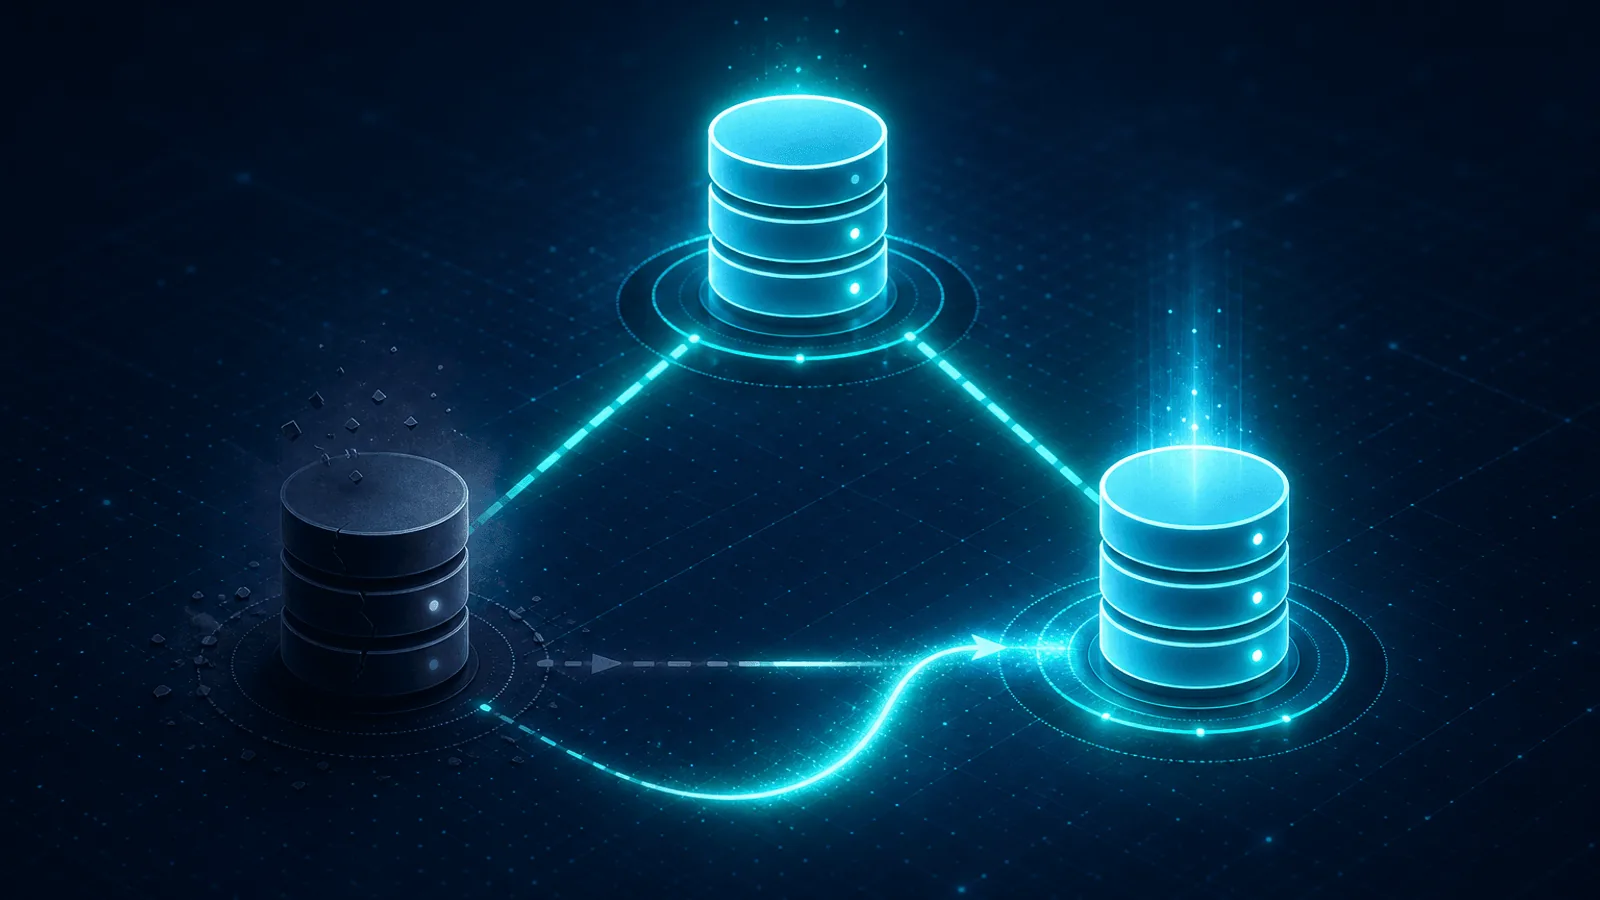
Database Failover and High Availability: A Practical Guide
Learn database failover, quorum, fencing, RTO and RPO; test standby promotion, client reconnection, replica currency, and end-to-end recovery.
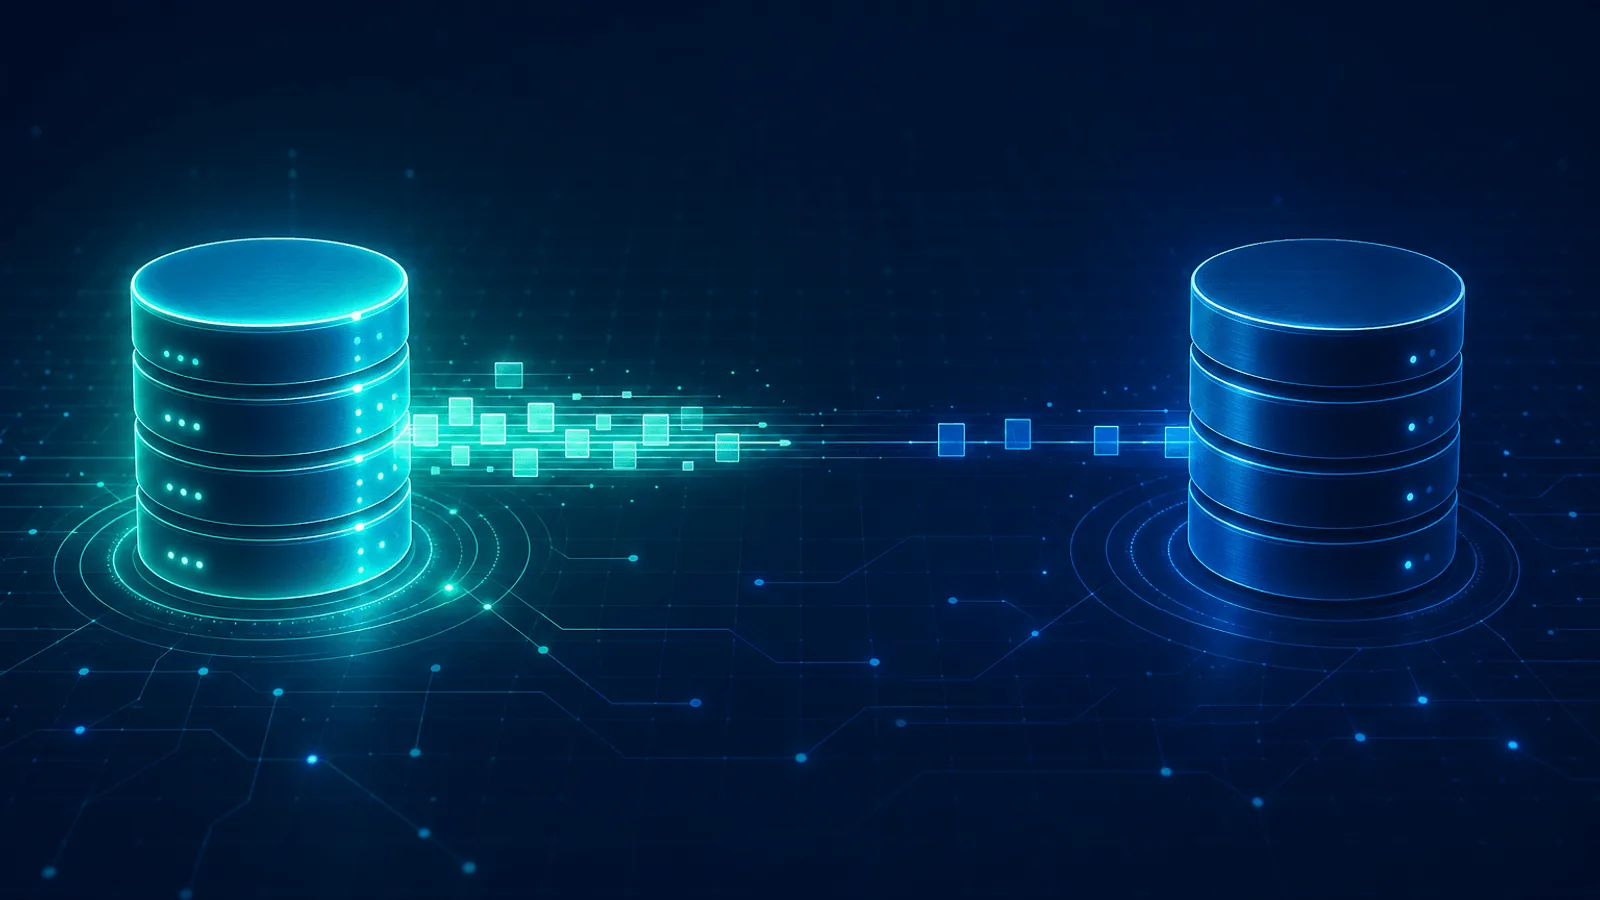
Database Replication Lag: Measure, Diagnose, and Reduce It
Measure replication lag correctly in PostgreSQL, MySQL, and MongoDB; diagnose network, apply, I/O, and workload bottlenecks; protect stale reads and failover.
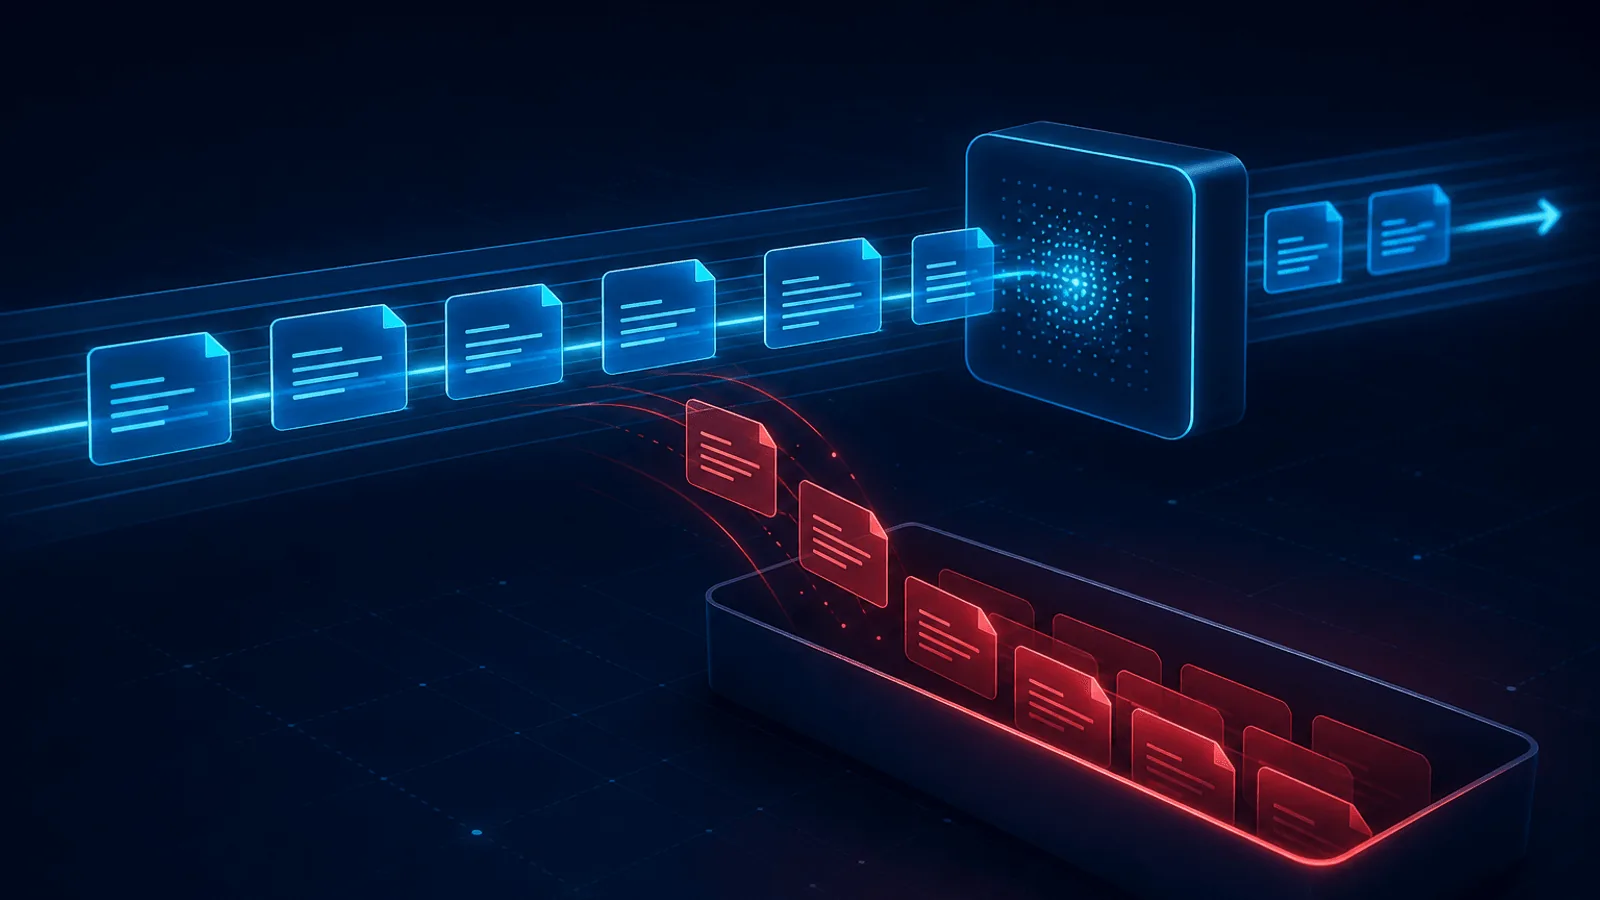
Dead Letter Queues: Monitoring, Triage, and Safe Redrive
Learn why messages enter a dead letter queue, what metadata to retain, how to alert and triage failures, and how to redrive safely without duplicates.
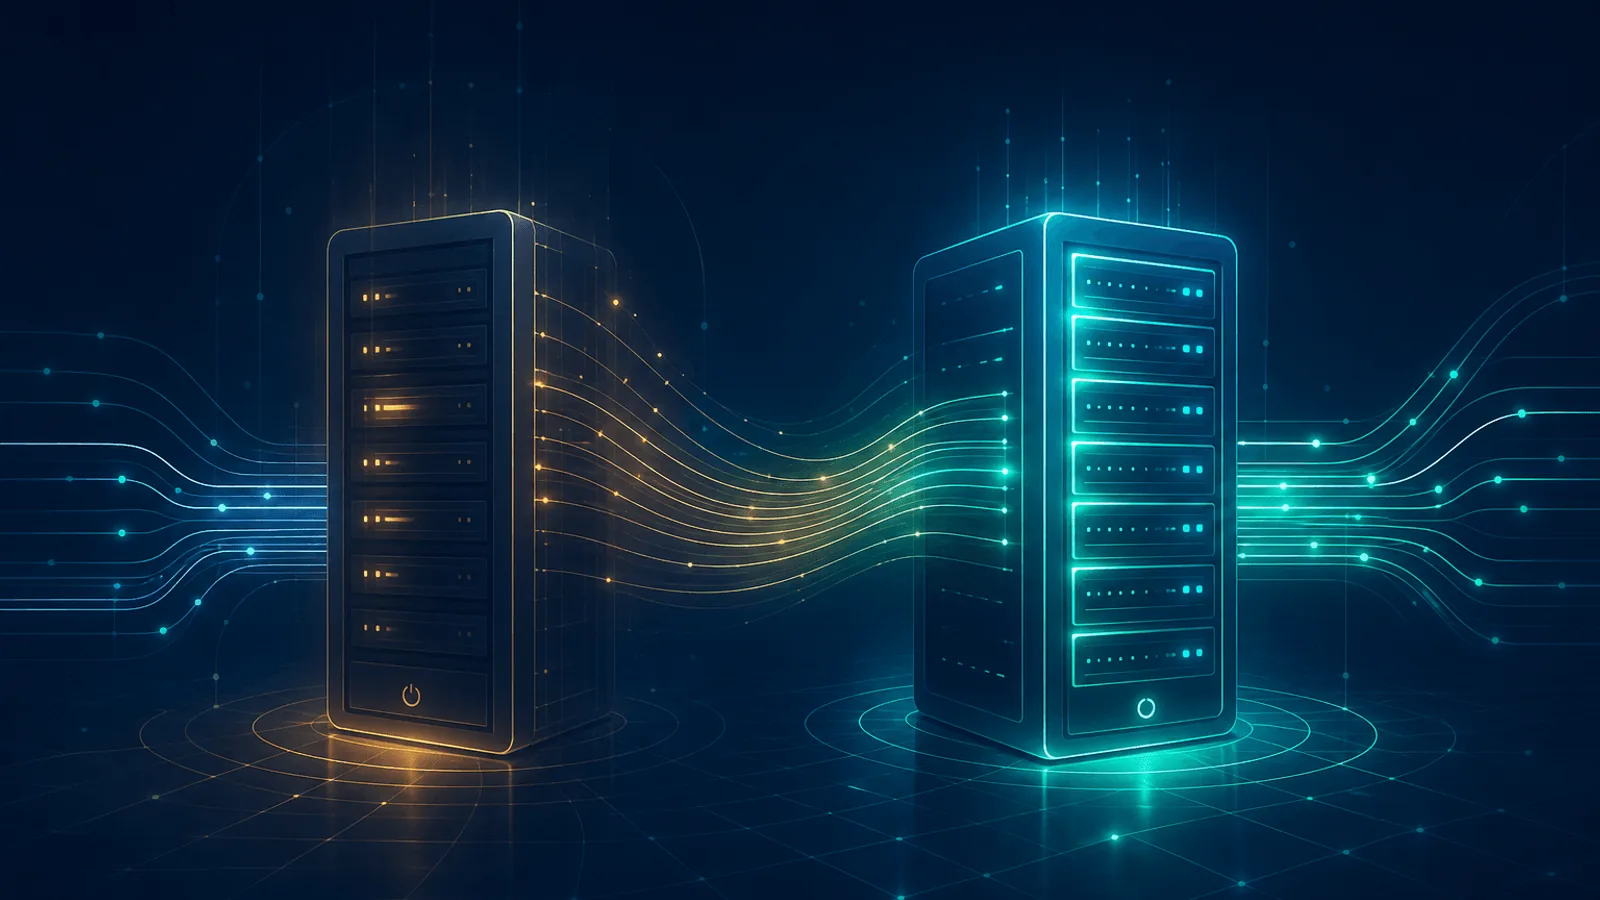
Graceful Shutdown in Kubernetes: SIGTERM, Drain, and Deadlines
Implement graceful shutdown with readiness removal, SIGTERM handling, request and queue drain, resource cleanup, and Kubernetes termination deadlines.

Circuit Breaker Pattern: States, Tuning, and Monitoring
Implement circuit breakers with closed, open, and half-open states; tune failure windows, probe recovery, fallbacks, and alerts without masking outages.

Exponential Backoff & Jitter: Stop Retry Storms (Code & Math)
Learn how exponential backoff with jitter prevents retry storms. Compare full, equal, and decorrelated jitter formulas, retry budgets, and code examples.

Alert Flapping: Detection, Dampening, and Hysteresis
Stop flapping alerts with pending duration, consecutive checks, hysteresis, dampening, multi-location confirmation, and root-cause investigation.

Graceful Degradation: Designing Systems That Fail Well
Design graceful degradation with fallbacks, deadlines, circuit breakers, load shedding, kill switches, and explicit monitoring for degraded states.

Idempotency Keys in REST APIs: Safe Retries & Webhooks Explained
Learn how idempotency keys prevent duplicate side effects in REST APIs and webhooks. Includes safe retry design, deduplication, concurrency, and code.

Chaos Engineering: How to Run Safe Failure Experiments
Plan a safe chaos experiment with a steady-state hypothesis, blast radius, abort conditions, monitoring probes, rollback, and a reusable experiment record.
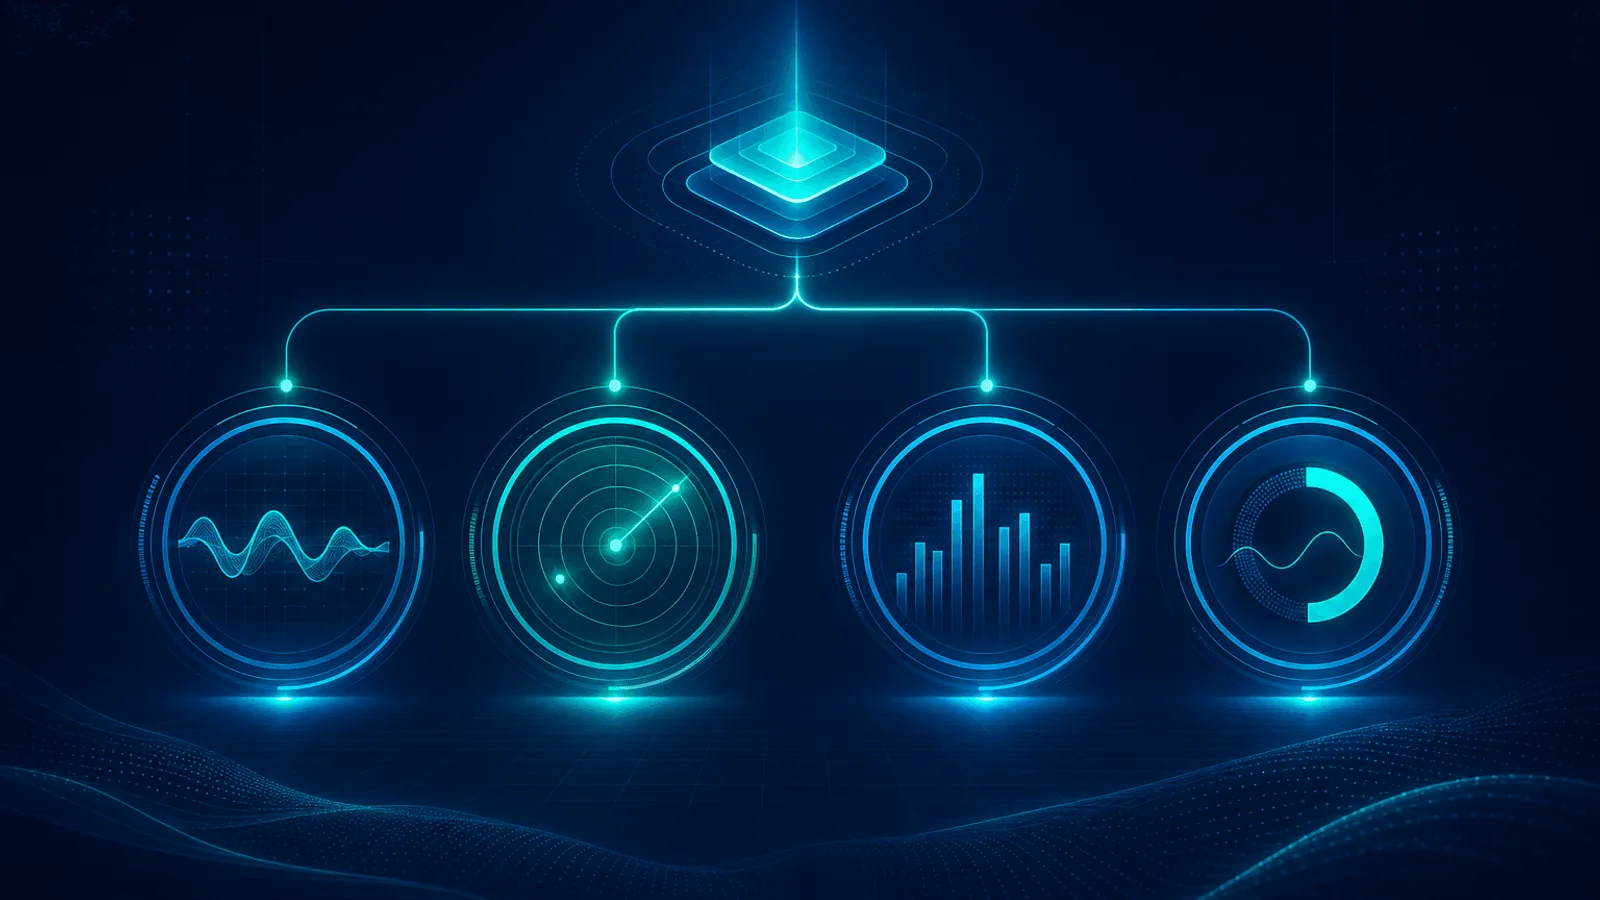
Four Golden Signals: Latency, Traffic, Errors, Saturation
Apply latency, traffic, errors and saturation to service monitoring, choose useful measurements, and alert on user impact instead of dashboard noise.

Incident Severity Levels: SEV1, SEV2, and SEV3 Explained
Define SEV1, SEV2, and SEV3 incident severity by customer impact, scope, workaround, and data risk, with a practical five-level response matrix.

RED vs USE Method: Metrics, Differences, Examples
Use RED for service requests and USE for resources, understand each framework’s metrics and blind spots, and connect them during incident diagnosis.
Best Free Uptime Monitoring Tools 2026 Compared
Free uptime tools compared (Aug 2026): monitors, check interval, status pages, alerts, and what you lose at the free-plan ceiling.

How to Evaluate Vendor SLAs, Uptime Guarantees, and Support Terms
Evaluate vendor uptime and support SLAs with a practical scorecard for definitions, exclusions, credits, claim evidence, response targets, and exit rights.

AWS vs Azure vs Google Cloud SLAs: Uptime and Service Credits Compared
Compare AWS, Azure, and Google Cloud uptime SLAs, redundancy requirements, exclusions, service credits, claims, and composite availability with proof.

RTO vs RPO: Disaster Recovery Objectives Explained
Understand RTO versus RPO with a timeline, worked examples, business-impact method, recovery tiers, backup requirements, testing, and monitoring.

Cron Dead-Man Switch Monitoring: Detect Missed Scheduled Jobs
Detect cron jobs that never run with schedule-aware heartbeats, last-success timestamps, grace periods, idempotent retries, and clear missed-job alerts.
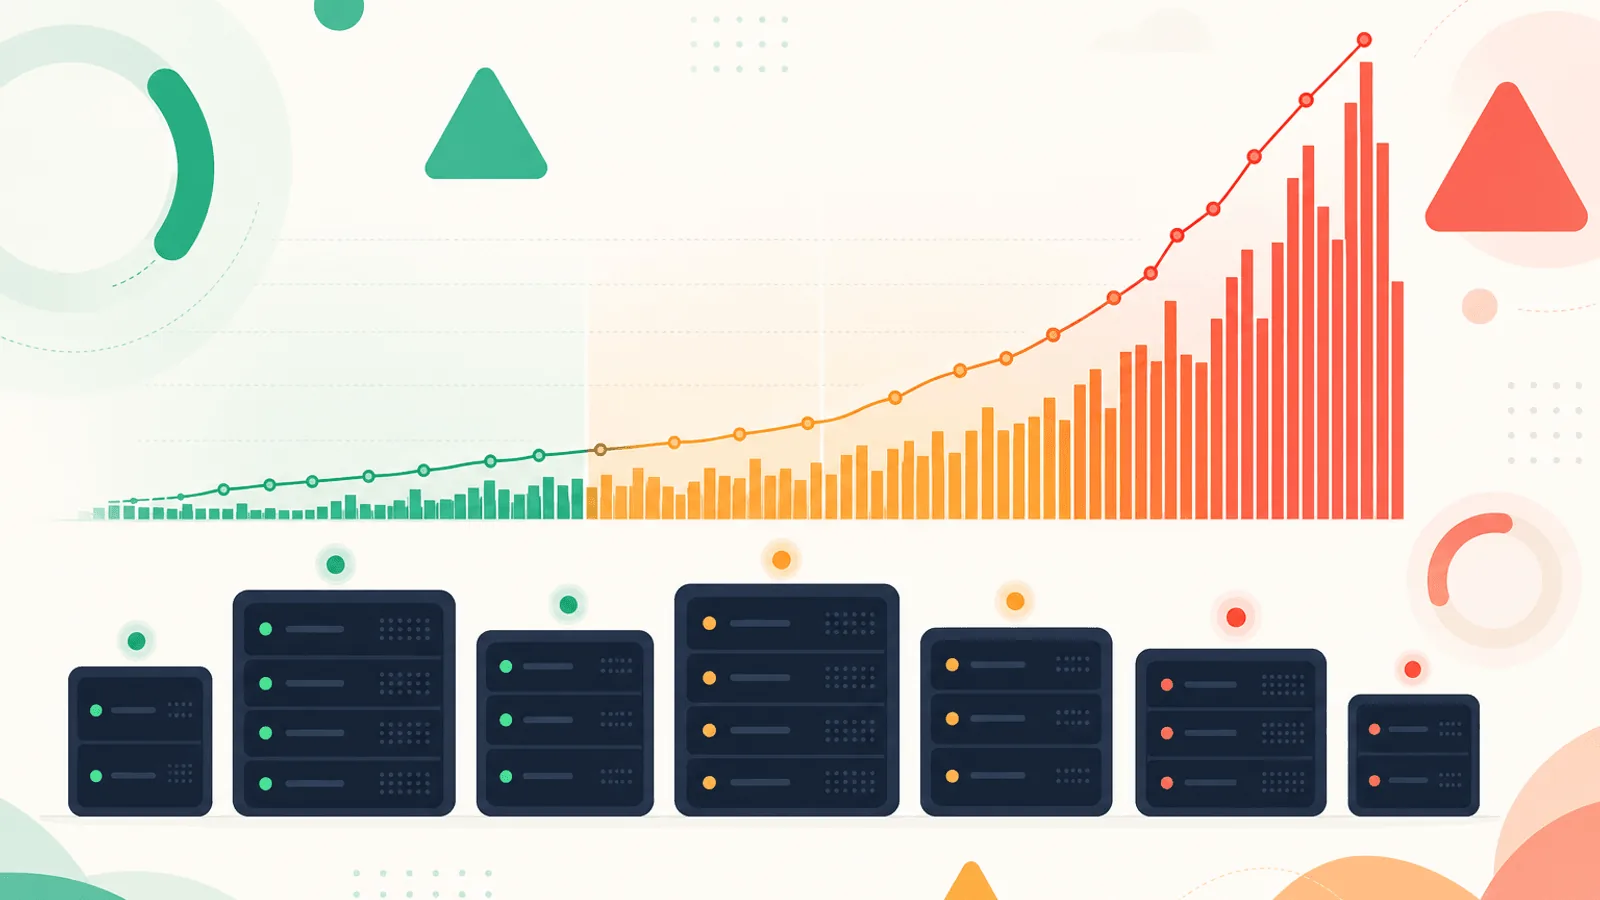
5xx Error Rate Monitoring: Thresholds and Alerting
Monitor 5xx error rates with ratio-based alerts, route and dependency breakdowns, burn-rate context, and an on-call playbook for 500–504 failures.
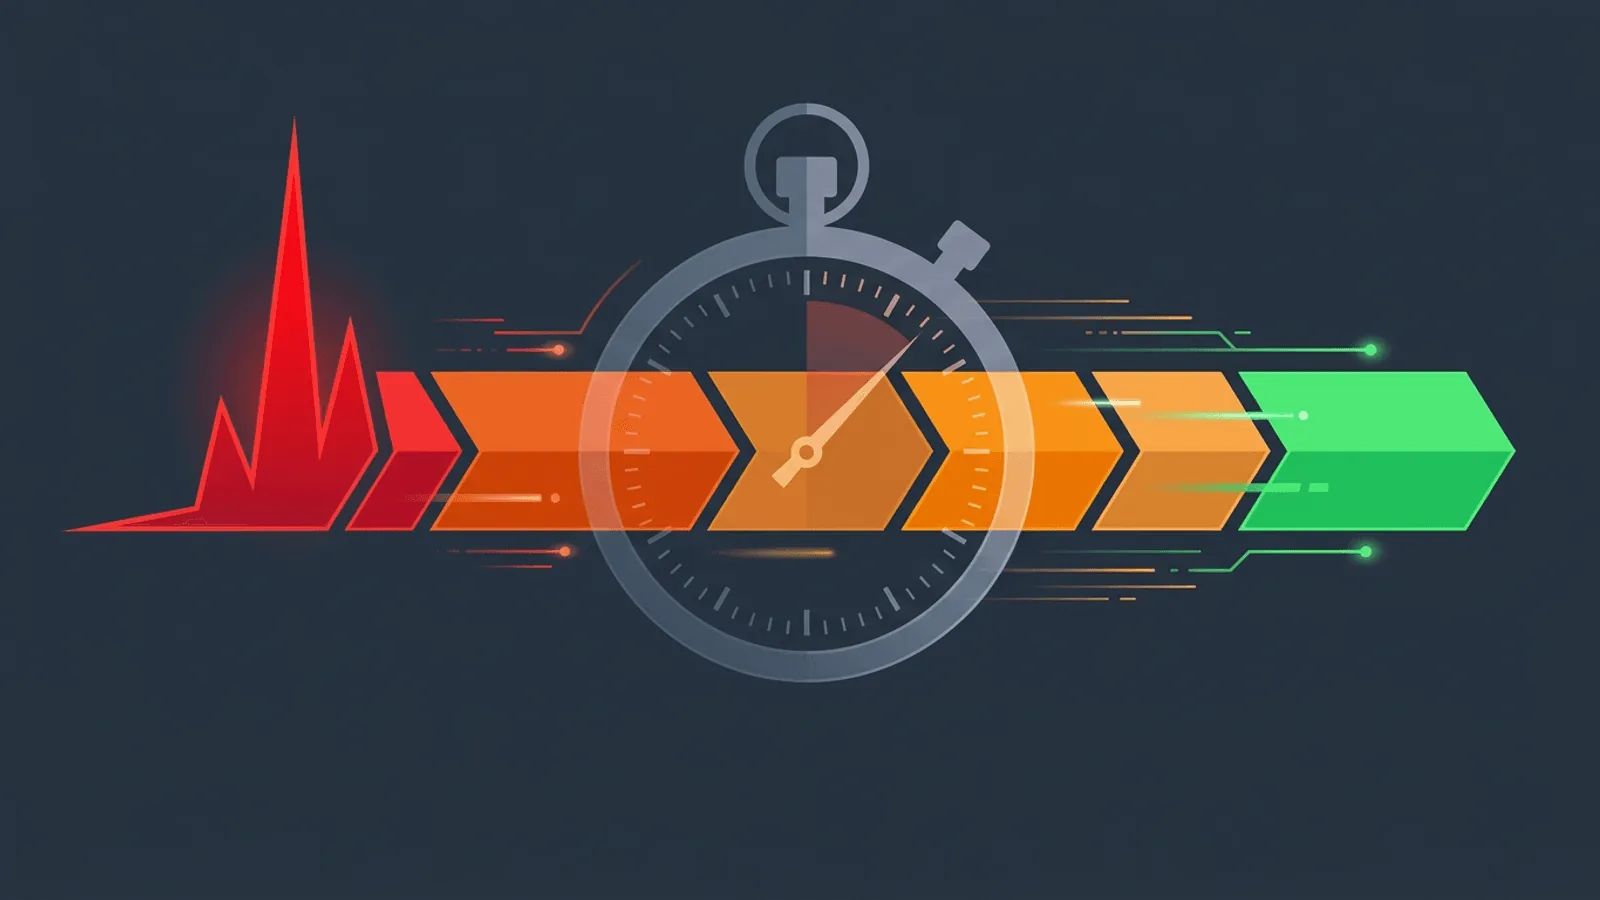
How to Reduce MTTR: A Five-Phase Recovery Plan
Reduce MTTR by measuring detection, acknowledgment, diagnosis, mitigation, and validation separately, then fixing the slowest phase with concrete controls.
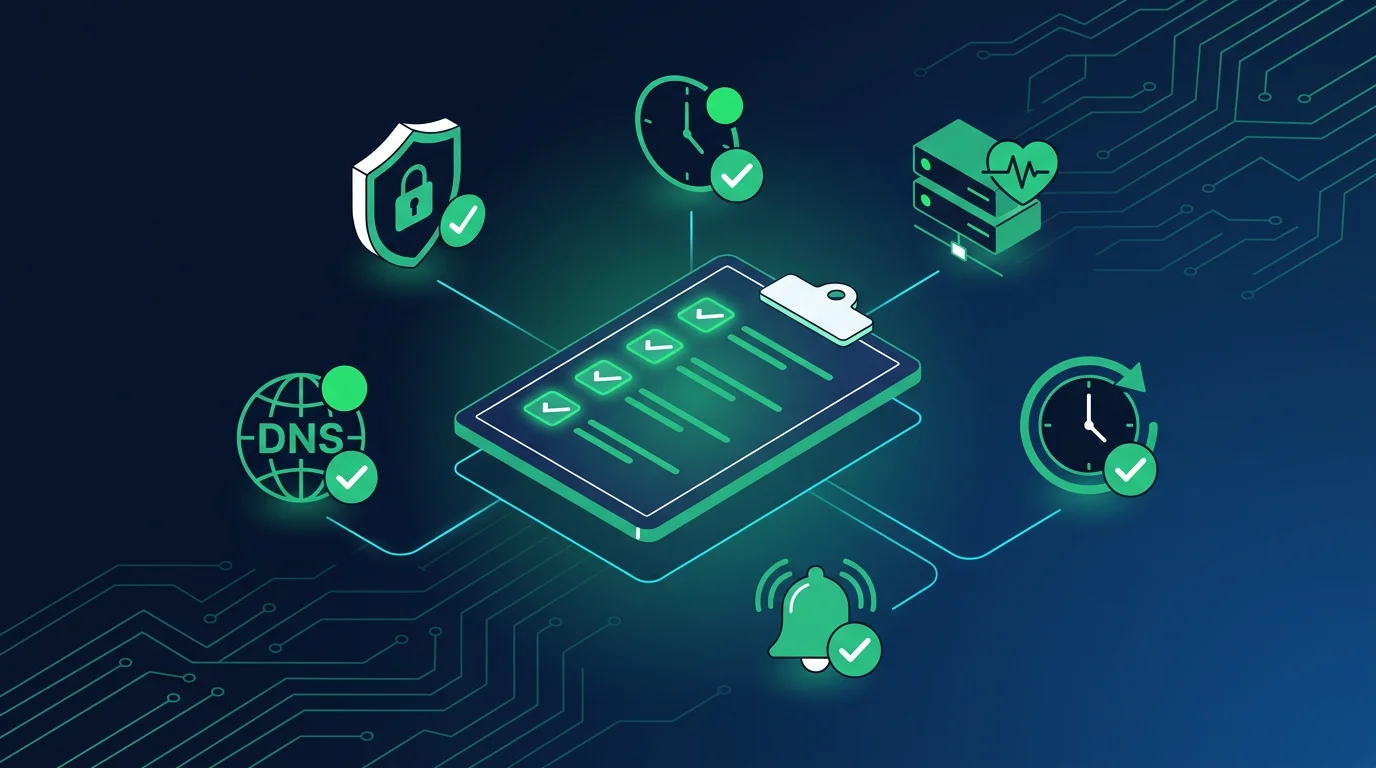
Pre-Outage Website Monitoring Checklist
Use this pre-outage checklist to define critical services, confirm coverage, assign alert owners, test escalation, and prepare incident communication.
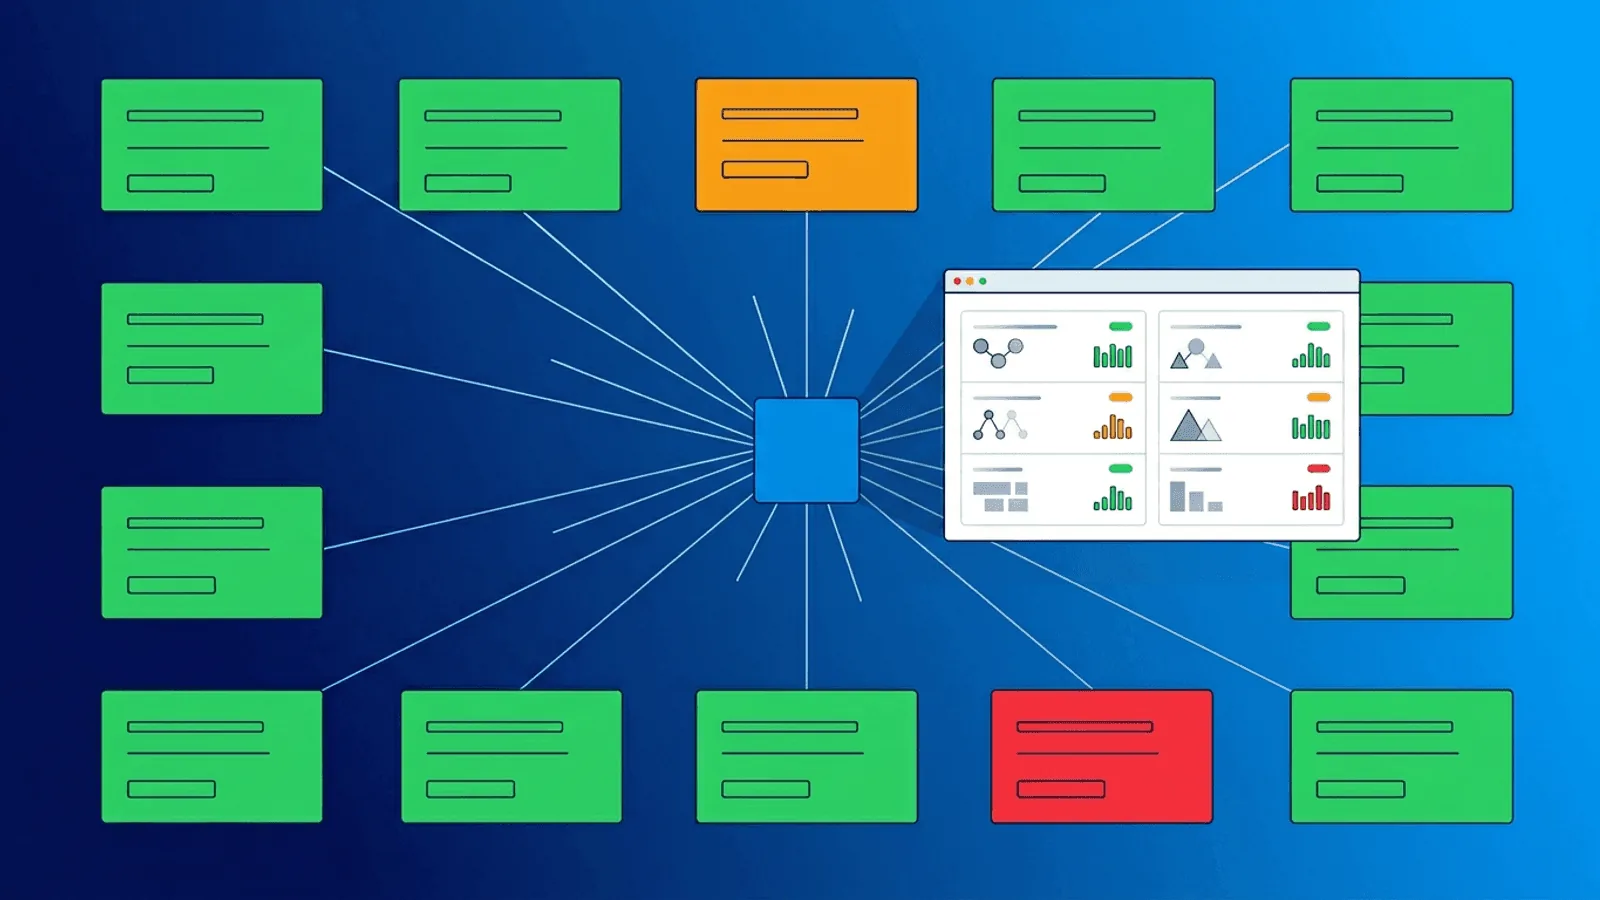
Multi-Tenant SaaS Monitoring: Tenant Health Without Cardinality Chaos
Monitor tenant cohorts, shards, queues, resource isolation, webhooks, SLOs, and noisy neighbors without unsafe endpoints or unbounded metrics.
SLO Monitoring: SLIs, Error Budgets, and Burn Rates
Define user-centered SLIs and SLOs, calculate error budgets and burn rates, configure multi-window alerts, and connect reliability to release policy.
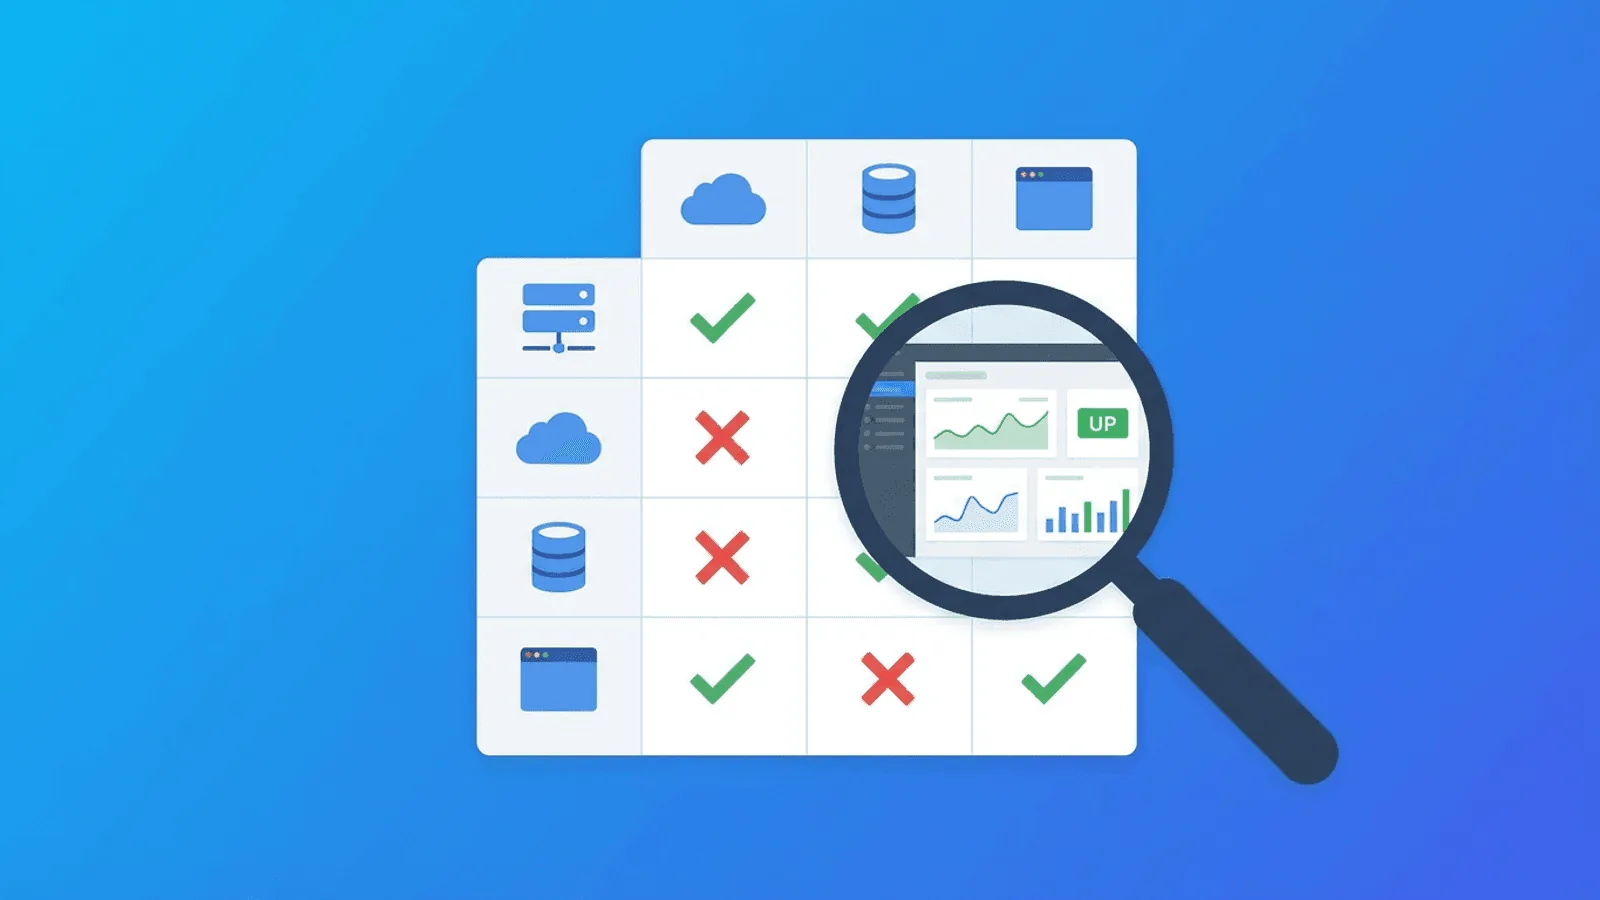
How to Choose a Website Monitoring Tool in 2026
Choose the right URL and website monitoring tool with a practical requirements matrix, pricing model, trial plan, migration checklist, and official sources.
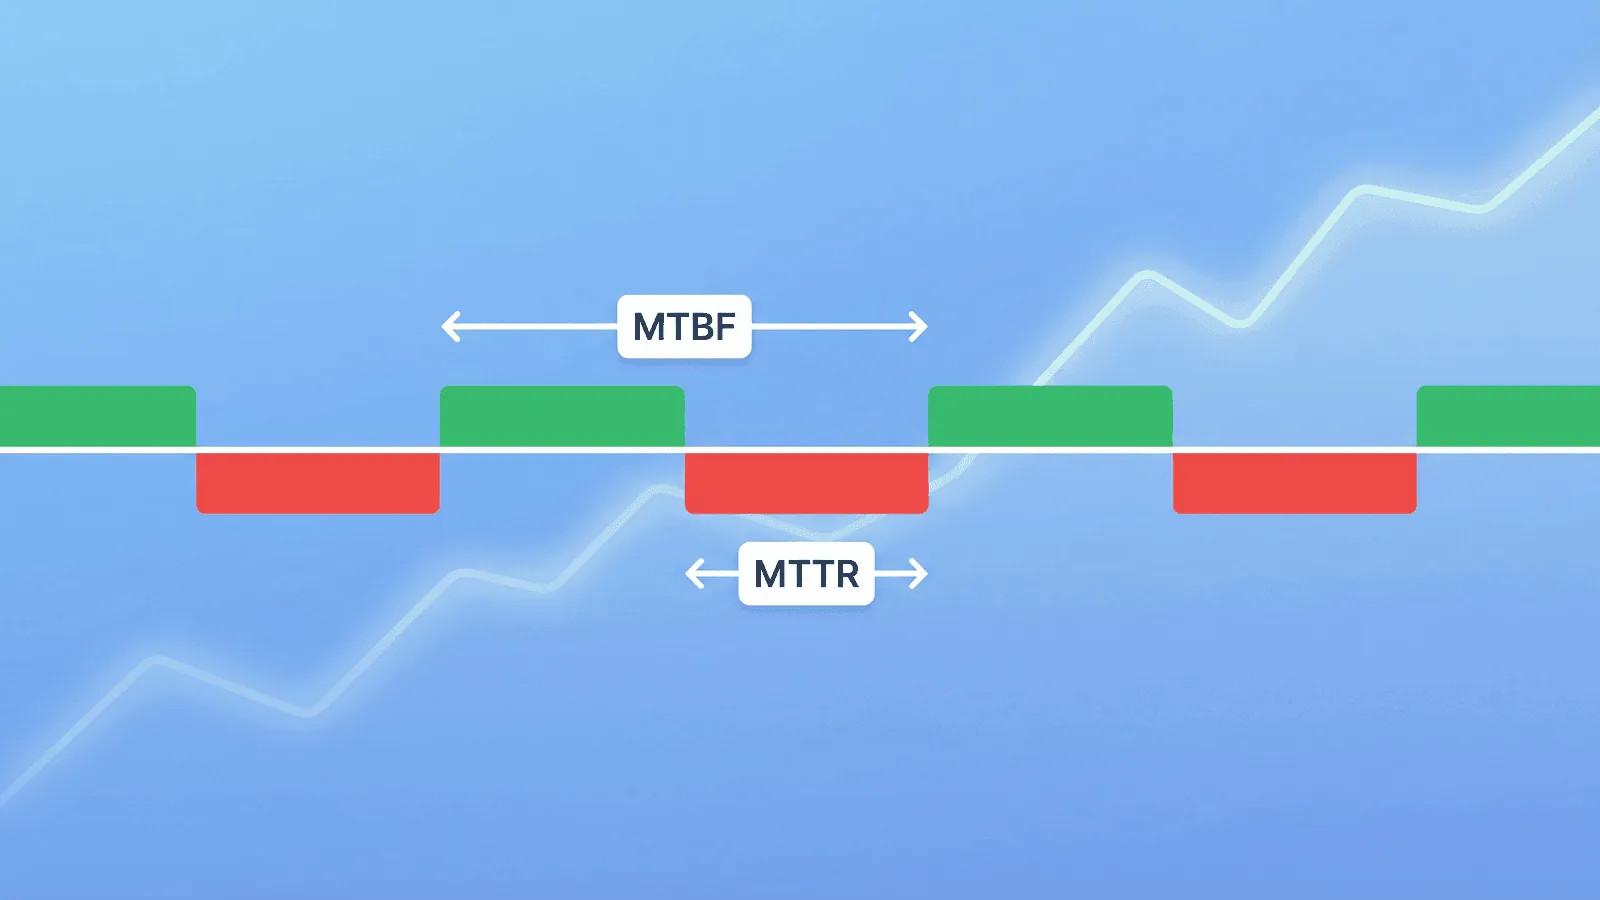
MTTR, MTBF, and MTTF: Definitions and Formulas
Compare MTTR, MTBF, and MTTF with precise time boundaries, formulas, worked examples, repairable versus non-repairable uses, and reporting pitfalls.

How to Prevent Website Outages: Reliability Checklist
Reduce preventable website outages with eight controls for certificates, DNS, capacity, deployments, dependencies, databases, networks, and configuration.
Monitoring for Startups: A Reliability Stack That Grows With You
Build startup monitoring around critical journeys, health checks, jobs, alerts, ownership, SLOs, and incident response without premature complexity.
What Is Uptime Monitoring? A Beginner's Guide
Learn how uptime monitoring checks websites and APIs, confirms failures, sends alerts, measures availability, and differs from performance monitoring.
SLA Downtime Calculator: 99.9% vs 99.99% Downtime in Minutes & Hours
Calculate exact SLA downtime: 99.9% allows 43.8 min/month (8.76 hours/year); 99.99% allows 4.38 min/month. Complete downtime breakdown, formula, and SLA guide.
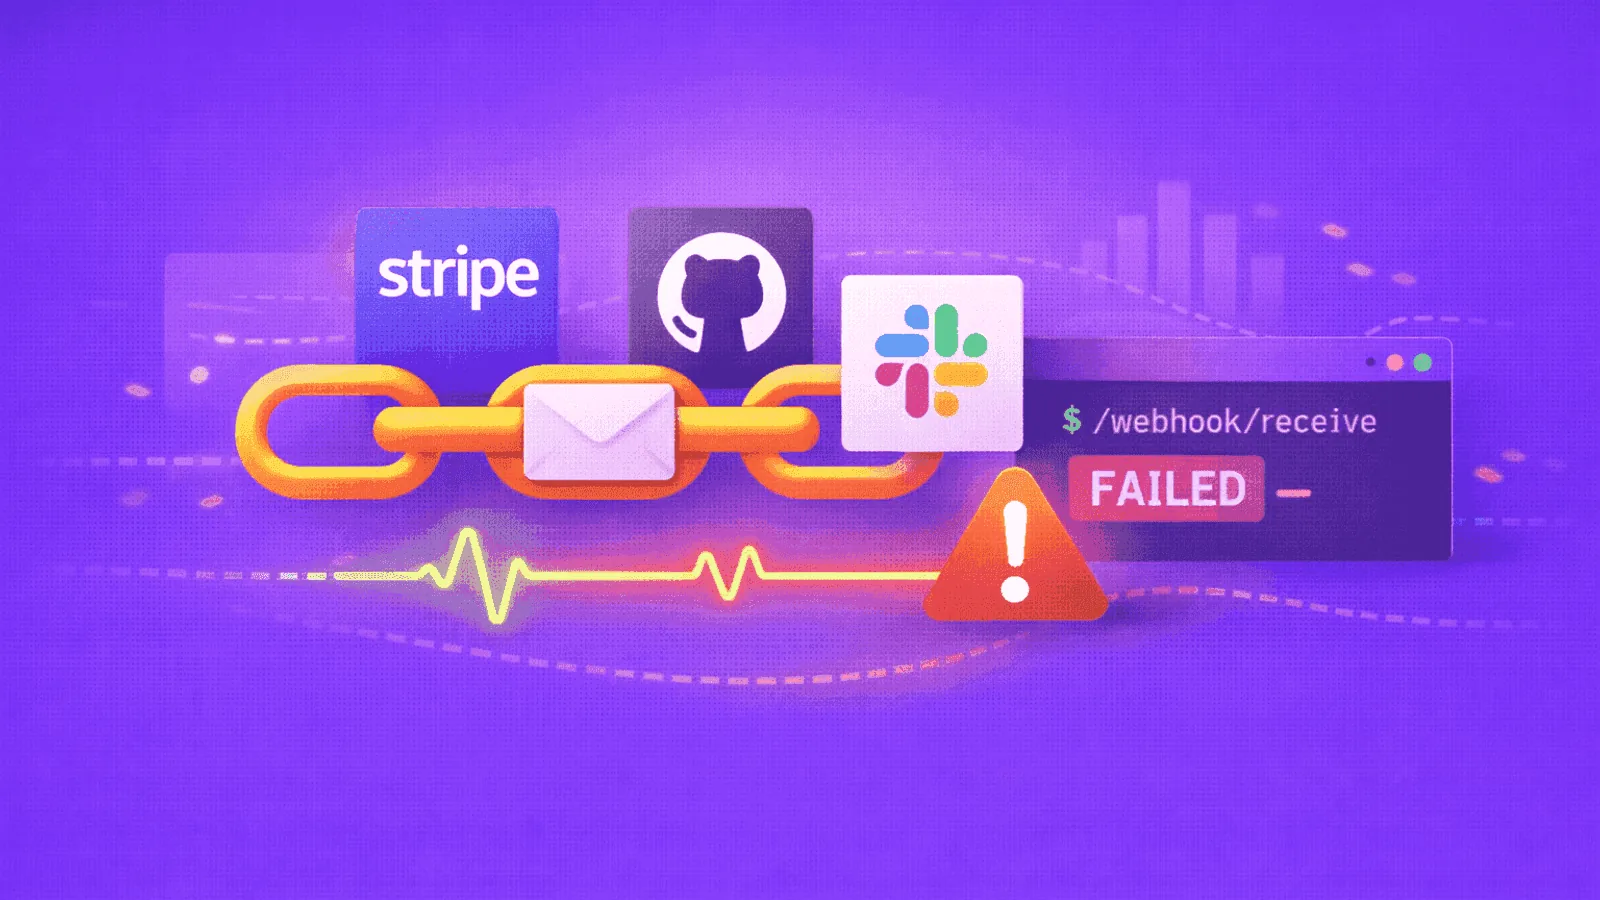
Webhook Monitoring: Delivery, Retries, Failures
Monitor webhook delivery and processing with attempt status, retries, signatures, queue age, reconciliation and dead-letter recovery.
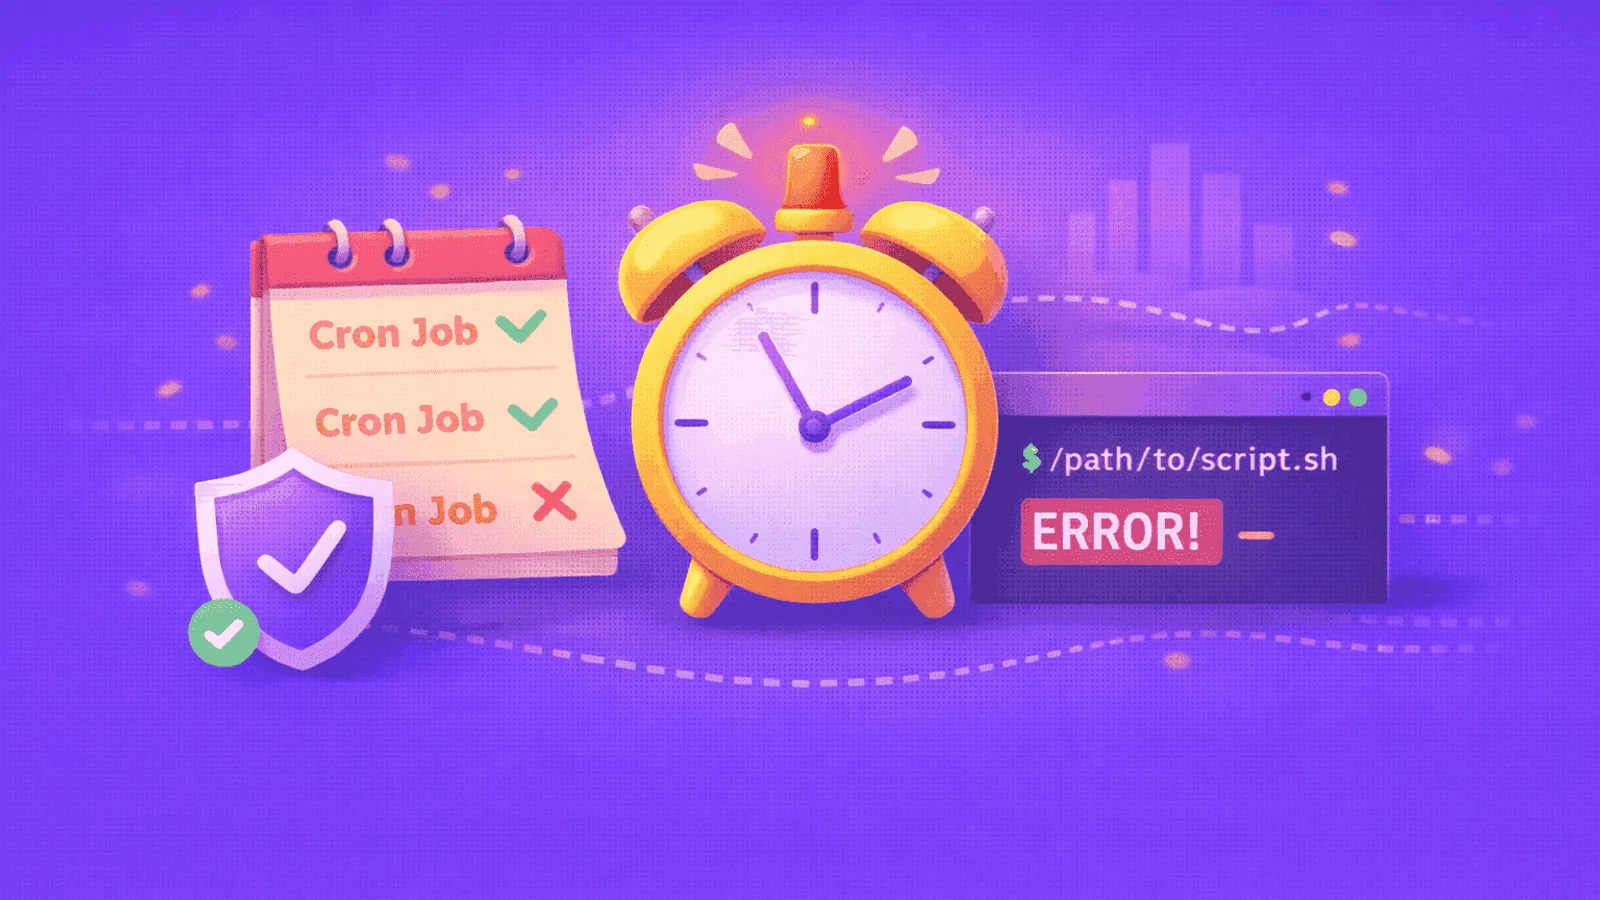
Cron Job Monitoring: Detect Failed, Late, and Missing Background Tasks
Monitor cron jobs and background tasks for missed schedules, failures, duration, retries, and bad output with heartbeats and result checks in production.
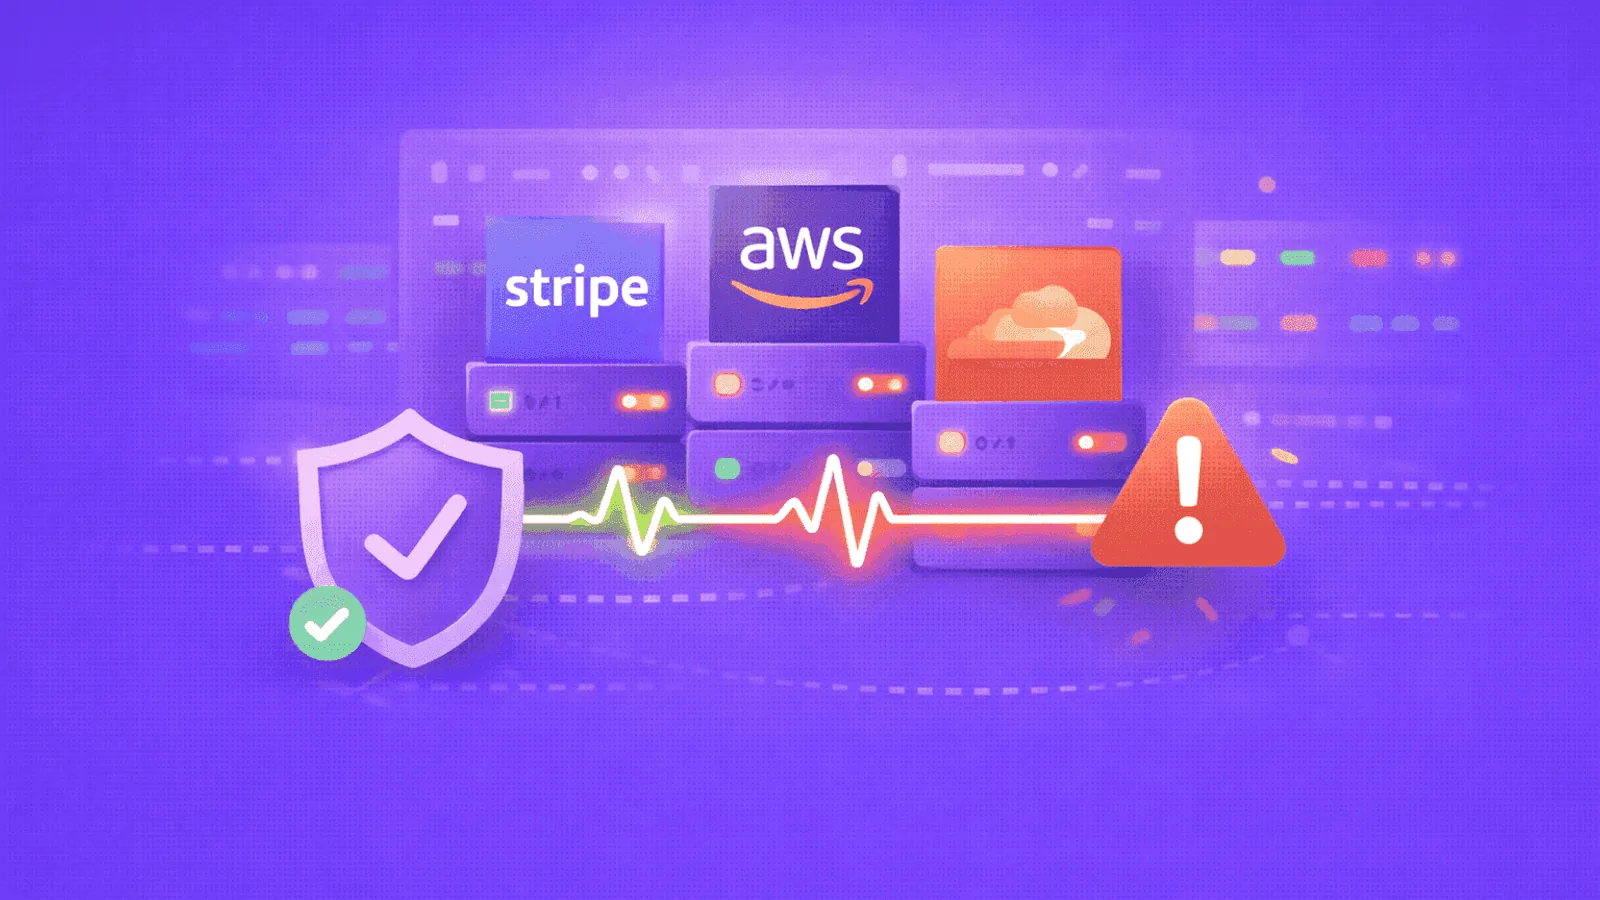
Third-Party Dependency Monitoring: APIs, Auth, and Payments
Inventory and monitor external APIs, authentication, payments, CDNs, email, and storage with integration probes, synthetic journeys, fallbacks, and alerts.
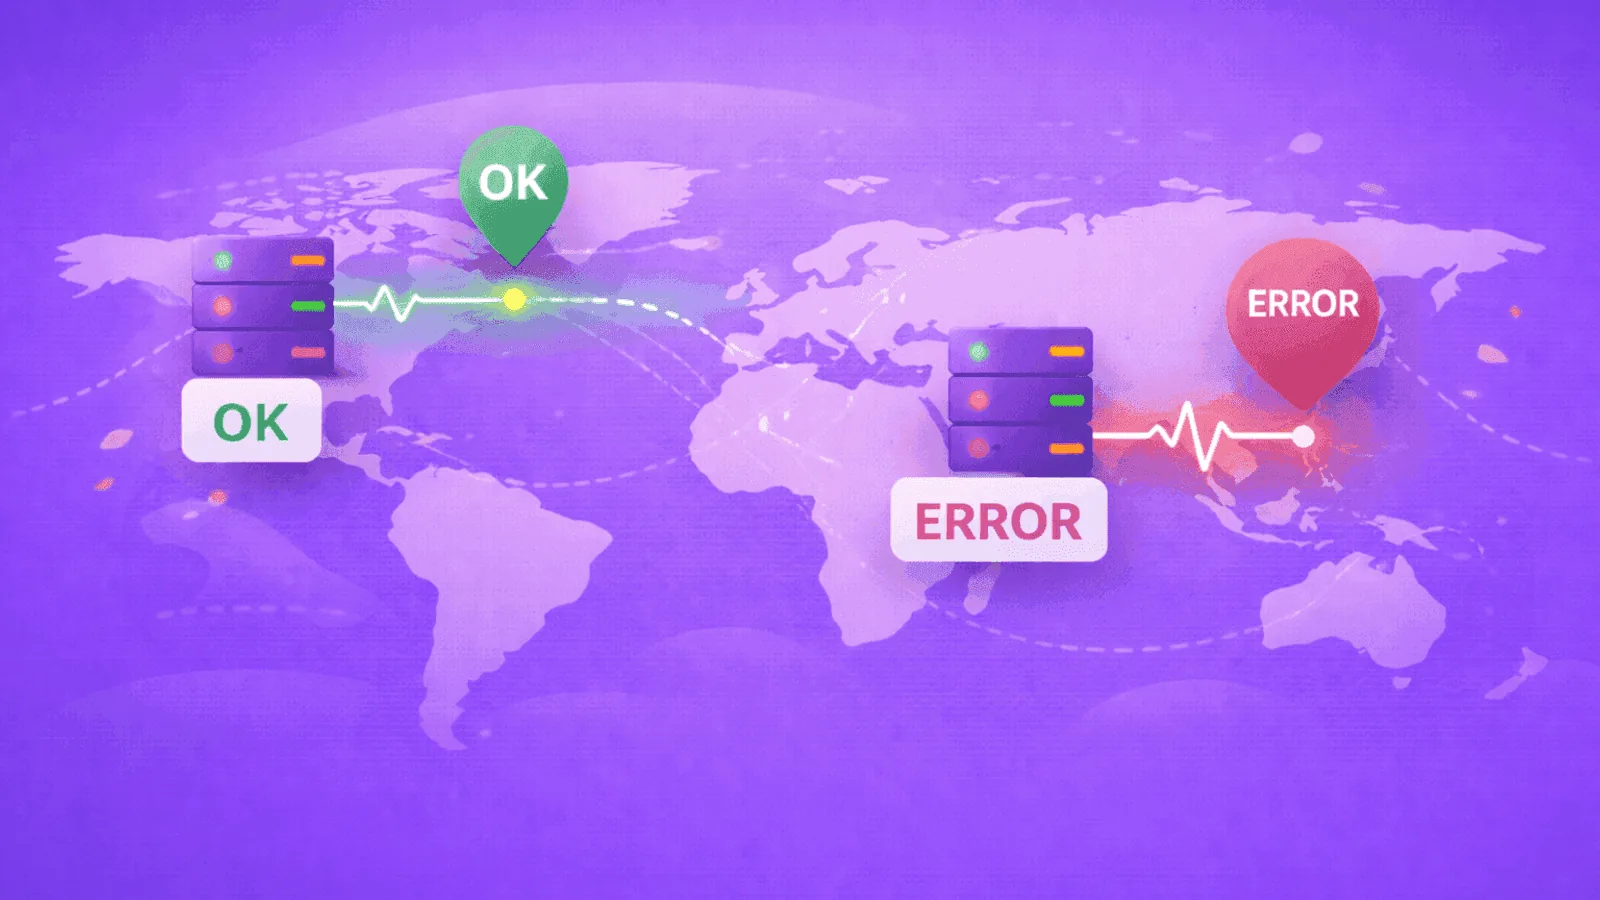
Multi-Region Monitoring: Why Checking From One Location Isn't Enough
Choose probe locations from user traffic, routing, dependencies, and failover design; distinguish regional faults from probe failures with quorum logic.
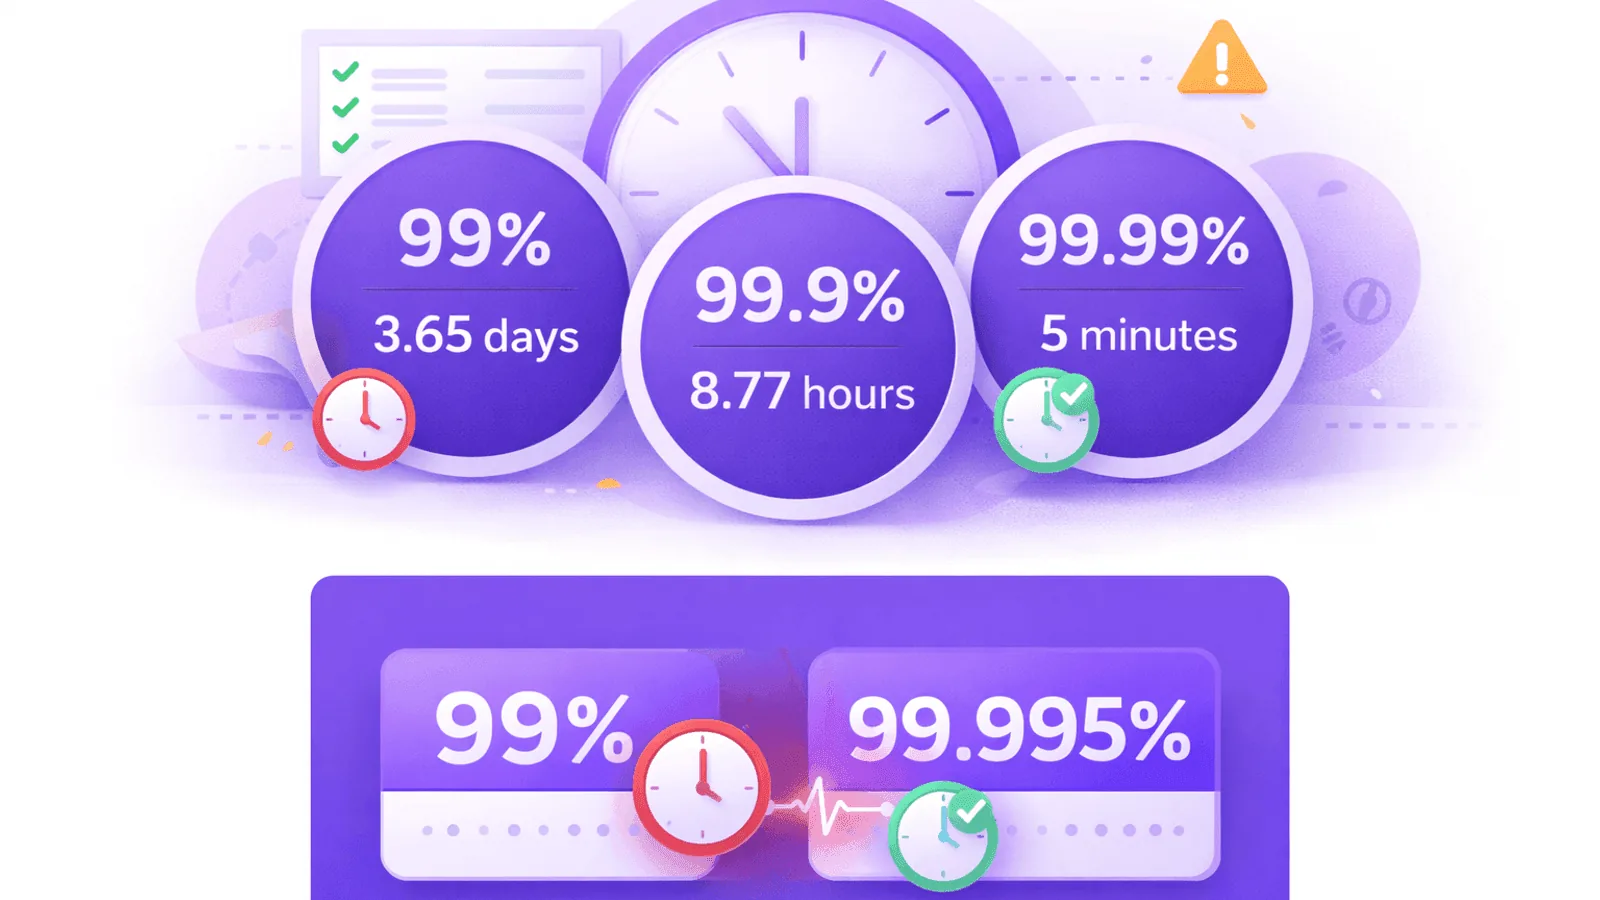
How to Calculate Website Uptime Accurately
Calculate website uptime from incident duration, define what counts as down, handle check intervals and partial failures, and compare results with an SLA.
API Uptime Monitoring and Health Checks Guide
Build API uptime checks that validate critical endpoints, latency, status, content and authentication, with health endpoints and actionable alerts.
DNS Monitoring: Foundation of Website Reliability
Monitor authoritative DNS, resolver answers, record correctness, latency, delegation, and DNSSEC so failures are diagnosed instead of labeled generic downtime.
SaaS Uptime Monitoring: What to Cover From the First Release
Build SaaS uptime monitoring around signup, login, core workflows, APIs, jobs, billing, tenant health, dependencies, alerts, and SLOs.