Your site went down last Tuesday. It was back in 23 minutes. Good or bad?
Without a baseline, you can't answer that question. And without tracking the right metrics over time, you can't tell if your reliability is improving or getting worse.
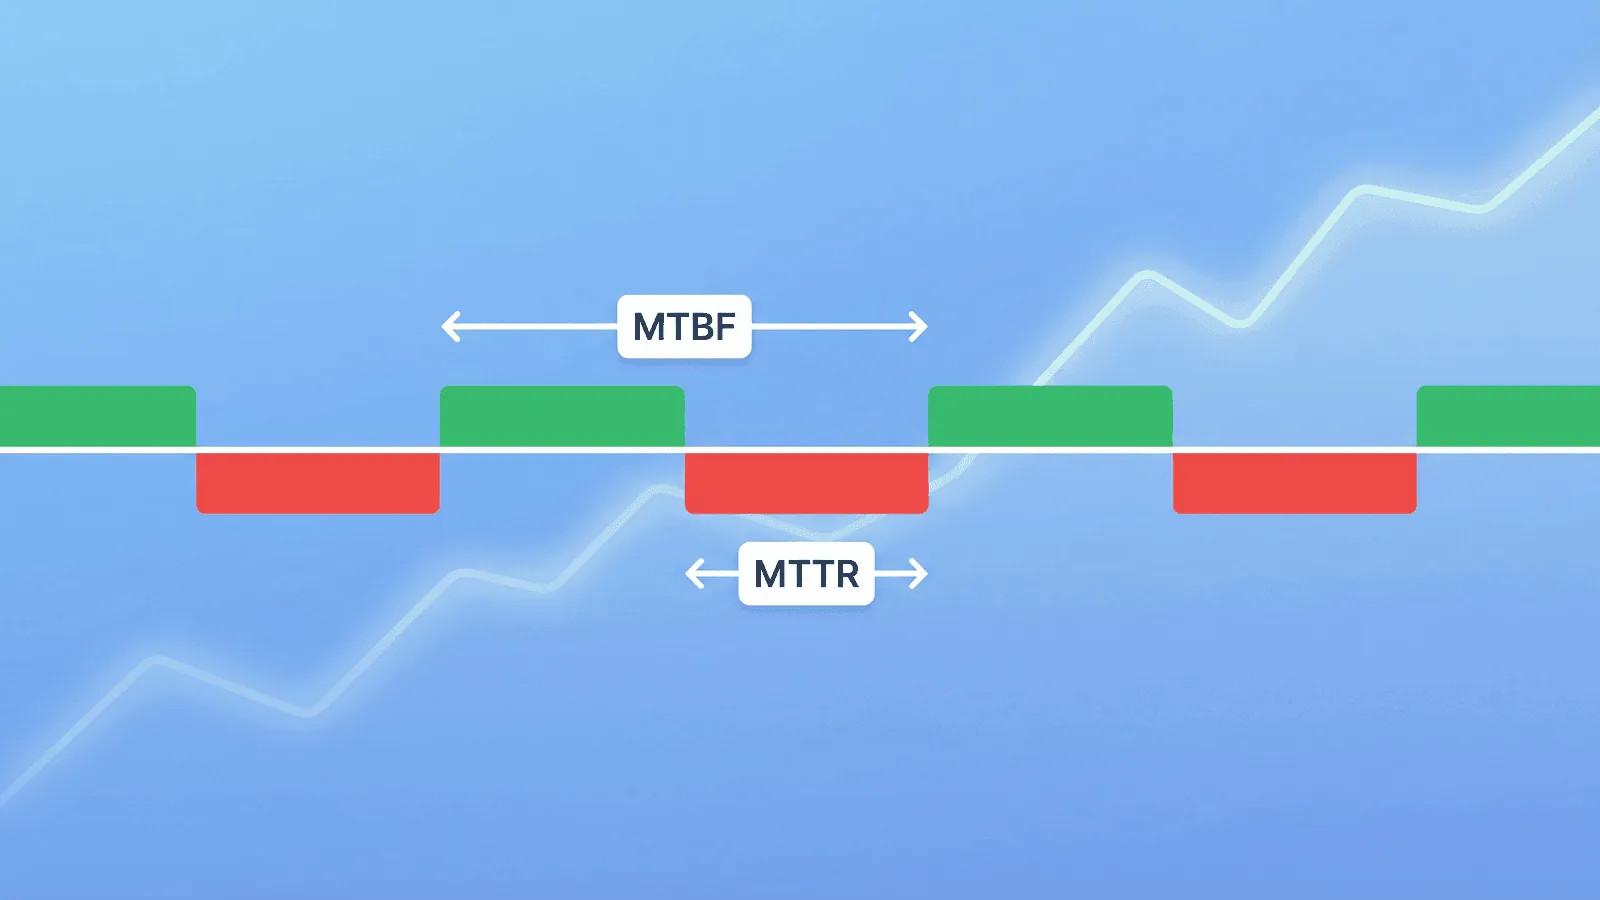
MTTR, MTBF, and MTTF are the three metrics that answer the questions every engineering team needs to ask: How fast do we recover? How often do things break? How long do they last before failing?
This guide explains each metric in plain language, shows you how to calculate them, and covers how they connect to real-world monitoring and incident response.
The Three Metrics at a Glance
| Metric | Stands for | What it measures | Goal |
|---|---|---|---|
| MTTR | Mean Time to Recovery | How long it takes to restore service after a failure | Lower is better |
| MTBF | Mean Time Between Failures | How often failures occur (for repairable systems) | Higher is better |
| MTTF | Mean Time to Failure | How long a non-repairable component lasts before failing | Higher is better |
Think of it this way:
- MTTR = how fast you fix things
- MTBF = how often things break
- MTTF = how long things last
MTTR — Mean Time to Recovery
MTTR is the average time it takes to restore a system or service after a failure. It's the single most actionable reliability metric because it measures your team's ability to detect, respond to, and resolve incidents.
How to calculate MTTR
MTTR = Total downtime / Number of incidents
Example: Over the past quarter, your service had 4 incidents with the following downtimes: 45 minutes, 12 minutes, 30 minutes, and 25 minutes.
MTTR = (45 + 12 + 30 + 25) / 4 = 28 minutes
Your average recovery time is 28 minutes.
What MTTR includes
MTTR covers the full recovery timeline:
- Detection time — How long until you know something is wrong
- Response time — How long until someone starts working on it
- Diagnosis time — How long to identify the root cause
- Resolution time — How long to implement the fix
- Verification time — How long to confirm the fix works
Each phase is an opportunity to improve. If detection takes 15 of your 28 minutes, better monitoring has the biggest impact. If diagnosis takes the longest, better runbooks and observability tools will help more.
What good MTTR looks like
| MTTR | Assessment |
|---|---|
| < 5 minutes | Excellent — automated detection and fast response |
| 5–15 minutes | Good — strong monitoring and practiced incident response |
| 15–60 minutes | Average — room for improvement in detection or diagnosis |
| 1–4 hours | Below average — likely gaps in monitoring or on-call process |
| > 4 hours | Critical — significant process or tooling issues |
How to reduce MTTR
Faster detection:
- Use monitoring with 1-minute check intervals instead of 5 or 10
- Monitor from multiple regions to catch localized failures
- Set up alerts on response time degradation, not just total failure
Faster response:
- Implement on-call rotations so there's always someone responsible
- Use escalation policies — if the first responder doesn't acknowledge in 5 minutes, alert the next person
- Send alerts to push channels (SMS, phone call) not just email or Slack
Faster diagnosis:
- Build health check endpoints that report which specific subsystem is broken
- Use structured logging that makes it easy to search for the root cause
- Maintain runbooks for common failure modes
Faster resolution:
- Automate rollbacks for failed deployments
- Practice incident response so the team knows the drill
- Pre-define communication templates so status updates don't slow you down
MTBF — Mean Time Between Failures
MTBF measures the average time between the end of one failure and the start of the next. It applies to repairable systems — things you fix and put back into service.
How to calculate MTBF
MTBF = Total uptime / Number of failures
Example: Over 30 days (43,200 minutes), your service had 3 incidents. Total downtime was 90 minutes, so total uptime was 43,110 minutes.
MTBF = 43,110 / 3 = 14,370 minutes ≈ 9.98 days
On average, you can expect about 10 days between failures.
MTBF vs. uptime percentage
MTBF and uptime percentage tell different stories:
| Scenario | Uptime | MTBF | What it means |
|---|---|---|---|
| 1 outage of 43 min in 30 days | 99.9% | 30 days | Rare but significant failure |
| 6 outages of 7 min in 30 days | 99.9% | 5 days | Frequent small failures |
Both scenarios have 99.9% uptime, but the reliability experience is very different. MTBF reveals the frequency that uptime percentage hides.
How to improve MTBF
- Fix root causes, not symptoms. If the same failure recurs, your post-incident review isn't leading to real fixes.
- Monitor proactively. Catch degradation (rising response times, intermittent errors) before it becomes a full outage.
- Reduce deployment risk. Use canary deploys, feature flags, and staged rollouts to catch bugs before they affect all users.
- Automate recovery. Auto-restart crashed services, auto-scale during traffic spikes, auto-failover to healthy replicas.
MTTF — Mean Time to Failure
MTTF measures how long a non-repairable component operates before failing. It's most relevant for hardware (hard drives, power supplies, network switches) but also applies to software components that are replaced rather than repaired.
How to calculate MTTF
MTTF = Total operating time / Number of units that failed
Example: You deployed 10 servers. Over 2 years, 2 experienced hardware failure. The first failed at 18 months, the second at 22 months.
MTTF = (18 + 22) / 2 = 20 months
When MTTF matters for web services
For most web applications, MTTR and MTBF are more relevant than MTTF. But MTTF applies when you're thinking about:
- SSL certificates — They have a fixed lifetime (90 days or 1 year). MTTF is literally the certificate validity period.
- Hardware-dependent services — Bare-metal servers, dedicated database hosts.
- Third-party services — You can't "repair" a vendor outage; you either wait or switch providers.
- Software version lifecycle — How long before a dependency reaches end-of-life and must be replaced.
How the Metrics Relate to Each Other
For repairable systems, the three metrics connect:
MTBF = MTTF + MTTR
Or visually:
|←—— MTTF ——→|←— MTTR —→|←—— MTTF ——→|←— MTTR —→|
    Working      Down         Working       Down
|←————————— MTBF ——————————→|
- MTTF is the working period before a failure
- MTTR is the repair/recovery period
- MTBF is the full cycle: working + recovery
In practice, for web services where MTTR is much smaller than MTTF, MTBF and MTTF are nearly equal. A service with 10 days between failures and 30 minutes of recovery time has an MTTF of ~9.98 days and an MTBF of 10 days — functionally the same.
Tracking These Metrics in Practice
Where the data comes from
You need two things to calculate these metrics:
- Incident timestamps — When each incident started and ended
- Total observation period — The time window you're measuring
Monitoring tools provide both. Every time a monitor detects a failure and later detects recovery, that's one incident with a start time, end time, and duration.
How often to measure
- Weekly: Track MTTR for each incident to spot trends early.
- Monthly: Calculate MTBF to see if failure frequency is improving.
- Quarterly: Review all three metrics as part of a reliability review. Compare to previous quarters.
Segmentation matters
Don't calculate a single MTTR across all incidents. Break it down:
- By severity — P1 incidents should have lower MTTR than P3s (faster response for critical issues).
- By service — Your API might have different reliability than your marketing site.
- By root cause — Database issues vs. deployment issues vs. third-party failures.
- By time of day — Incidents during business hours often have faster MTTR than overnight ones.
This segmentation reveals where your process works well and where it needs attention.
Common Mistakes When Using Reliability Metrics
Optimizing MTTR without fixing MTBF
If you're recovering faster but failing just as often, you're firefighting — not improving. The goal is to increase MTBF (fewer failures) while keeping MTTR low (fast recovery when failures happen).
Ignoring detection time in MTTR
Some teams measure MTTR from "engineer starts working" to "service restored." This ignores detection and response time, which are often the biggest portion. True MTTR starts when the incident begins, not when you notice it.
Comparing across different teams or services
A 15-minute MTTR for a simple marketing site and a 15-minute MTTR for a complex distributed payment system are not the same achievement. Compare metrics within the same service over time, not across services.
Using averages without understanding distribution
An average MTTR of 20 minutes might mean "every incident takes about 20 minutes" or "most take 5 minutes but one took 3 hours." Track percentiles (p50, p90, p99) alongside averages to understand the real distribution.
Setting targets without a baseline
Don't set an MTTR target of "under 15 minutes" if you've never measured your current MTTR. Measure first, then set incremental improvement targets.
How Monitoring Improves Every Metric
Monitoring is the foundation of all three metrics:
MTTR improvement
Monitoring directly reduces the detection phase of MTTR — often the longest phase. A 1-minute check interval means you know about a failure within 1-2 minutes instead of waiting for user complaints (which can take 30+ minutes).
| Without monitoring | With monitoring |
|---|---|
| User reports issue (20 min) | Alert fires (1-2 min) |
| Team investigates (15 min) | Engineer responds (5 min) |
| Root cause found (20 min) | Health endpoint shows DB down (1 min) |
| Fix deployed (15 min) | Fix deployed (15 min) |
| Total: 70 min | Total: 22 min |
MTBF improvement
Proactive monitoring catches degradation before it becomes an outage. Rising response times, intermittent errors, and SSL certificates approaching expiry are all early warnings. Fixing these prevents failures, which increases MTBF.
MTTF improvement
Monitoring reveals patterns. If servers consistently fail at 18 months, you know to replace them proactively at 15 months. If SSL certificates expire because auto-renewal failed, monitoring the renewal process prevents the next failure.
How Webalert Helps Track Reliability
Webalert provides the monitoring data that powers these metrics:
- Incident detection with timestamps — Every outage is recorded with exact start and recovery times, giving you the data to calculate MTTR and MTBF.
- 1-minute check intervals — Minimize detection time, the biggest lever for reducing MTTR.
- Multi-region checks — Catch failures faster by detecting them from the closest monitoring location.
- Response time tracking — Spot degradation trends that predict future failures, improving MTBF.
- SSL and DNS monitoring — Prevent entire categories of outages, directly increasing MTTF.
- On-call scheduling and escalation — Reduce response time by ensuring someone is always available.
- Uptime history and reporting — Historical data to calculate and trend all three metrics over time.
See features and pricing for the full details.
Summary
Three metrics, three questions:
- MTTR — How fast do we recover? (Lower is better.)
- MTBF — How often do things break? (Higher is better.)
- MTTF — How long do things last before failing? (Higher is better.)
To improve them:
- Reduce MTTR by monitoring with fast check intervals, setting up on-call rotations, and building health endpoints that pinpoint the broken subsystem.
- Increase MTBF by fixing root causes (not just symptoms), monitoring proactively for degradation, and reducing deployment risk.
- Increase MTTF by monitoring certificate expiry, tracking hardware age, and replacing components before they fail.
The teams that track these metrics improve them. The teams that don't are just hoping things get better.