Your MTTR is 47 minutes. You want it to be 10.
Mean Time to Recovery is one of the most important reliability metrics you track. It measures the average time from when an incident begins to when the service is fully restored. A lower MTTR means less downtime, less customer impact, and less revenue lost.
But "improve MTTR" is not an action. It is an outcome. To actually reduce it, you need to target the specific phases that make incidents take so long — and understand which levers have the most leverage.
This guide covers the five phases of incident recovery and the specific actions that shorten each one.
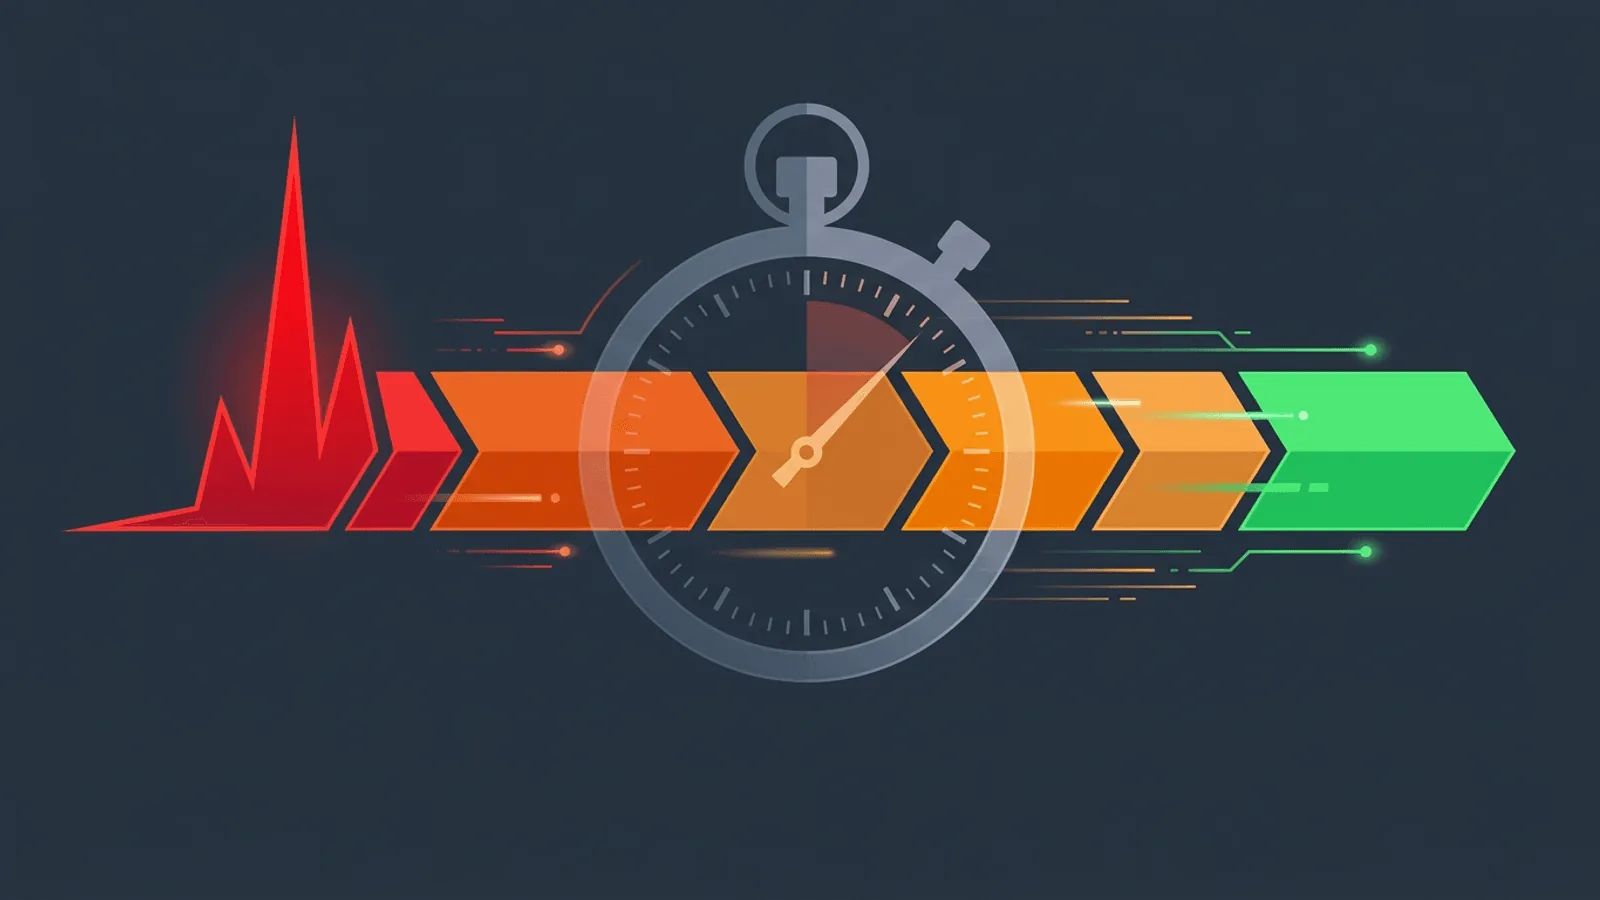
The Five Phases of MTTR
Every incident goes through the same phases. Your total MTTR is the sum of time spent in each:
MTTR = Detection + Acknowledgment + Diagnosis + Fix + Validation
| Phase | What Happens | Time Driver |
|---|---|---|
| Detection | The system discovers something is wrong | Monitoring check interval and alert routing |
| Acknowledgment | Someone accepts the alert and starts working | Alert channel, escalation policy, on-call setup |
| Diagnosis | The team identifies the root cause | Runbook quality, observability, alert context |
| Fix | The team deploys a fix or rollback | Deployment speed, permissions, rollback tooling |
| Validation | The team confirms the service is restored | Monitoring coverage, post-incident checks |
Most teams focus exclusively on the Fix phase. In practice, Detection and Diagnosis often account for more than half of total MTTR. A faster fix helps nothing if it takes 30 minutes to detect the incident and another 20 to diagnose it.
Phase 1: Detection — Stop Finding Out From Customers
The longest phase in most MTTR calculations is detection. Teams frequently learn about incidents from customer reports, social media, or manual checks — not from automated alerts.
What drives detection time:
- Monitoring check intervals (every 5 minutes vs. every 1 minute)
- What is being monitored (homepage only vs. all critical paths)
- Alert routing (goes to a Slack channel nobody watches vs. wakes up the on-call person)
How to reduce detection time:
1) Use 1-minute check intervals. A 5-minute interval means you might not detect an incident for up to 5 minutes after it starts. Most tools require 2-3 consecutive failures before alerting, which means a 5-minute check can have an 8-15 minute detection window. A 1-minute check reduces this to 2-3 minutes.
2) Monitor beyond the homepage. The homepage is not what breaks most often. Monitor:
- API endpoints
- Authentication flows
- Payment processing paths
- Background job health via heartbeats
- Database and cache connectivity via health endpoints
3) Monitor from multiple regions. A regional failure may not affect your monitoring check location. Multi-region checks catch geographically limited incidents that single-location monitoring misses.
4) Use content validation, not just status codes. A service can return HTTP 200 while serving an error page, stale content, or broken UI. Content validation catches these cases.
Target: Detection time under 3 minutes.
Phase 2: Acknowledgment — Get the Right Person Immediately
After detection, the alert needs to reach someone who can act on it.
What drives acknowledgment time:
- Alert going to the wrong channel (email nobody reads at 2 AM)
- No on-call rotation (everyone expects someone else to handle it)
- Alert noise causing fatigue (people ignore alerts because too many are false positives)
- No escalation policy (if the primary person does not respond, nobody else is notified)
How to reduce acknowledgment time:
1) Use SMS and phone calls for critical alerts. Email is not a reliable real-time alert channel. Critical service alerts should go to SMS, phone call, or a push notification to the on-call person's phone.
2) Define on-call rotations clearly. Every critical service should have a named on-call person at all times. Rotating schedules with clear handoffs eliminate the "I thought you were handling it" problem.
3) Configure escalation policies. If the primary on-call person does not acknowledge within 5 minutes, escalate to a secondary. If they do not respond in 10 minutes, escalate to the engineering manager.
4) Reduce alert noise. Alerts that fire frequently for non-issues teach people to ignore alerts. Require 2-3 consecutive failures before alerting to eliminate transient flaps. Each alert should be actionable.
5) Route to the right team. Infrastructure alerts should go to infrastructure engineers. Database alerts should go to the database team. Routing to a single general channel ensures the wrong person tries to debug an unfamiliar system.
Target: Acknowledgment time under 5 minutes.
Phase 3: Diagnosis — Know What Broke in Minutes, Not Hours
Diagnosis is where most incidents spend the most time. Teams start from scratch every incident, debugging with insufficient context.
What drives diagnosis time:
- No runbook — team invents the investigation process each time
- Insufficient alert context — alert says "site down" with no additional information
- No single source of truth — logs are in one place, metrics in another, deployments in a third
- No historical baseline — no way to know if current behavior is normal
How to reduce diagnosis time:
1) Include context in every alert. Every alert should include:
- What failed (the specific endpoint or check that triggered the alert)
- For how long (when the failure started)
- Recent changes (last deployment, config change)
- A direct link to the relevant runbook
2) Write runbooks for every alert. A runbook transforms diagnosis from "figure it out" to "follow the steps." It should include:
- What this alert means
- First 3 things to check
- Common causes and their fixes
- Escalation path if the runbook does not resolve it
3) Set up a post-deploy monitoring baseline. When you know what "normal" looks like (response time, error rate, throughput), diagnosis is fast: compare current behavior to baseline and find what changed.
4) Maintain a deployment timeline. Every alert dashboard should show recent deployments. "What changed recently?" is the first question in every incident. The answer should be visible without asking.
5) Use multi-region check data. If 3 out of 5 regions are failing but 2 are healthy, that is a different problem than if all 5 are failing. This context narrows the diagnosis immediately.
Target: Diagnosis time under 10 minutes for known incident types.
Phase 4: Fix — Deploy Changes Faster and Safer
Once the cause is identified, the fix needs to be deployed. This phase is largely determined by your deployment infrastructure, not monitoring.
What drives fix time:
- Slow deployment pipelines
- No rollback capability
- Insufficient permissions (fix is ready but needs approval to deploy)
- Complex fixes with cascading dependencies
How monitoring helps:
1) Validate fixes quickly. After deploying a fix, monitoring confirms whether it worked within 1-2 minutes. Without monitoring, teams wait and check manually, adding 5-10 minutes to every fix validation cycle.
2) Post-deploy validation gates. Make deployment pipelines ping a health endpoint after deploy. Automated validation catches broken deploys before they cause incidents — reducing both incident frequency and fix cycle time.
3) Rollback detection. When a rollback is deployed, monitoring confirms the rollback succeeded and the service is stable. This closes the feedback loop quickly.
Target: Fix deployment under 10 minutes with rollback capability.
Phase 5: Validation — Confirm Recovery Is Complete
Many teams close incidents too early. The service appears to be working, the alert clears, and everyone moves on. Then the same issue recurs, or a related issue surfaces, because the validation was insufficient.
How to reduce validation time while ensuring completeness:
1) Check the original alert is cleared. Obvious, but missed more often than you would expect. Verify the monitoring check that triggered the incident is now passing.
2) Validate from multiple regions. If the fix was deployed to one region, verify other regions are not affected.
3) Check dependent services. If service A failed, verify that services B and C that depend on A are also healthy after the fix.
4) Monitor for 15-30 minutes before declaring resolution. Brief monitoring after a fix catches immediate regressions. A service that flaps (recovers then fails again) needs additional investigation.
5) Update the status page. When validation is complete, update the status page and communicate resolution to customers. This reduces incoming support volume and closes the customer-facing incident.
Target: Validation time under 10 minutes.
Measuring MTTR Over Time
You cannot improve what you do not measure. Track MTTR per incident and trend it over time.
| Metric | Measurement | Frequency |
|---|---|---|
| MTTR by service | Avg recovery time per service | Monthly |
| MTTR by incident type | Avg recovery time for specific failure patterns | Quarterly |
| Detection time | Time from incident start to first alert | Per incident |
| Phase breakdown | Time in each of the 5 phases | Per incident |
| Runbook usage | Did the team use a runbook? Did it help? | Per incident |
Review MTTR in every post-mortem. Identify which phase contributed most to total time, and address the root cause of that phase.
Quick Wins for Reducing MTTR
If you need to reduce MTTR quickly, these changes have the highest impact per effort:
- Switch to 1-minute check intervals — Immediately reduces detection window
- Enable SMS/phone call alerts — Eliminates the "missed the email at 3 AM" scenario
- Add a
/healthendpoint to every service — Enables faster diagnosis of internal state - Write one runbook per common alert type — Reduces diagnosis time for known failures
- Add deployment markers to dashboards — Answers "what changed?" immediately
- Enable multi-region checks — Catches regional failures that single-location monitoring misses
How Webalert Helps
Webalert reduces MTTR at the detection and validation phases:
- 60-second check intervals — Minimize detection window to under 3 minutes
- Content validation — Catch cases where service is up but broken
- Multi-region checks — Detect and confirm recovery globally
- SMS and multi-channel alerts — Immediate notification via Email, SMS, Slack, Discord, Teams
- Heartbeat monitoring — Detect background service failures proactively
- Response time tracking — Fast baseline comparison during diagnosis
- Status pages — Close the customer communication loop during incidents
- Historical data — Track MTTR trends over time
See features and pricing for details.
Also see our related post on MTTR, MTBF, and MTTF explained and post-incident monitoring checklist.
Summary
- MTTR = Detection + Acknowledgment + Diagnosis + Fix + Validation. Most improvements come from the first three phases, not the fix.
- Reduce detection time with 1-minute check intervals, content validation, and multi-region checks.
- Reduce acknowledgment time with SMS alerts, clear on-call rotations, and escalation policies.
- Reduce diagnosis time with runbooks, alert context, deployment timelines, and health endpoints.
- Measure MTTR per phase in every post-mortem to identify where time is actually being lost.
- Quick wins: 1-minute checks, SMS alerts, health endpoints, one runbook per alert type.
Faster detection and better context are worth more than a faster fix.