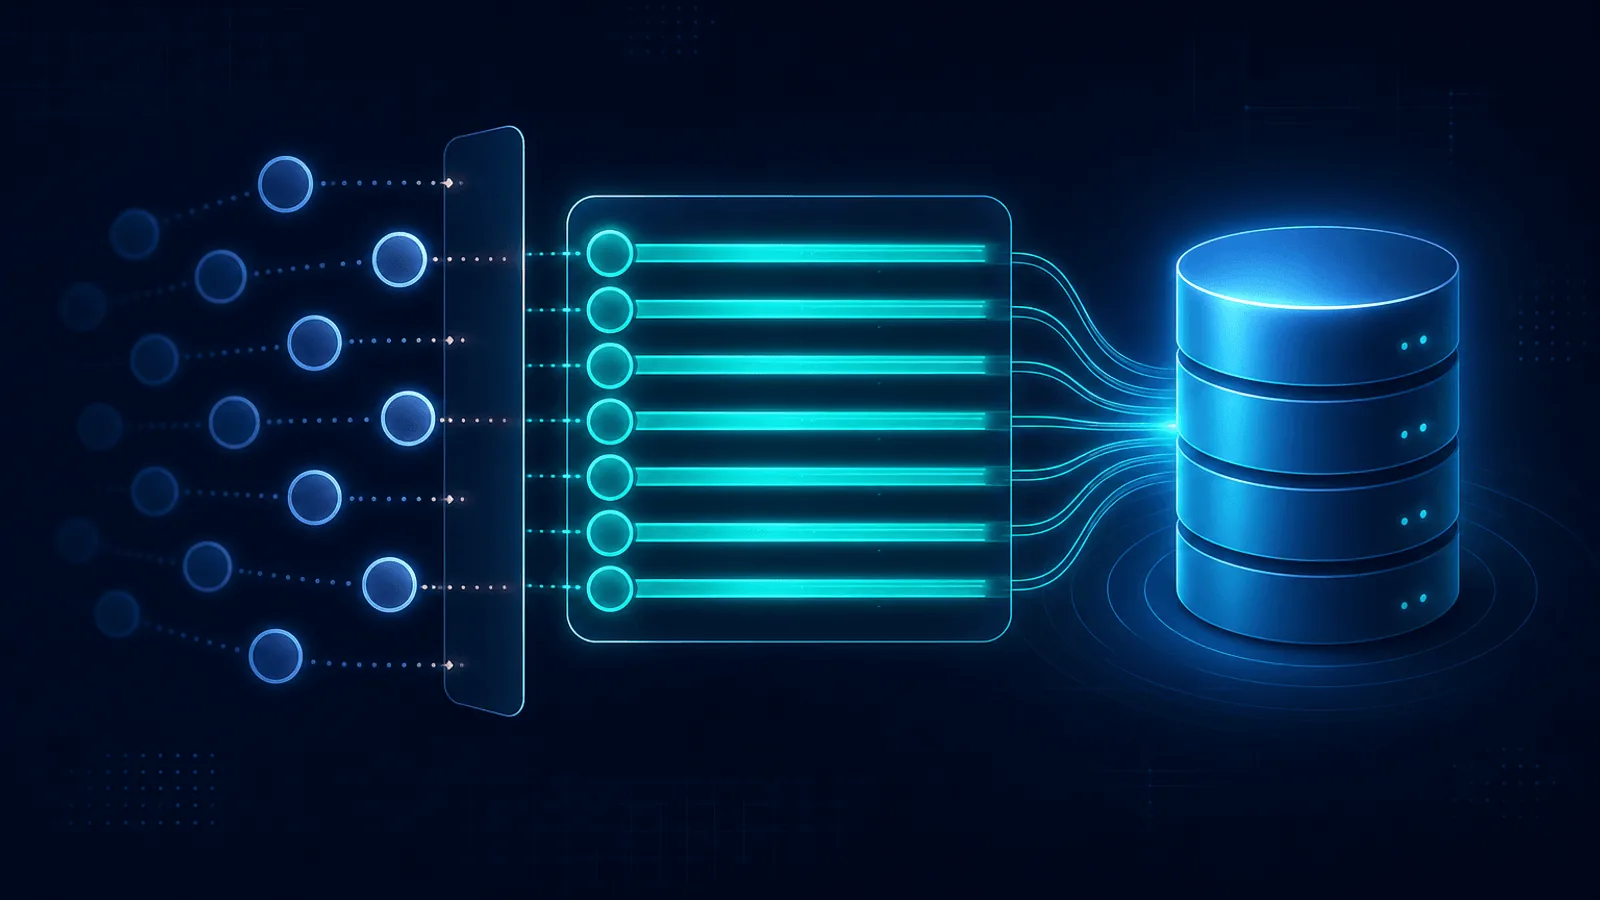
Database Connection Pool Exhaustion: Causes and Fixes
Why apps hit 'too many connections', how connection pool exhaustion happens, and how to diagnose, size, and fix it before it takes your database down.
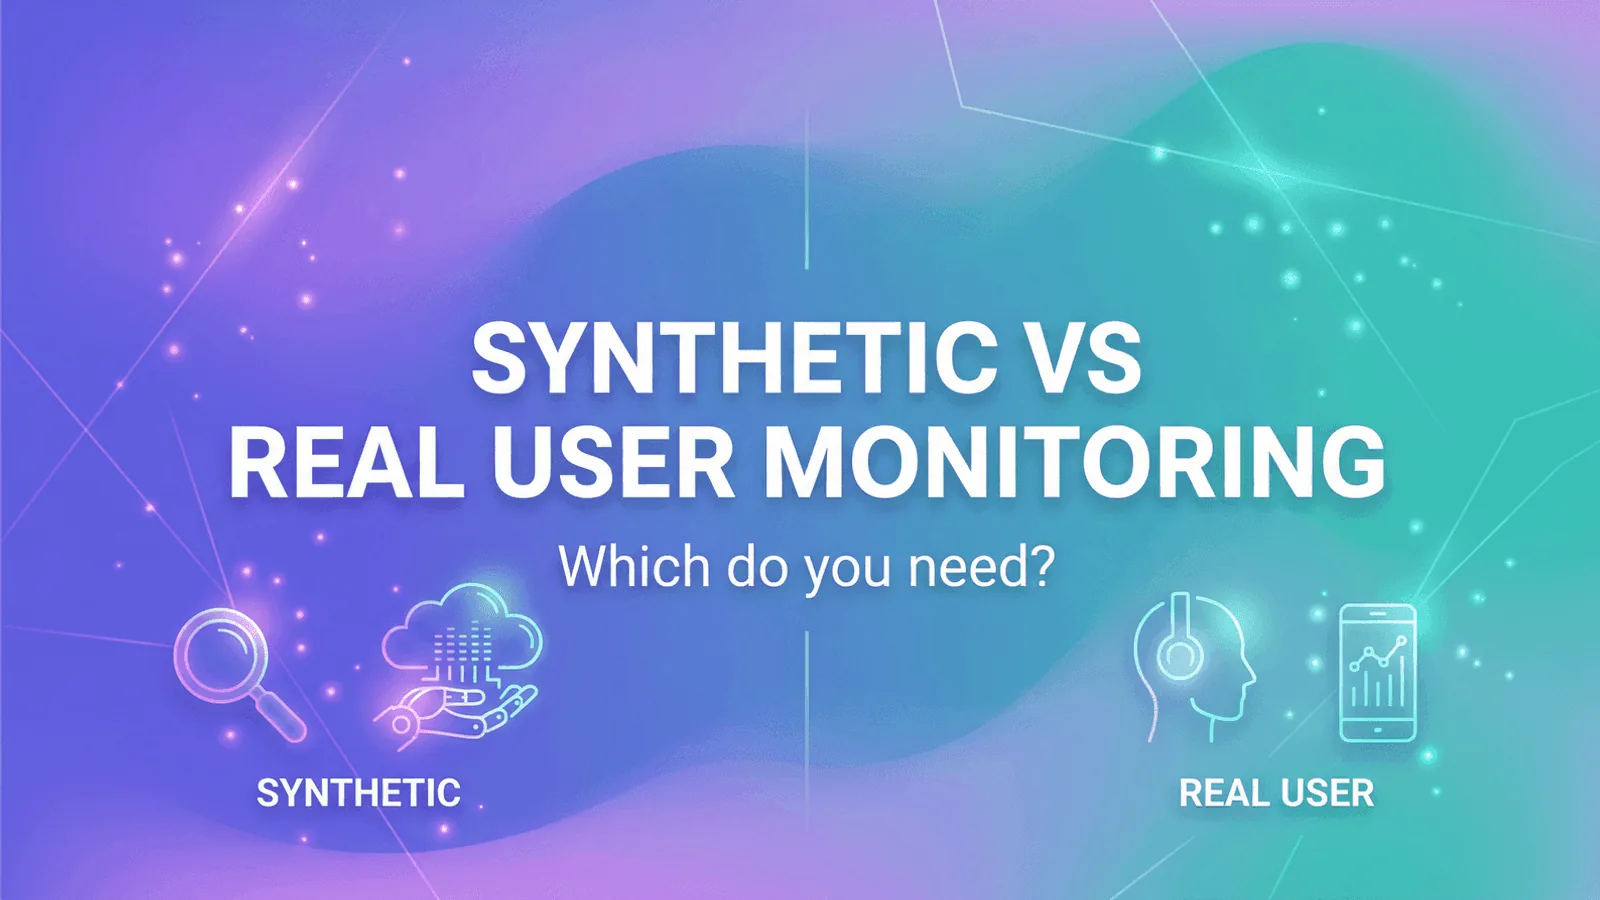
Synthetic Monitoring vs Real User Monitoring (RUM): Key Differences
Synthetic monitoring vs RUM: which catches downtime first, which measures real user experience, and when to use one, the other, or both. Complete comparison guide.

Apdex Score Explained: Measuring App Performance Satisfaction
What Apdex is, how the score is calculated from satisfied, tolerating and frustrated requests, how to set the T threshold, and where Apdex helps or misleads.

HTTP/3 & QUIC Monitoring: What Changes and What to Watch
How HTTP/3 and QUIC change monitoring: UDP 443, 0-RTT, connection migration, fallback to HTTP/2, and the new failure modes and metrics you must watch.

Latency Percentiles Explained: p50, p95, p99 & Why Averages Lie
Understand p50, p95, p99 and p99.9 latency percentiles, why averages hide outages, how to set SLOs on tail latency, and how to alert on the right number.

ActiveRecord Monitoring: N+1, Slow Queries & Pool Exhaustion
Detect ActiveRecord N+1 queries, slow SQL and pool exhaustion in Rails. Bullet, Prosopite, pg slow logs, Sidekiq pool sizing, and HTTP latency as canary.

Real User Monitoring (RUM) Explained: How It Works & When to Use It
RUM explained from first principles: what it measures, how it captures Core Web Vitals, beacons, sampling, privacy, when to use it and when synthetic wins.

Redirect Chain Monitoring: Broken 301s, Loops & SEO Loss
Monitor redirect chains for broken 301s, infinite loops, and SEO equity loss. Catch migration regressions and hop-count drift before traffic drops.

MySQL Production Monitoring: Slow Queries, Replication, Locks
Monitor MySQL in production. Performance Schema, slow query log, InnoDB buffer pool, replication lag, deadlocks, and alert thresholds.
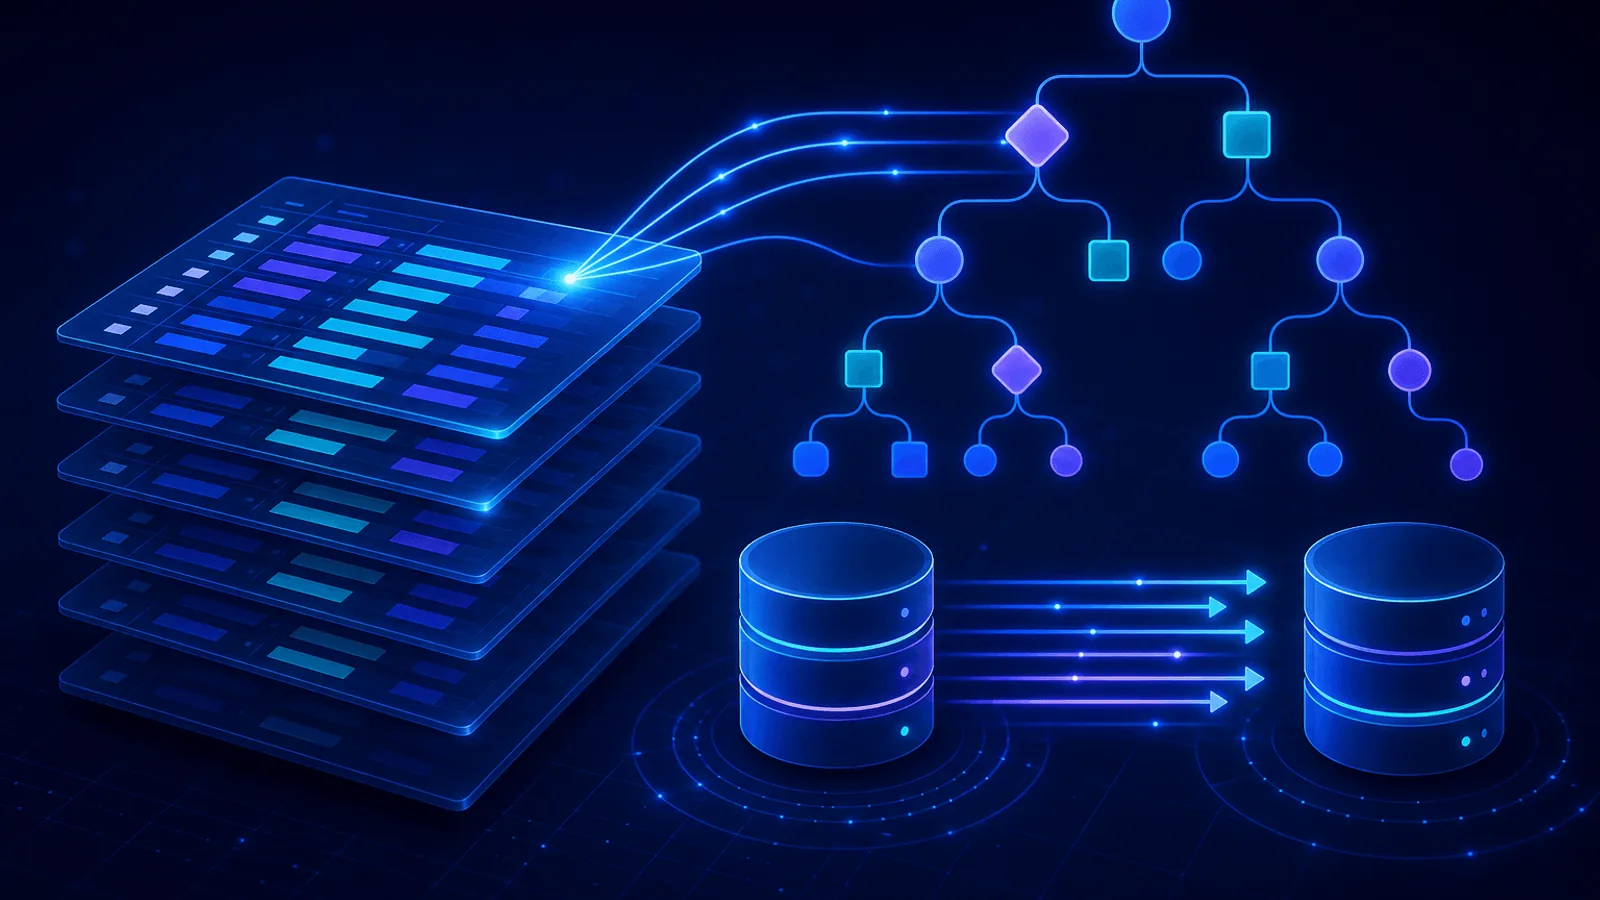
PostgreSQL Production Monitoring: Slow Queries & Replication
Monitor PostgreSQL in production. pg_stat_statements, replication lag, autovacuum bloat, lock trees, connection pools, and alert thresholds.

Redis Production Monitoring: Memory, Eviction & Latency
Monitor Redis in production. INFO sections, maxmemory eviction, latency spikes, slowlog, replication, persistence, big keys, and cluster mode.
INP Monitoring: Interaction to Next Paint Guide
Monitor Interaction to Next Paint (INP) in production. Catch click and input lag before Core Web Vitals slip and SEO suffers.
TTFB Monitoring: Diagnose Slow Server Response Times
Time To First Byte reveals where your site is slow. Learn how to monitor TTFB, what causes high values, and how to fix server-side slowness.
Core Web Vitals Monitoring: LCP, INP, and CLS
Google uses Core Web Vitals for rankings. Learn how to monitor LCP, INP, and CLS, detect regressions, and keep your site fast.
Nginx Monitoring: Uptime, Errors, and Performance
Nginx powers a third of the web. Learn how to monitor Nginx for uptime, error rates, slow responses, and misconfigurations before users notice.
Load Testing vs Monitoring: What's the Difference and When Do You Need Each?
Load testing and monitoring solve different problems. Learn when to use each, how they complement each other, and why you need both for reliable systems.
1-Minute vs 5-Minute Monitoring Check Intervals
Should you check every minute or every 5 minutes? Learn how to choose the right monitoring interval for your website — and when faster checks actually matter.
Hidden Cost of Slow Websites: Response Time Monitoring
Your site might be 'up' but still losing customers. Learn why response time monitoring matters and how slow performance kills conversions.