
Serverless Cold Starts: Causes, Monitoring, and Fixes
What a serverless cold start is, why the first request to an idle function is slow, and how to measure and reduce cold starts on Lambda and edge runtimes.
Packet Loss Monitoring: Causes, Detection, and Fixes
What packet loss is, what causes it, how to monitor and measure it, what counts as acceptable, and how to diagnose and fix it before users notice.
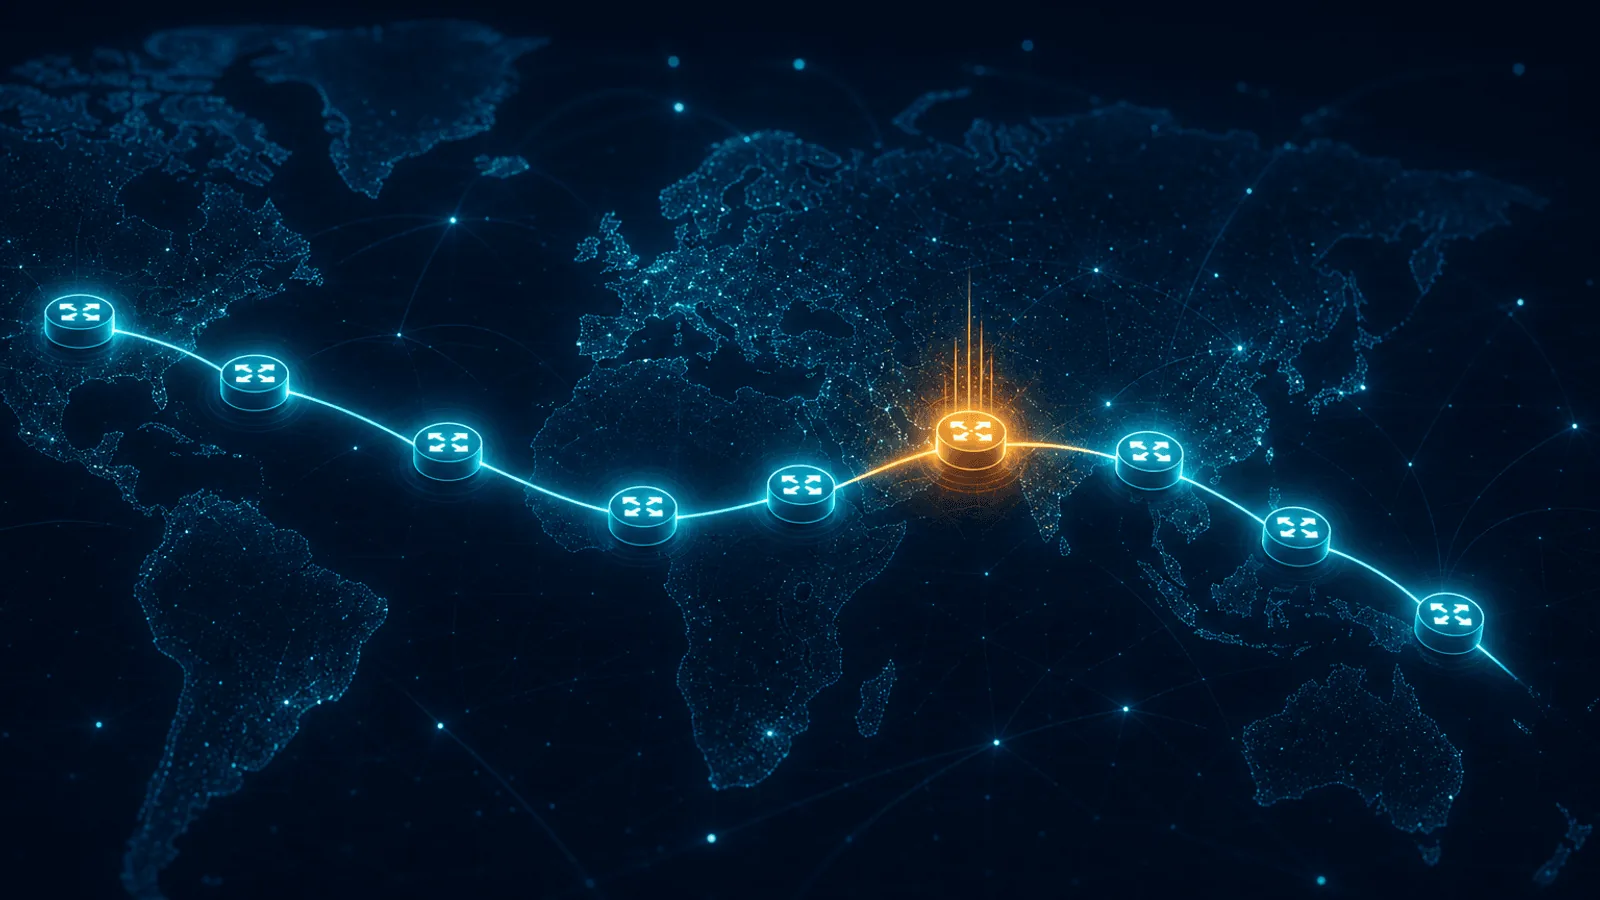
Traceroute Explained: Diagnosing Network Path Problems
Learn how traceroute probes TTL hops, why RTT and loss can mislead, and how to combine TCP/ICMP traces, MTR, and endpoint tests during diagnosis.
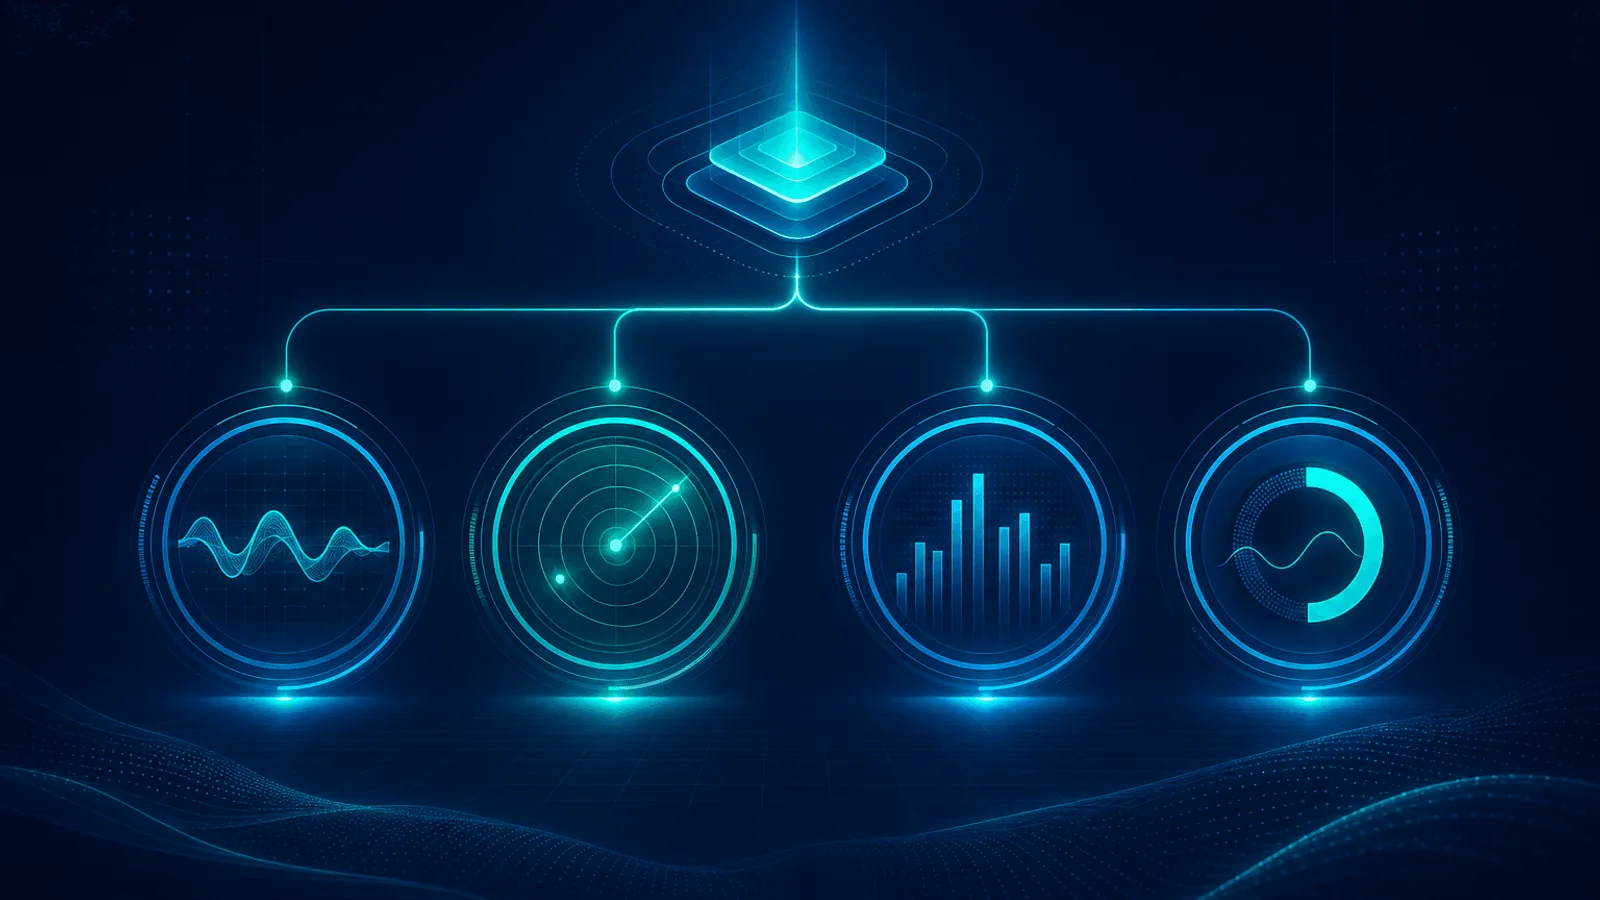
Four Golden Signals: Latency, Traffic, Errors, Saturation
Apply latency, traffic, errors and saturation to service monitoring, choose useful measurements, and alert on user impact instead of dashboard noise.

Network Jitter Explained: Causes, Measurement & Monitoring
What jitter is, why it breaks VoIP, video and gaming, how it's measured, acceptable thresholds, and how to monitor it alongside latency and packet loss.

Apdex Score Explained: Formula, T Threshold, Pitfalls
Calculate Apdex from satisfied and tolerating requests, choose a meaningful T threshold, interpret scores, and avoid the aggregation traps that hide slow users.

HTTP/3 & QUIC Monitoring: What Changes and What to Watch
How HTTP/3 and QUIC change monitoring: UDP 443, 0-RTT, connection migration, fallback to HTTP/2, and the new failure modes and metrics you must watch.

P50 vs P95 vs P99 Latency Explained (With Practical Formulas & Tail Latency Examples)
Understand P50 (median), P95, and P99 tail latency. Learn why average latency is misleading, how percentiles are calculated, and how to set accurate SLO alerts.

Incoming Webhook Monitoring: Retries and Security
Monitor incoming webhook receipt, signature verification, queue age, processing outcomes, duplicates and provider retries without exposing secrets.

Redis Monitoring: Memory, Evictions, Latency, and Replication
Monitor Redis memory, eviction rate, command latency percentiles, slowlog, persistence, replication, clients, big keys, and cluster health.
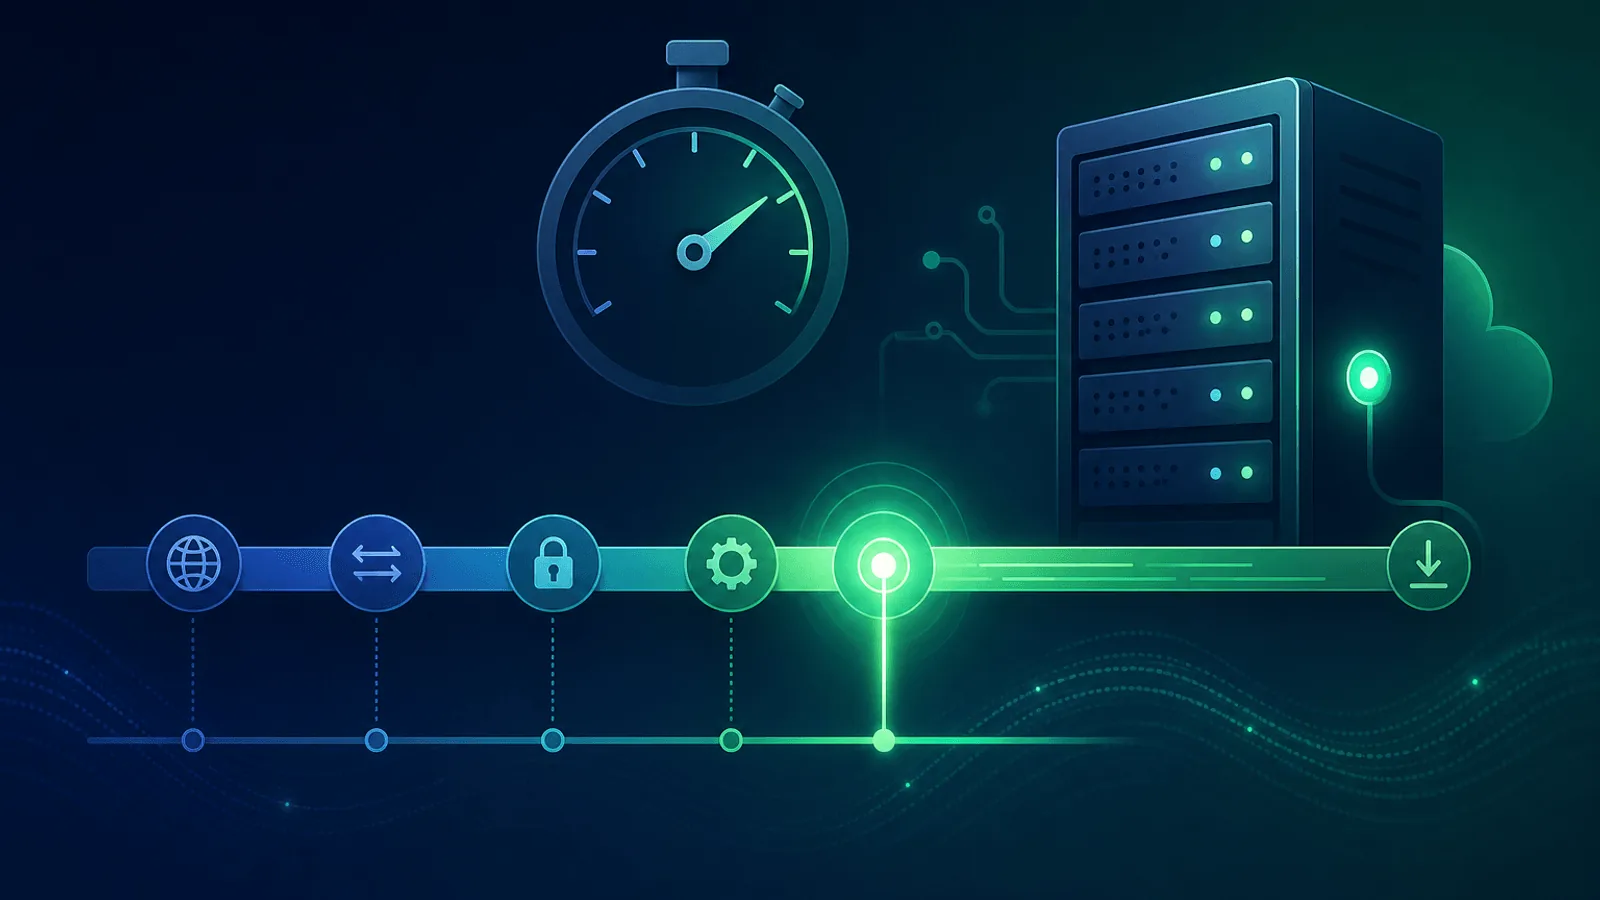
TTFB Monitoring: Time to First Byte Guide
Measure Time to First Byte in lab, field and synthetic checks, separate network from origin delay, and alert on route, region and cache regressions.
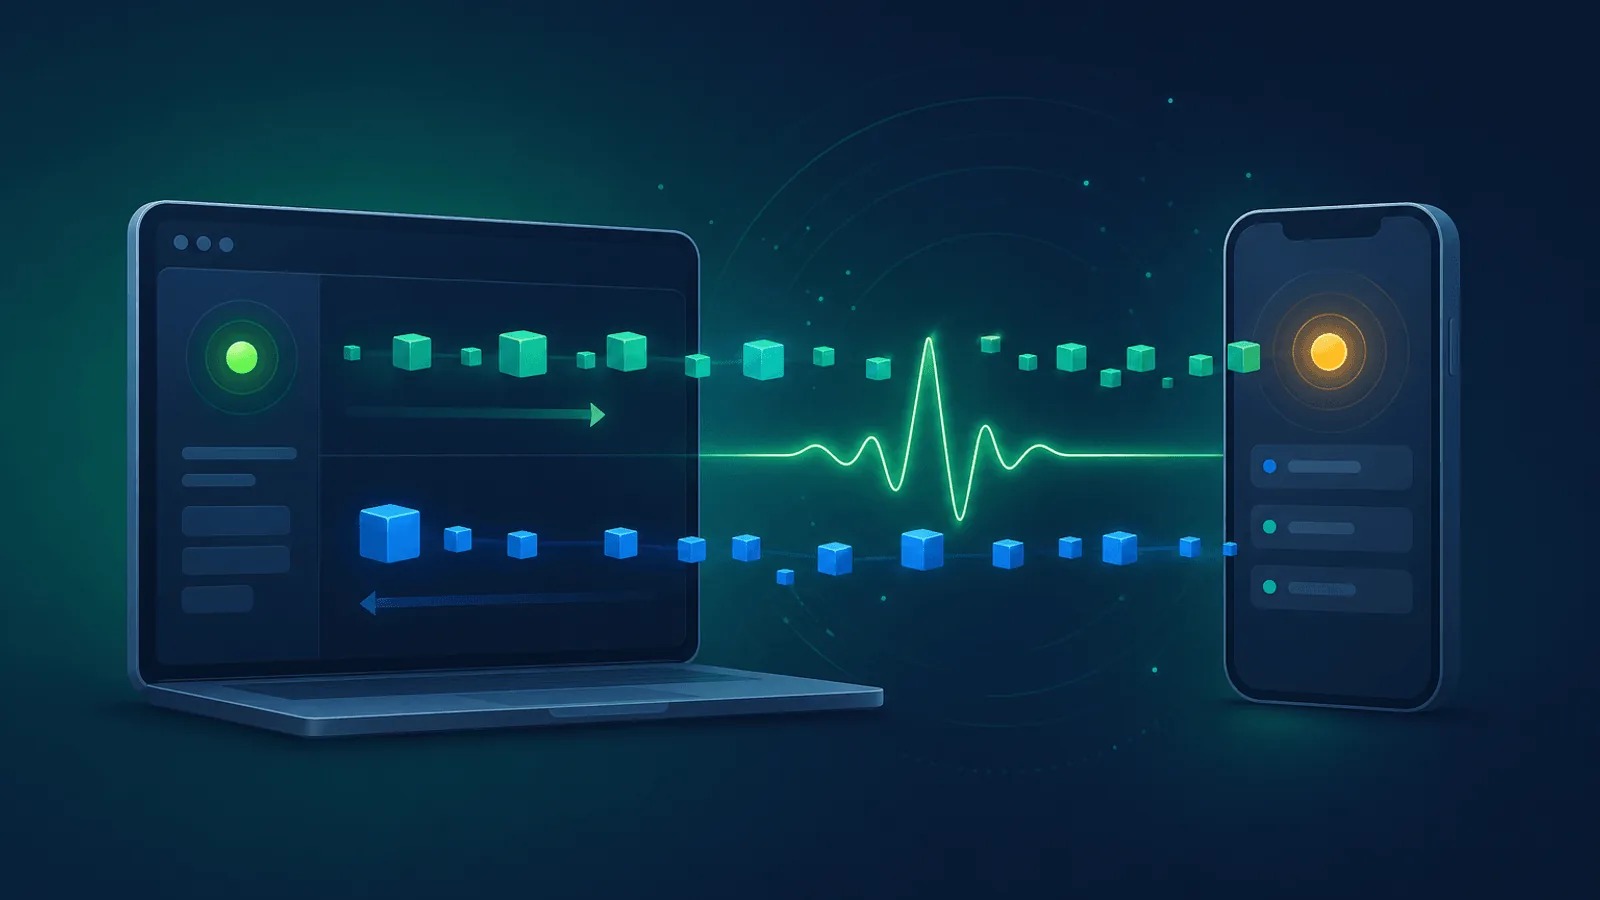
WebSocket Monitoring: Keep Real-Time Features Online
Monitor WebSocket handshakes, authenticated message delivery, latency, close behavior, and reconnects without mistaking HTTP uptime for real-time health.
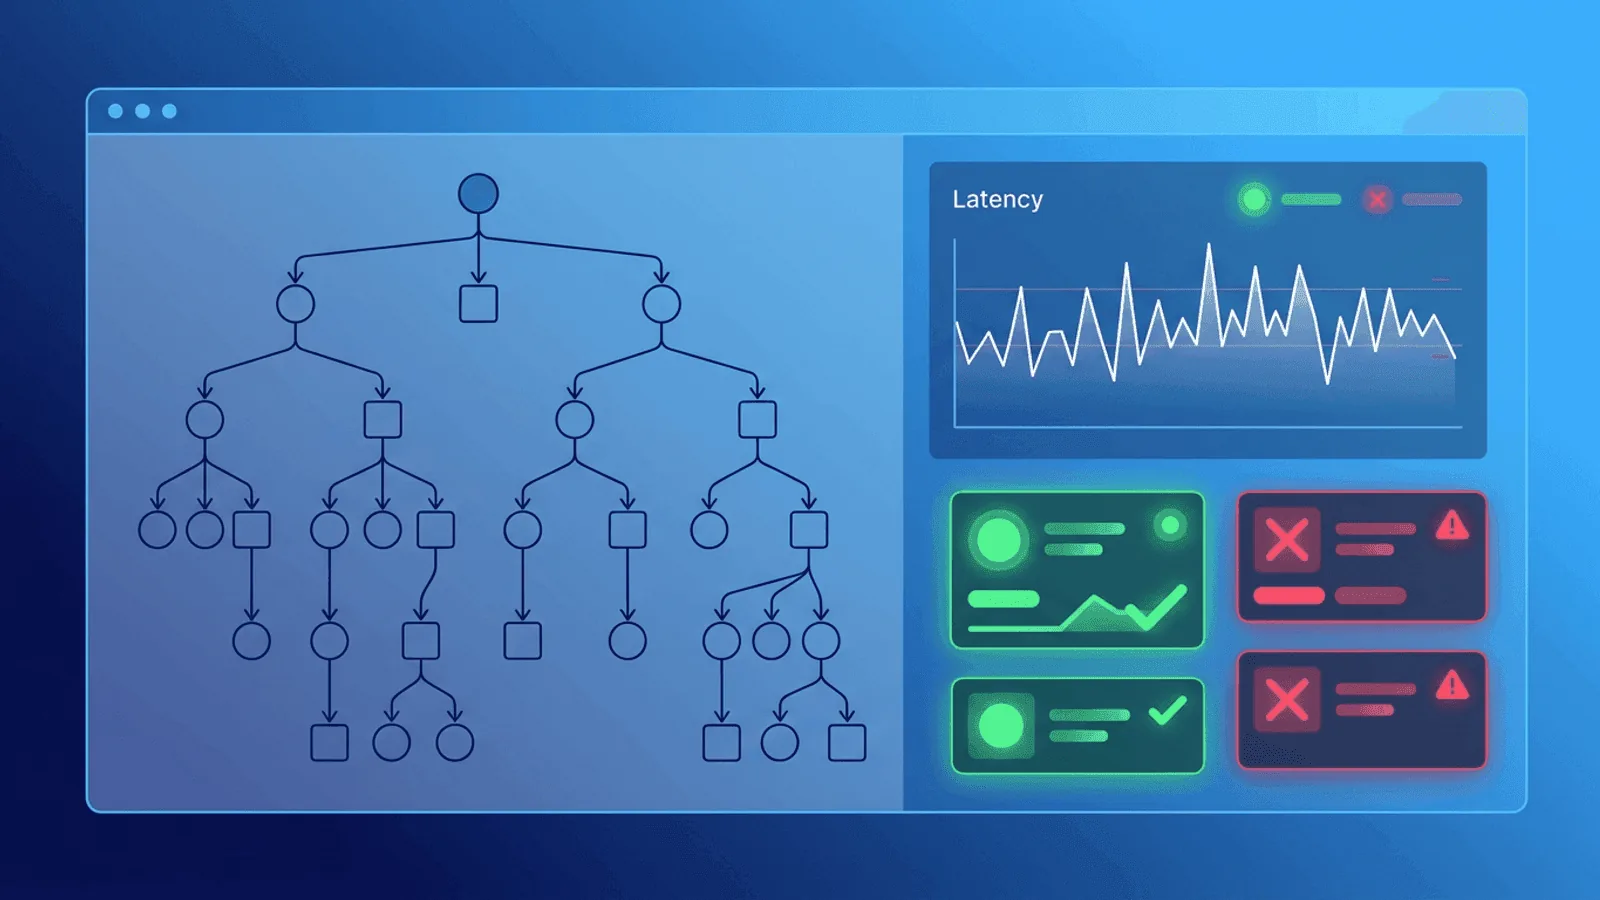
GraphQL Monitoring: Errors, Resolvers, Latency, Uptime
Monitor GraphQL operation success, partial errors, resolver latency, complexity and endpoint availability without treating every HTTP 200 as healthy.
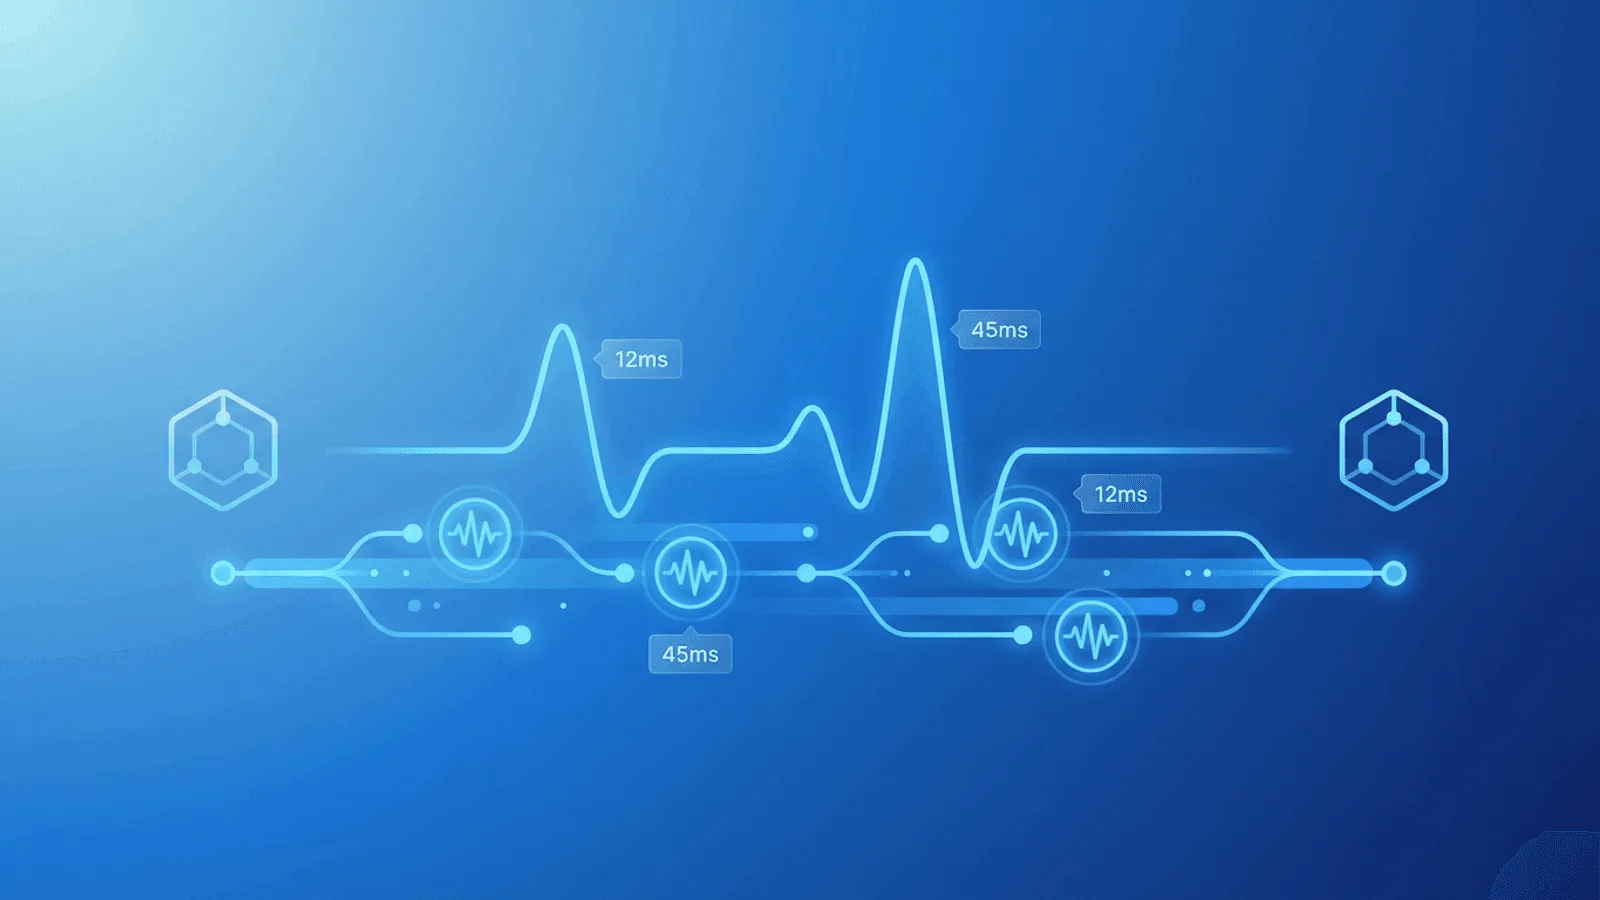
Ping Monitoring: ICMP vs TCP, Packet Loss & Latency
Learn what ping monitoring can reveal about ICMP reachability, packet loss, and latency—and why TCP or HTTP checks are needed to prove application health.