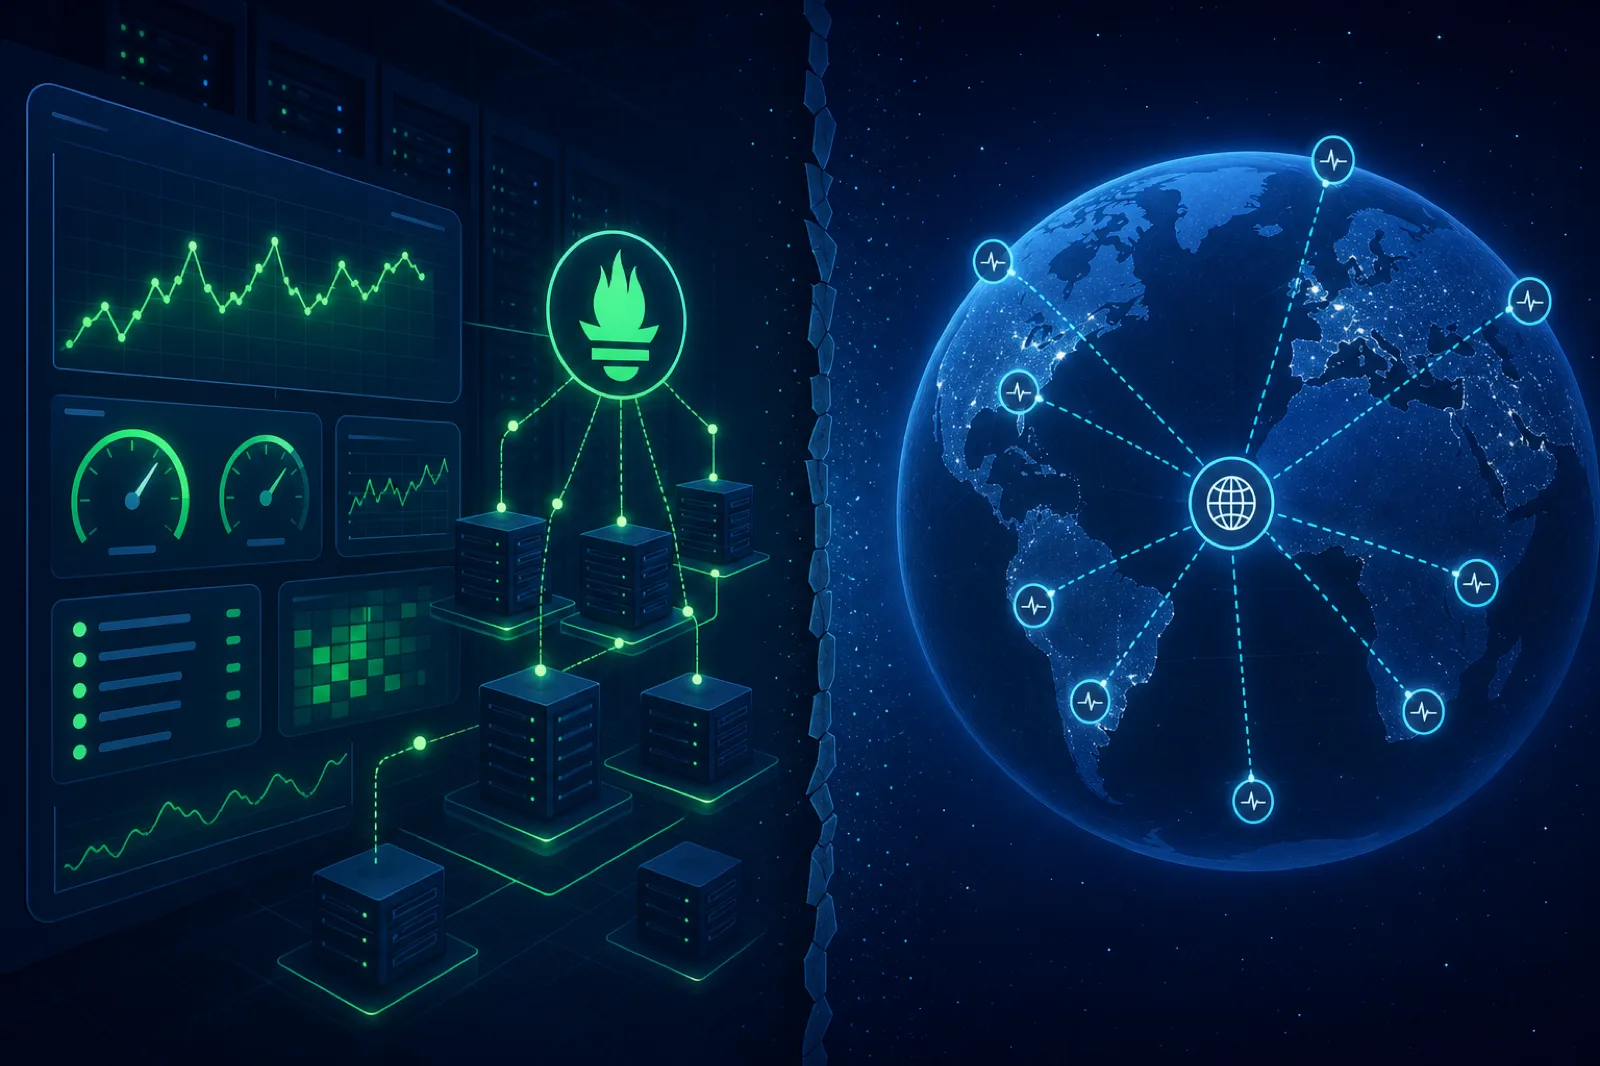
Prometheus Monitoring: Strengths, Gaps, and Setup
Understand Prometheus metrics, labels, PromQL and alerting, plus its outside-in, event-detail and pipeline blind spots and how to cover them.

Anomaly Detection in Monitoring: Move Beyond Static Thresholds
Compare anomaly detection with static thresholds, choose useful baselines, handle seasonality and cold starts, and turn outliers into actionable alerts.
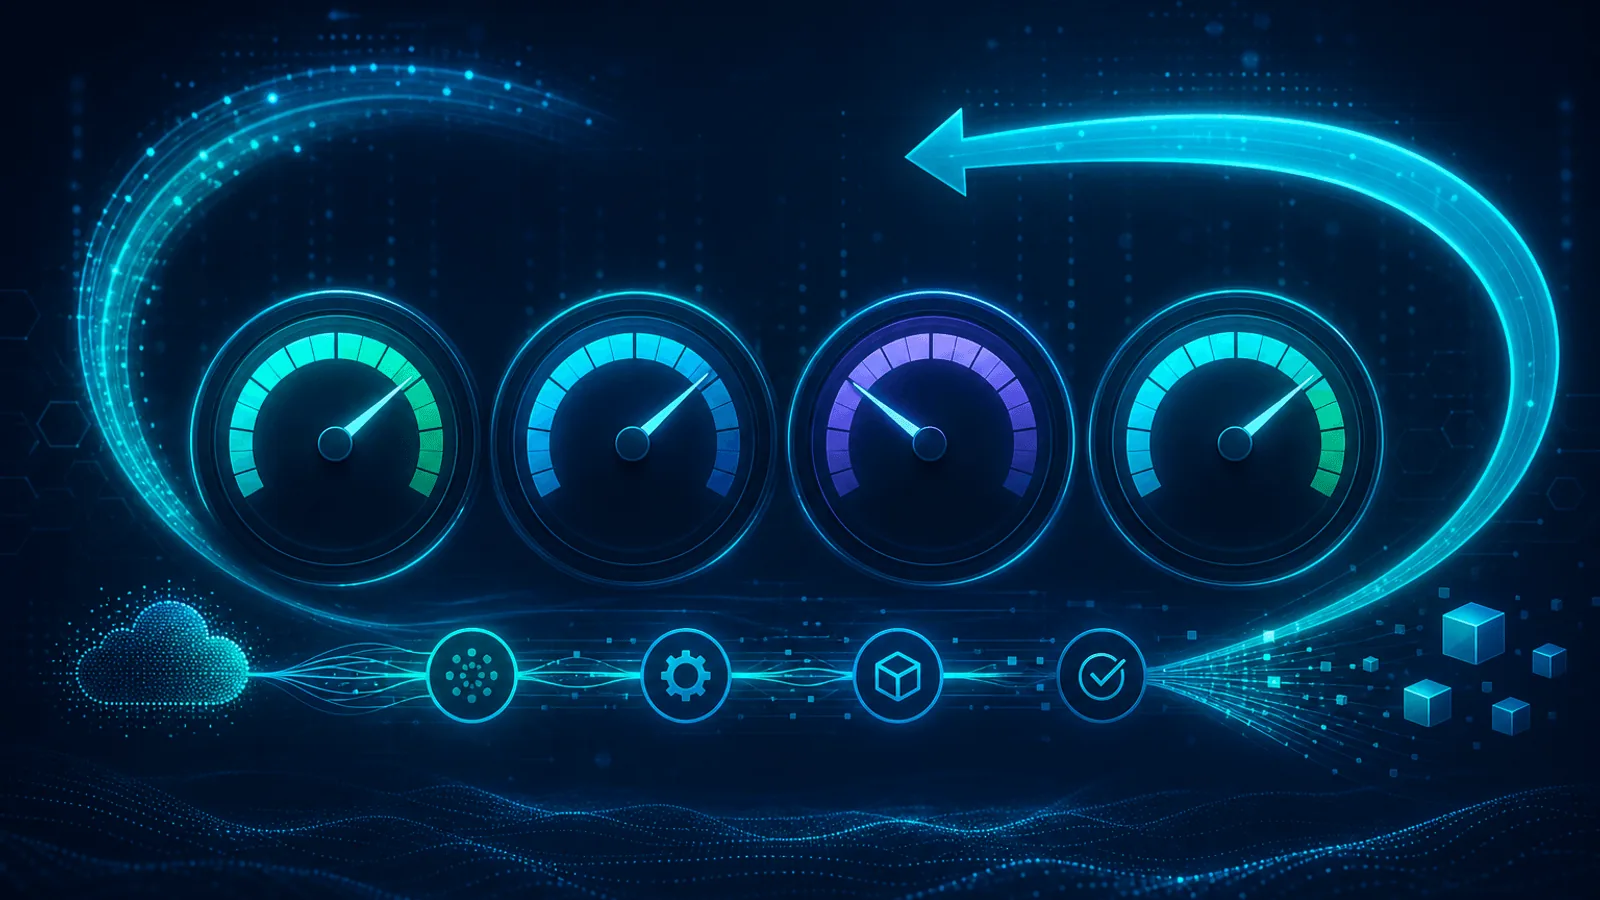
DORA Metrics Explained: The 5 Software Delivery Metrics
Learn DORA's five current software delivery metrics, their exact definitions, formulas, trade-offs, and a practical way to collect them without gaming results.
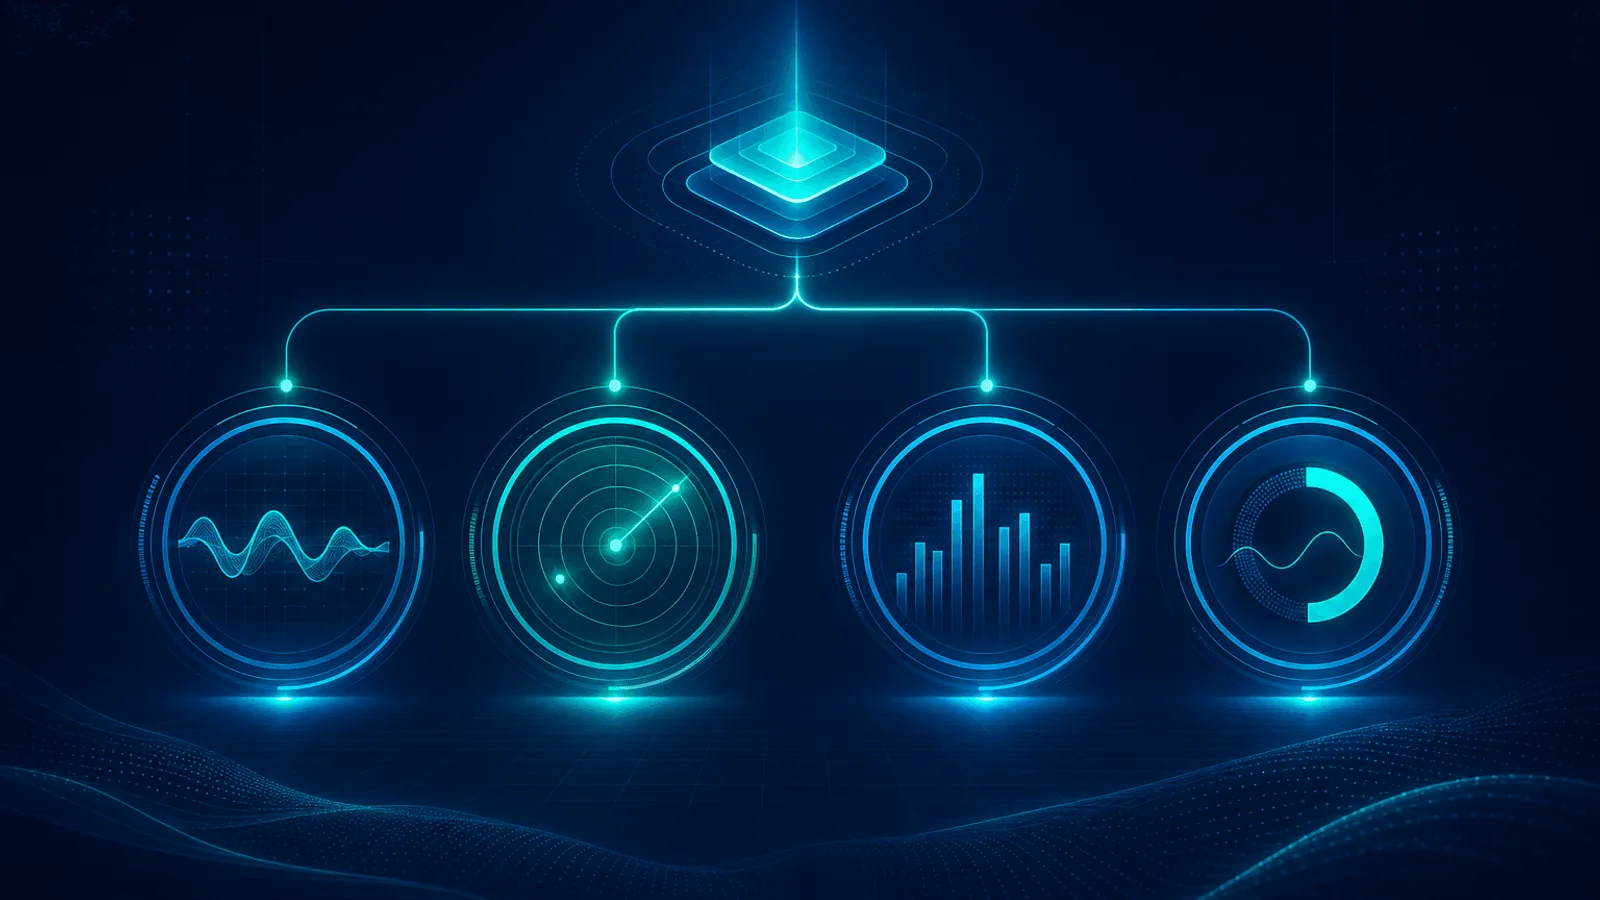
Four Golden Signals: Latency, Traffic, Errors, Saturation
Apply latency, traffic, errors and saturation to service monitoring, choose useful measurements, and alert on user impact instead of dashboard noise.

RED vs USE Method: Metrics, Differences, Examples
Use RED for service requests and USE for resources, understand each framework’s metrics and blind spots, and connect them during incident diagnosis.
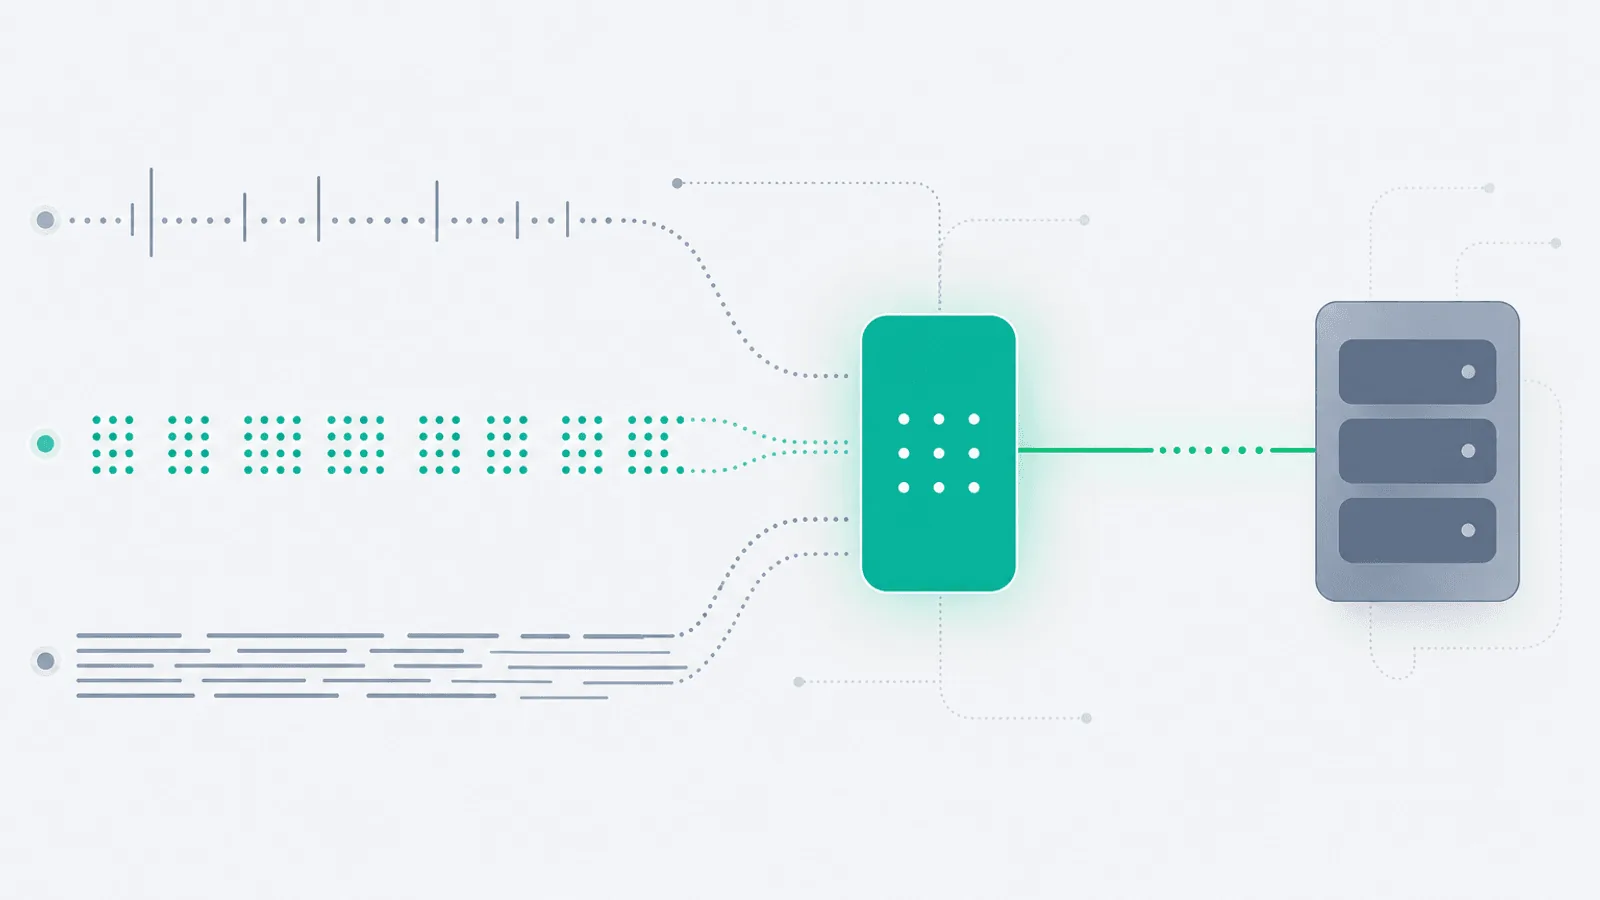
OpenTelemetry Monitoring: Traces, Metrics, Logs
Instrument and operate OpenTelemetry traces, metrics and logs with semantic conventions, Collector pipelines, sampling, cardinality control and health checks.
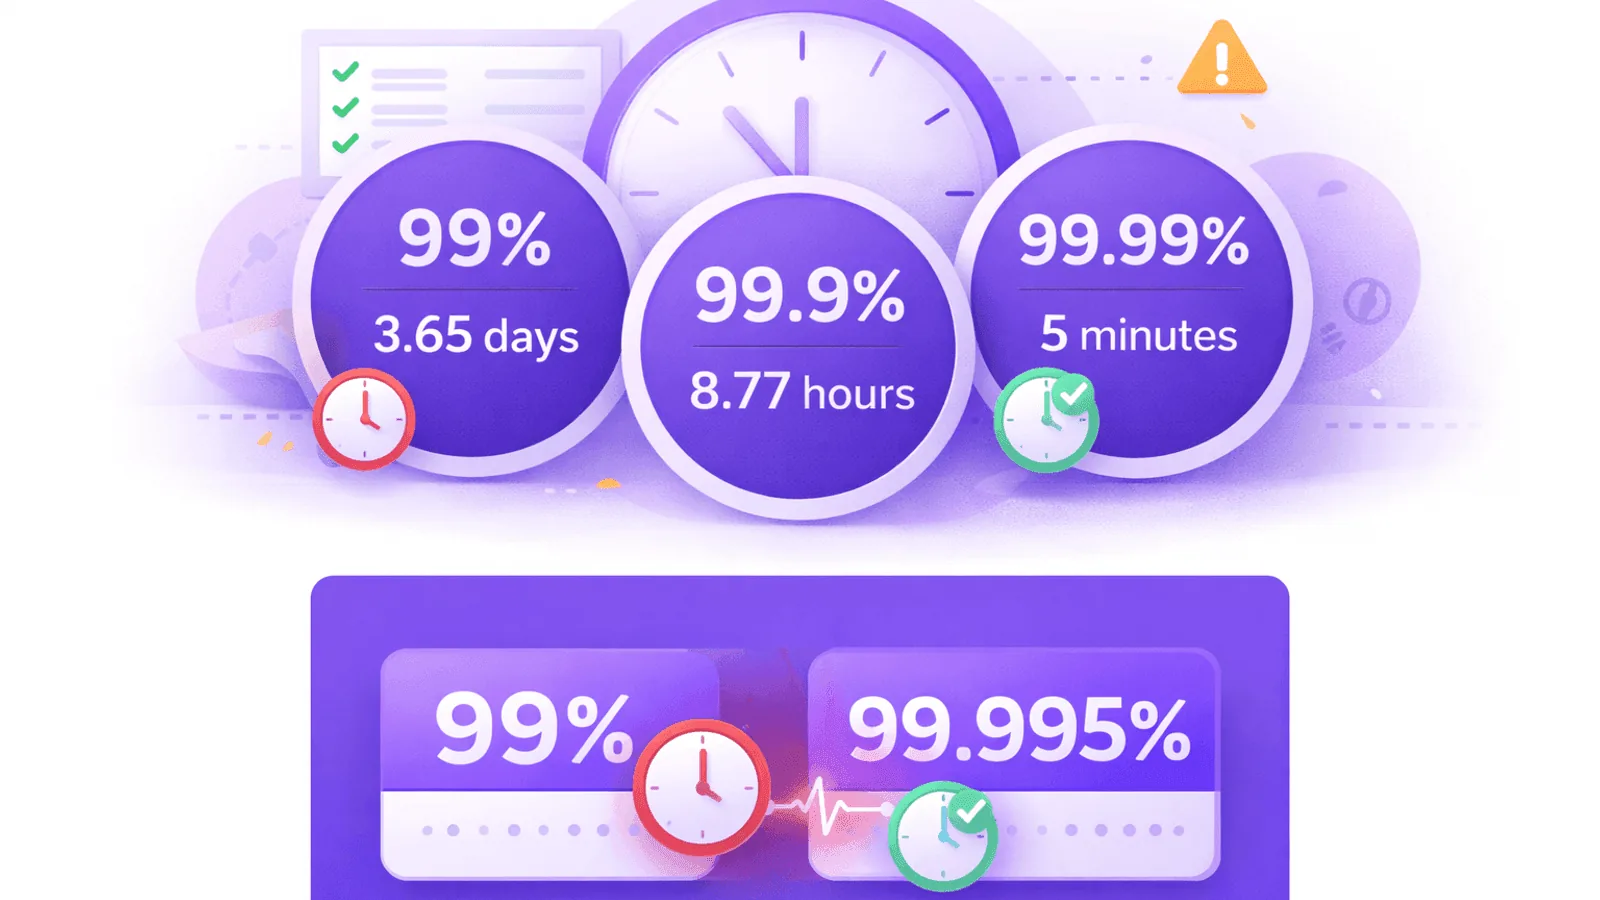
How to Calculate Website Uptime Accurately
Calculate website uptime from incident duration, define what counts as down, handle check intervals and partial failures, and compare results with an SLA.