
Prometheus Monitoring: Strengths, Gaps, and Setup
Understand Prometheus metrics, labels, PromQL and alerting, plus its outside-in, event-detail and pipeline blind spots and how to cover them.

Alert Flapping: Detection, Dampening, and Hysteresis
Stop flapping alerts with pending duration, consecutive checks, hysteresis, dampening, multi-location confirmation, and root-cause investigation.

Anomaly Detection in Monitoring: Move Beyond Static Thresholds
Compare anomaly detection with static thresholds, choose useful baselines, handle seasonality and cold starts, and turn outliers into actionable alerts.
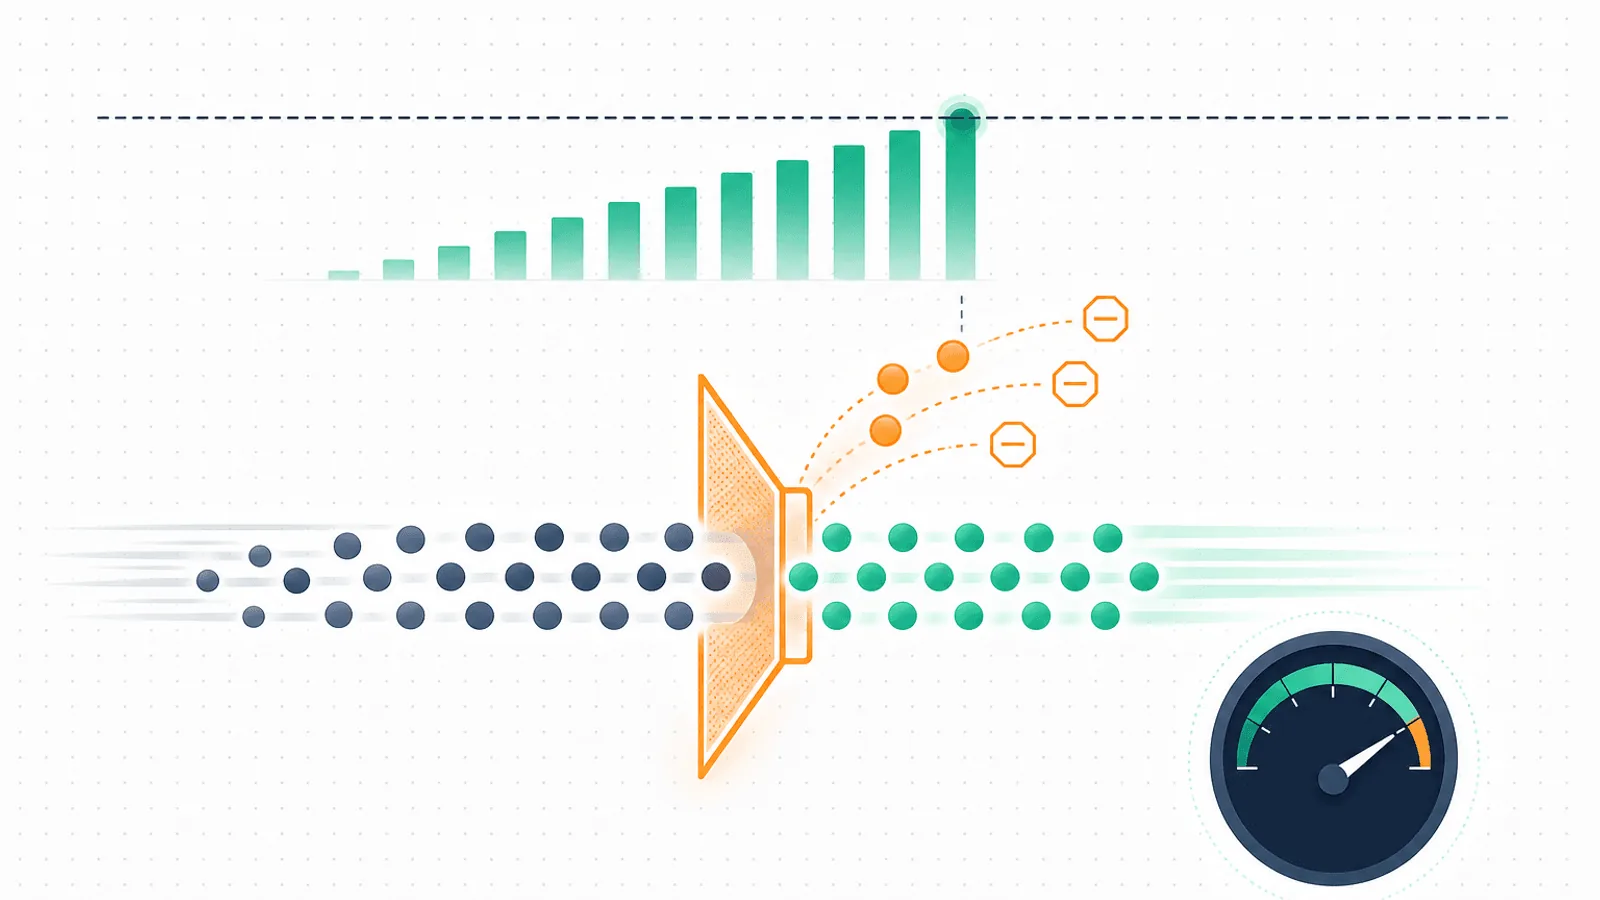
API Rate Limit Monitoring: 429 Errors and Retries
Monitor API quotas and 429 responses, parse Retry-After correctly, separate client bursts from provider throttling, and alert before integrations stall.
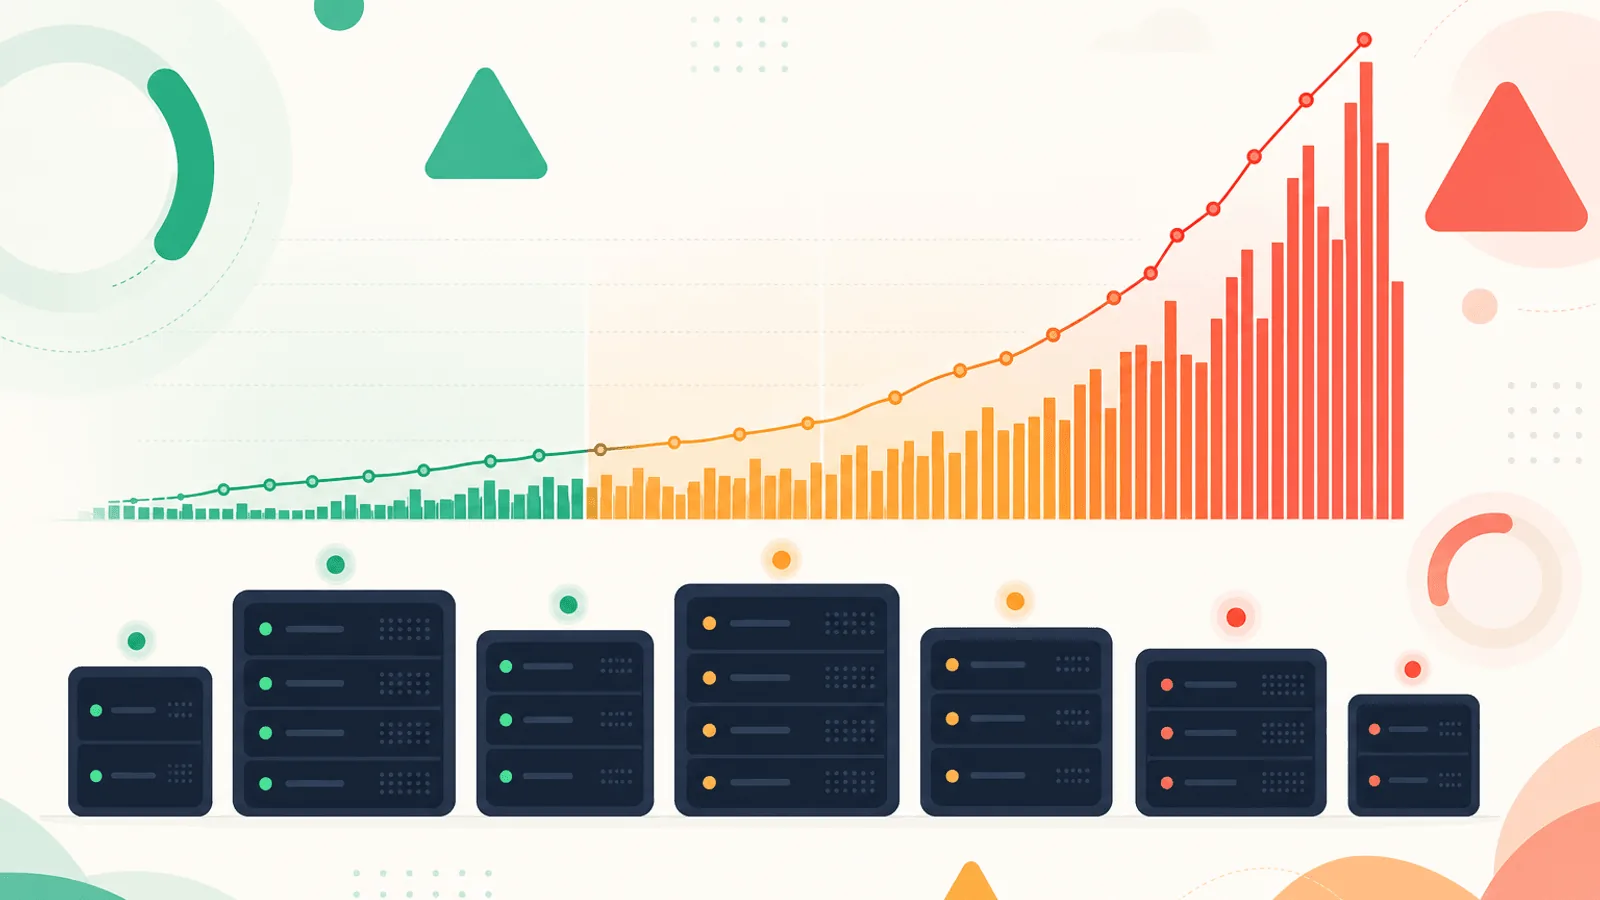
5xx Error Rate Monitoring: Thresholds and Alerting
Monitor 5xx error rates with ratio-based alerts, route and dependency breakdowns, burn-rate context, and an on-call playbook for 500–504 failures.
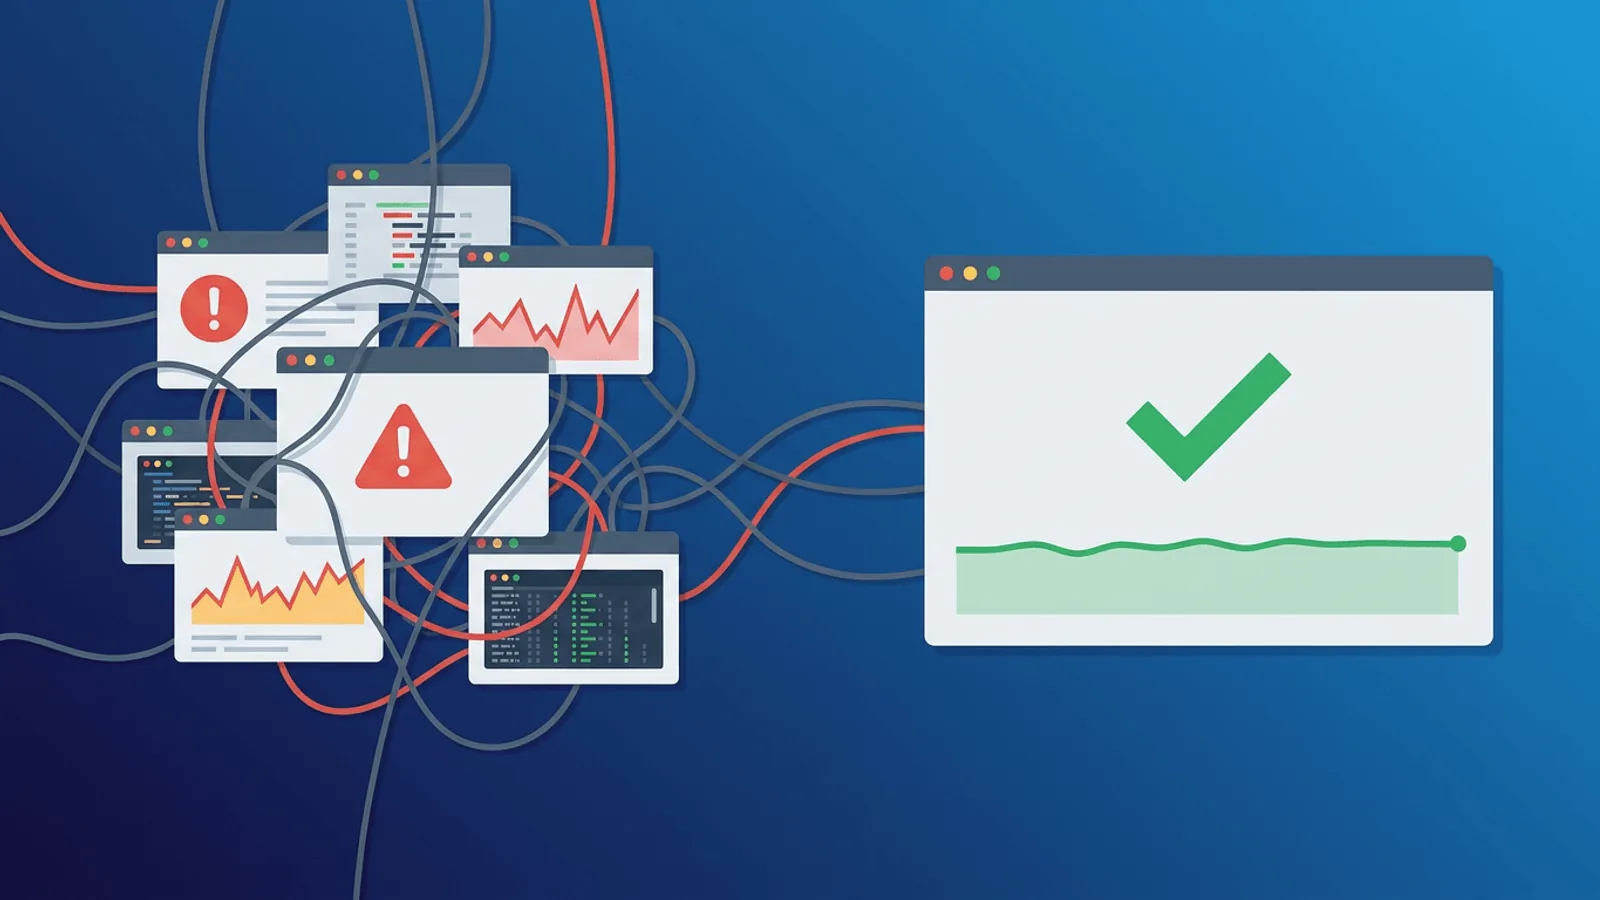
PagerDuty Alternative for Monitoring and On-Call
Compare PagerDuty with monitoring-led incident tools by on-call depth, event ingestion, status pages, pricing, migration, and limits.
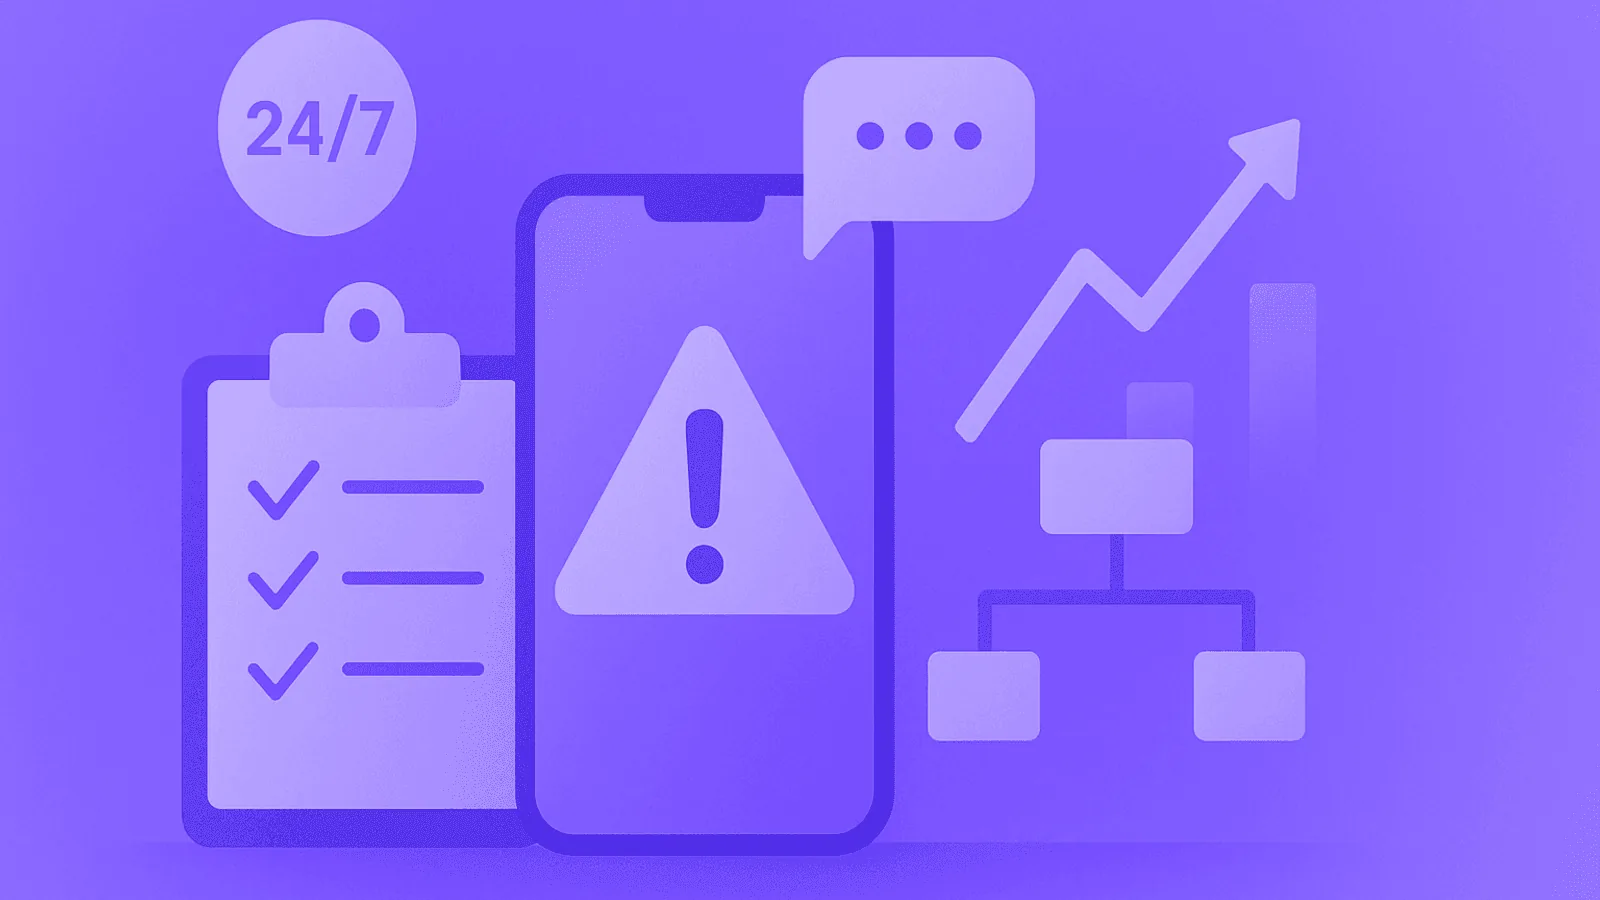
On-Call Without Burnout: A Sustainable Response System
Build sustainable on-call with explicit coverage, actionable pages, fair rotations, escalation, handoffs, recovery time, load metrics, and review loops.
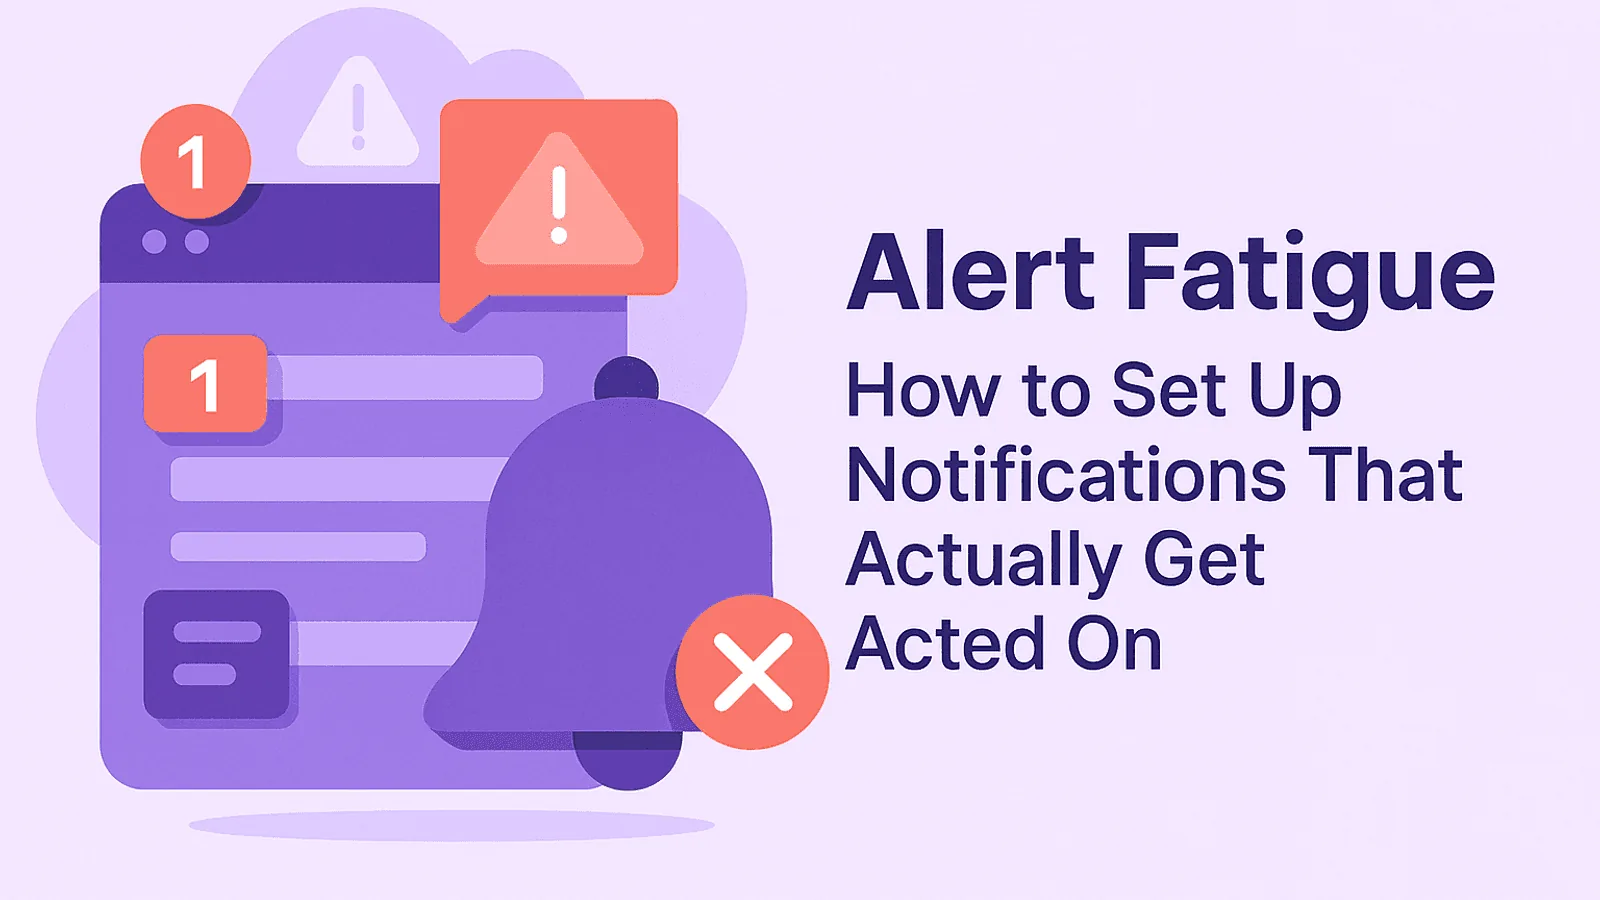
Alert Fatigue: Build Actionable Alerts Responders Trust
Reduce alert fatigue by measuring page actionability, removing duplicate and stale alerts, routing by ownership, tuning thresholds, and testing escalation.
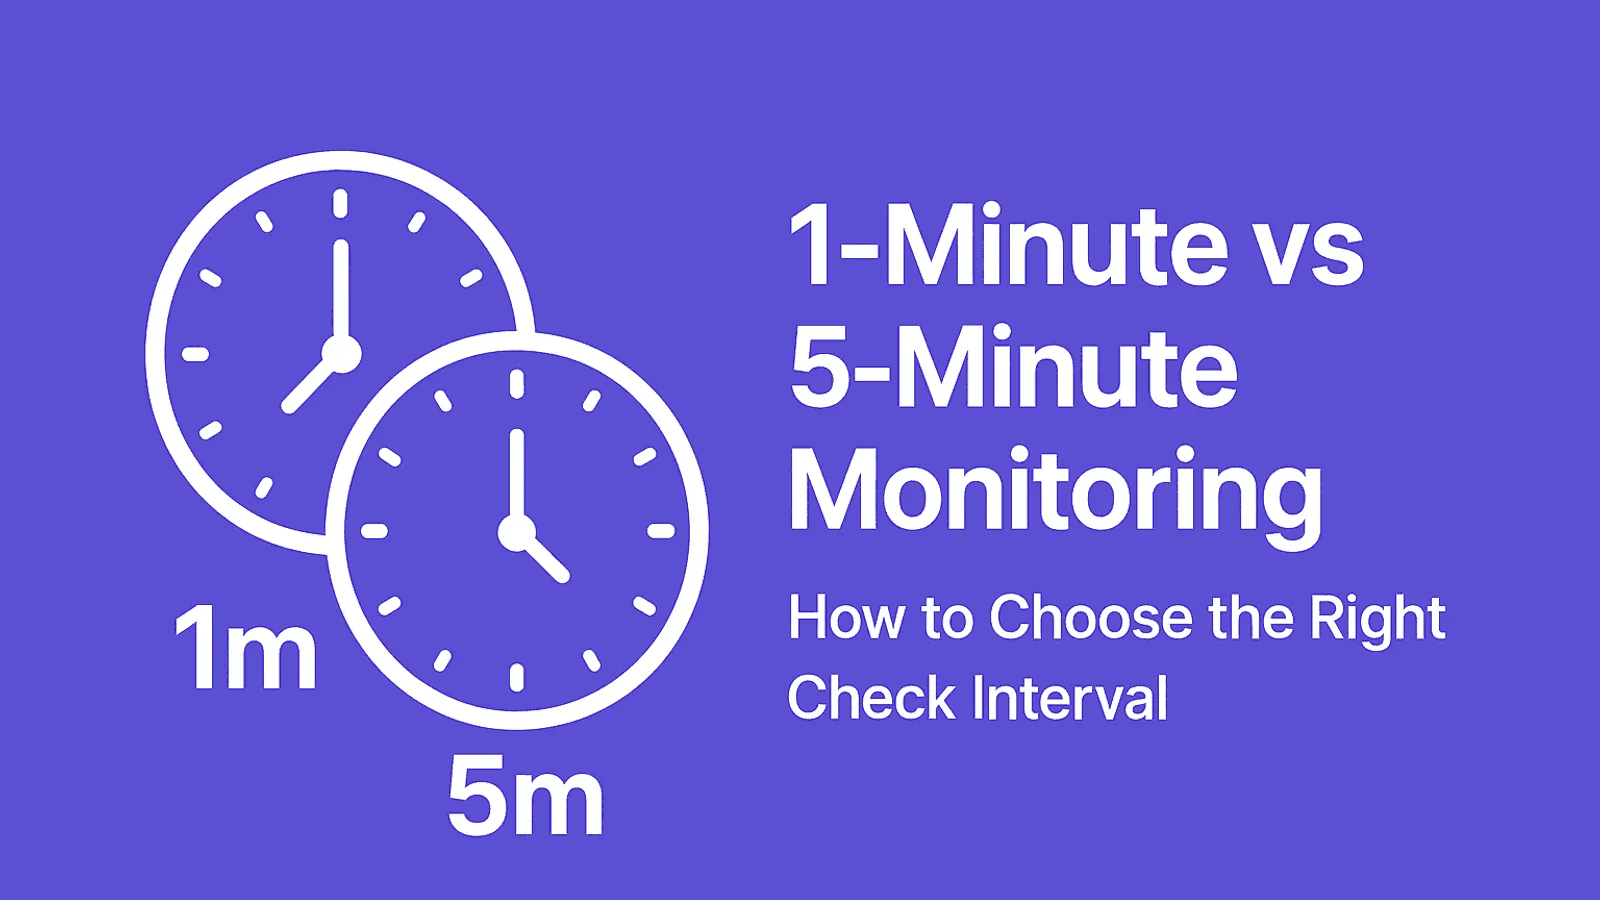
1-Minute vs 5-Minute Monitoring: Detection Time Explained
Compare 1-minute and 5-minute monitoring by expected and worst-case detection time, confirmation policy, outage duration, criticality, and check cost.