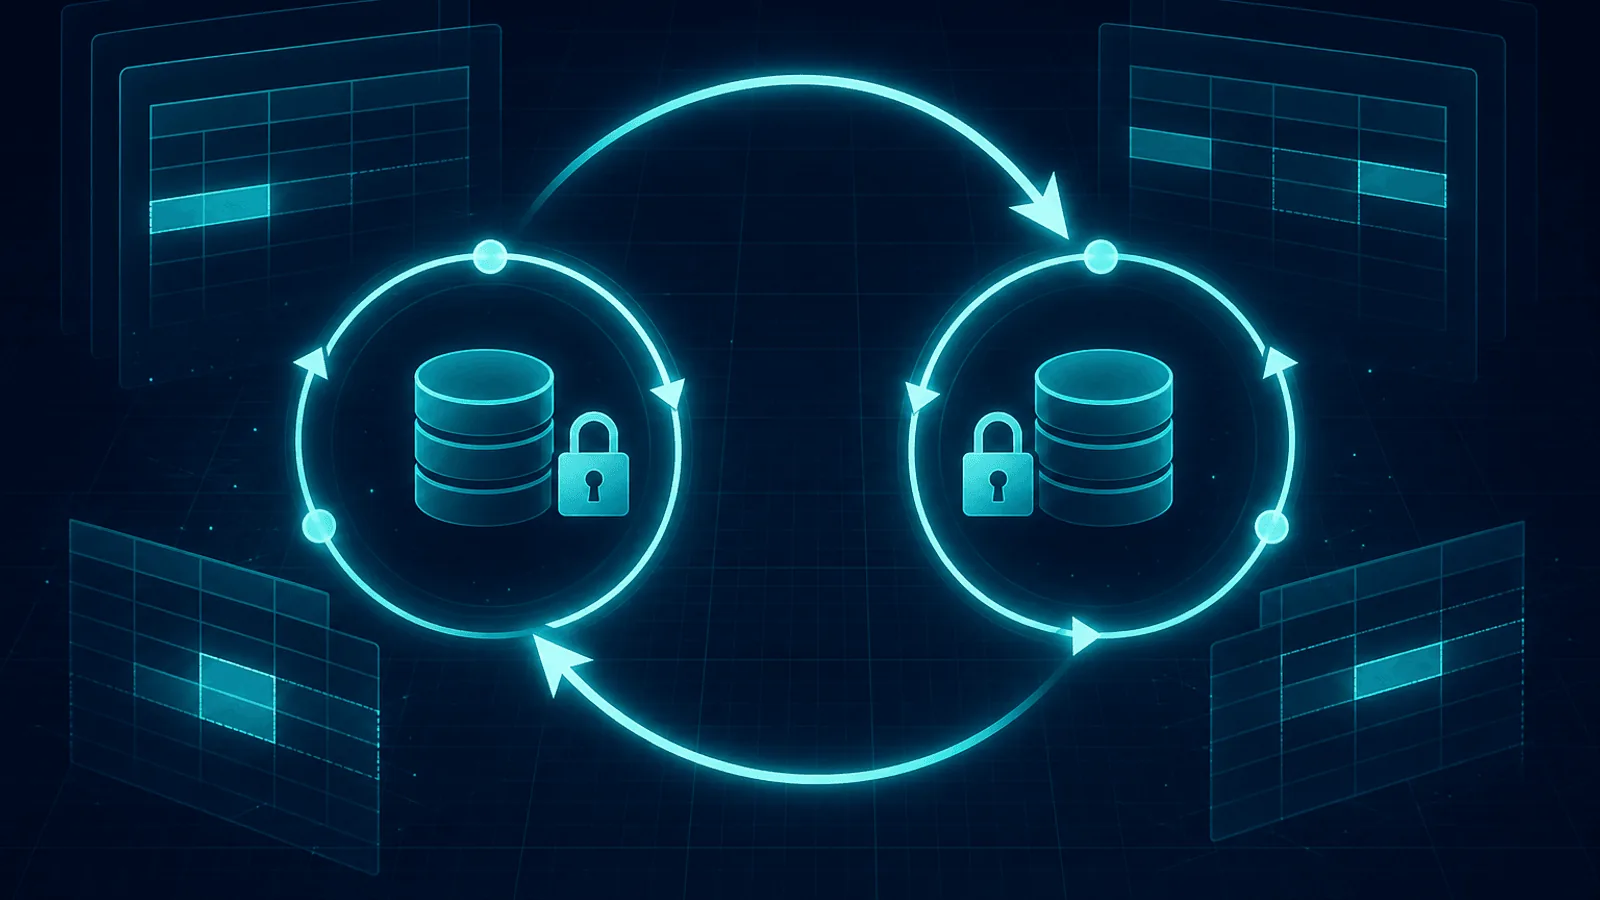
Database Deadlocks: Causes, Detection, and Prevention
Understand database deadlocks, inspect PostgreSQL and MySQL lock waits, prevent cycles with deterministic lock order, and retry aborted transactions safely.
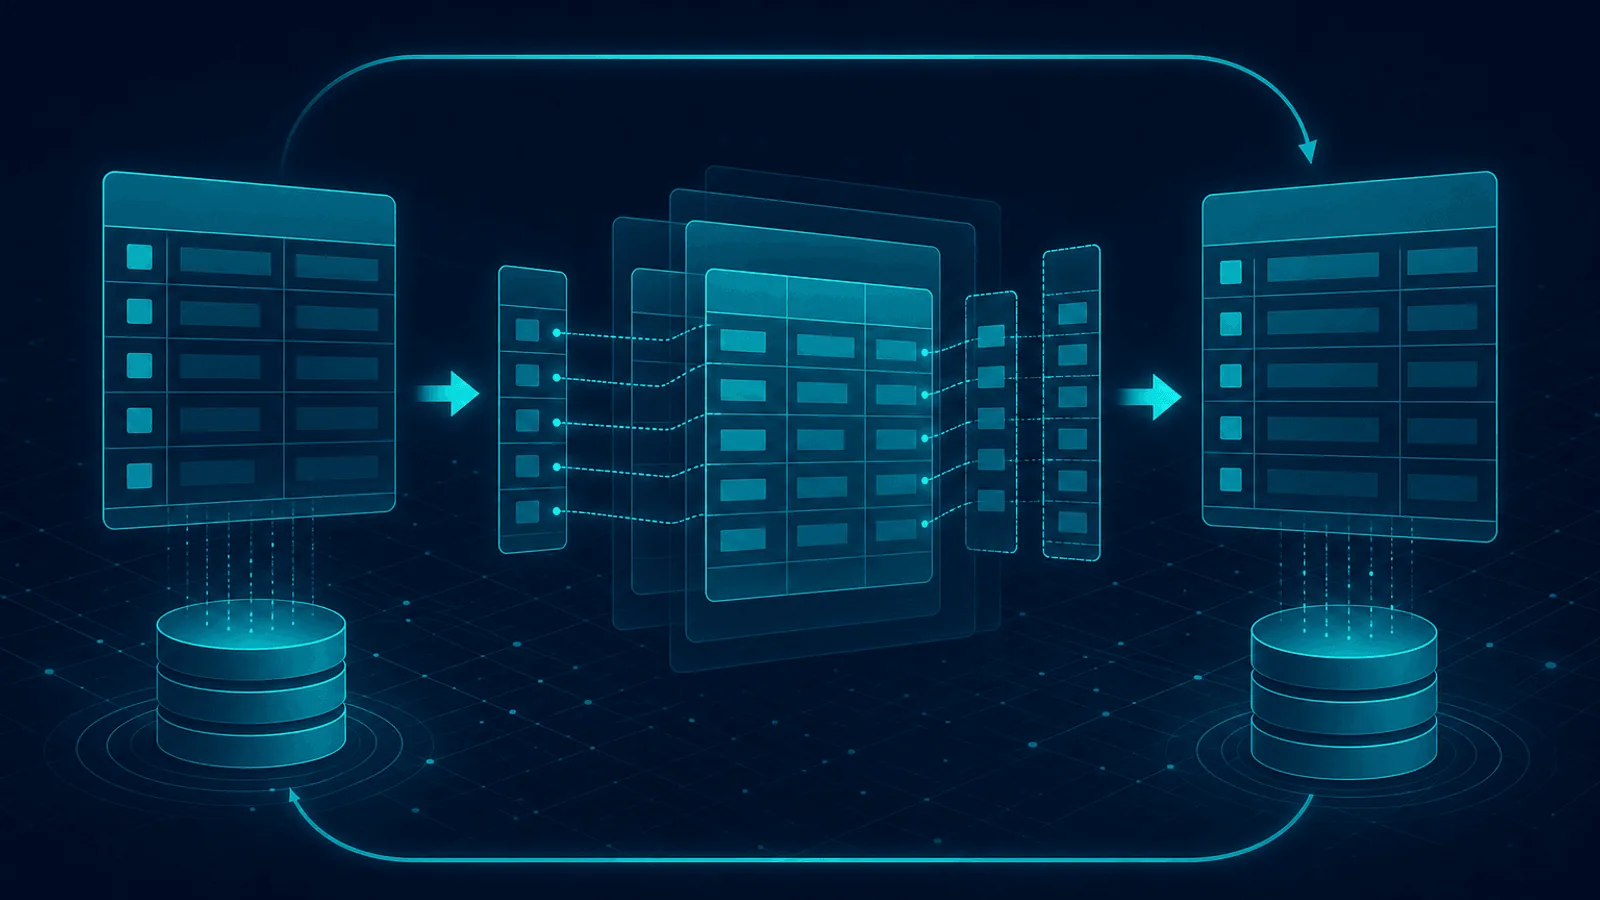
Zero-Downtime Database Schema Migrations: Safe DDL
Plan zero-downtime PostgreSQL and MySQL schema migrations with lock budgets, explicit DDL algorithms, expand-and-contract deploys, backfills, and rollback.
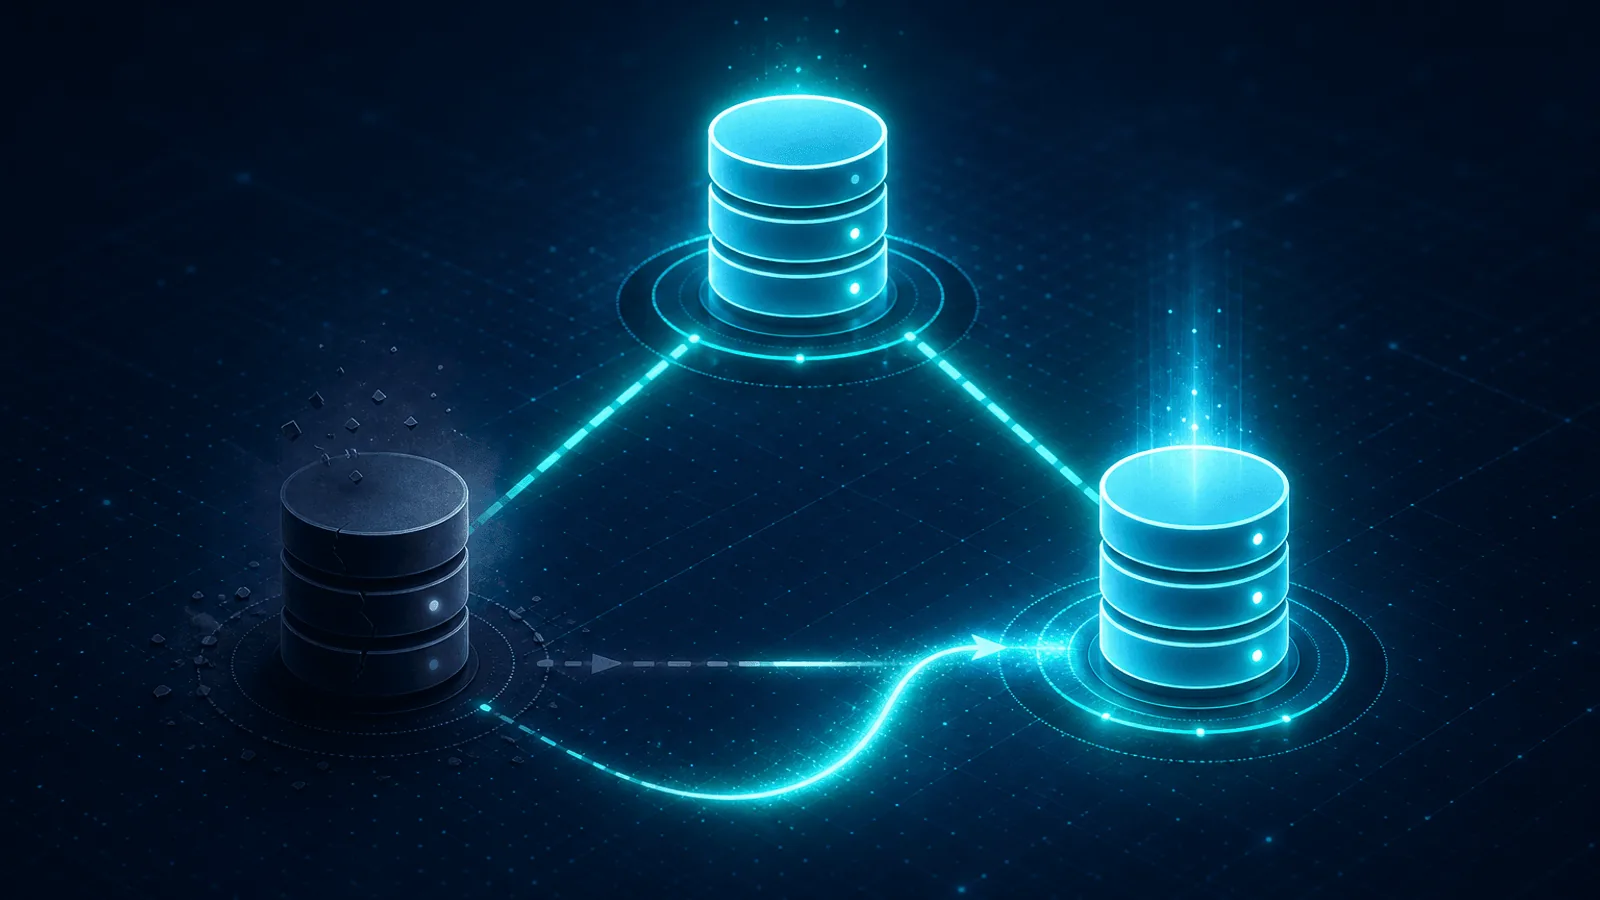
Database Failover and High Availability: A Practical Guide
Learn database failover, quorum, fencing, RTO and RPO; test standby promotion, client reconnection, replica currency, and end-to-end recovery.
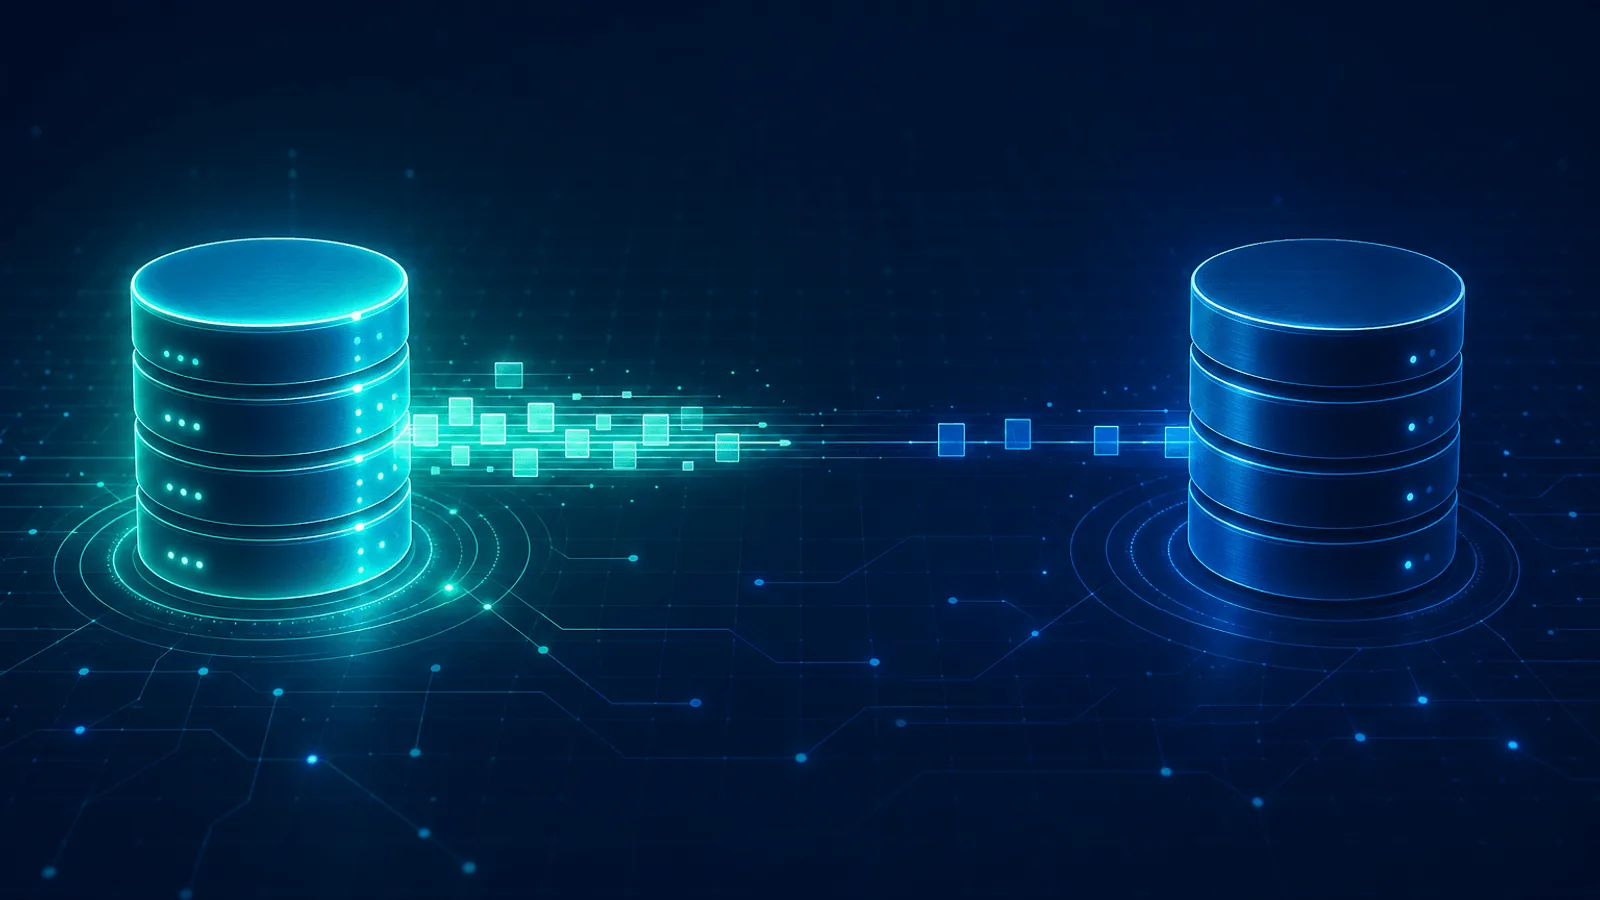
Database Replication Lag: Measure, Diagnose, and Reduce It
Measure replication lag correctly in PostgreSQL, MySQL, and MongoDB; diagnose network, apply, I/O, and workload bottlenecks; protect stale reads and failover.
Database Connection Pool Exhaustion: Diagnose and Fix It
Diagnose database connection pool exhaustion, distinguish client wait timeouts from server limits, size pools across replicas, and fix leaks safely.

Active Record Performance Monitoring: N+1, SQL, and Pools
Monitor Active Record query count, N+1 lazy loads, slow SQL, object instantiation, and connection pool waits using Rails instrumentation and database evidence.

MySQL Monitoring: Slow Queries, InnoDB, Locks, Replication
Monitor MySQL with Performance Schema, slow query logs, InnoDB pressure, lock waits, replication workers, connections, and baseline-based alerts.
PostgreSQL Monitoring: Slow Queries, Locks, Vacuum, Replication
Monitor PostgreSQL with pg_stat_statements, pg_stat_activity, WAL lag, vacuum progress, locks, I/O, and workload-based production alerts.

Redis Monitoring: Memory, Evictions, Latency, and Replication
Monitor Redis memory, eviction rate, command latency percentiles, slowlog, persistence, replication, clients, big keys, and cluster health.
MongoDB Monitoring: Cluster Latency, Replication, and Queries
Monitor MongoDB cluster latency, replica-set state, replication lag, connections, WiredTiger pressure, slow queries, oplog windows, and sharded clusters.
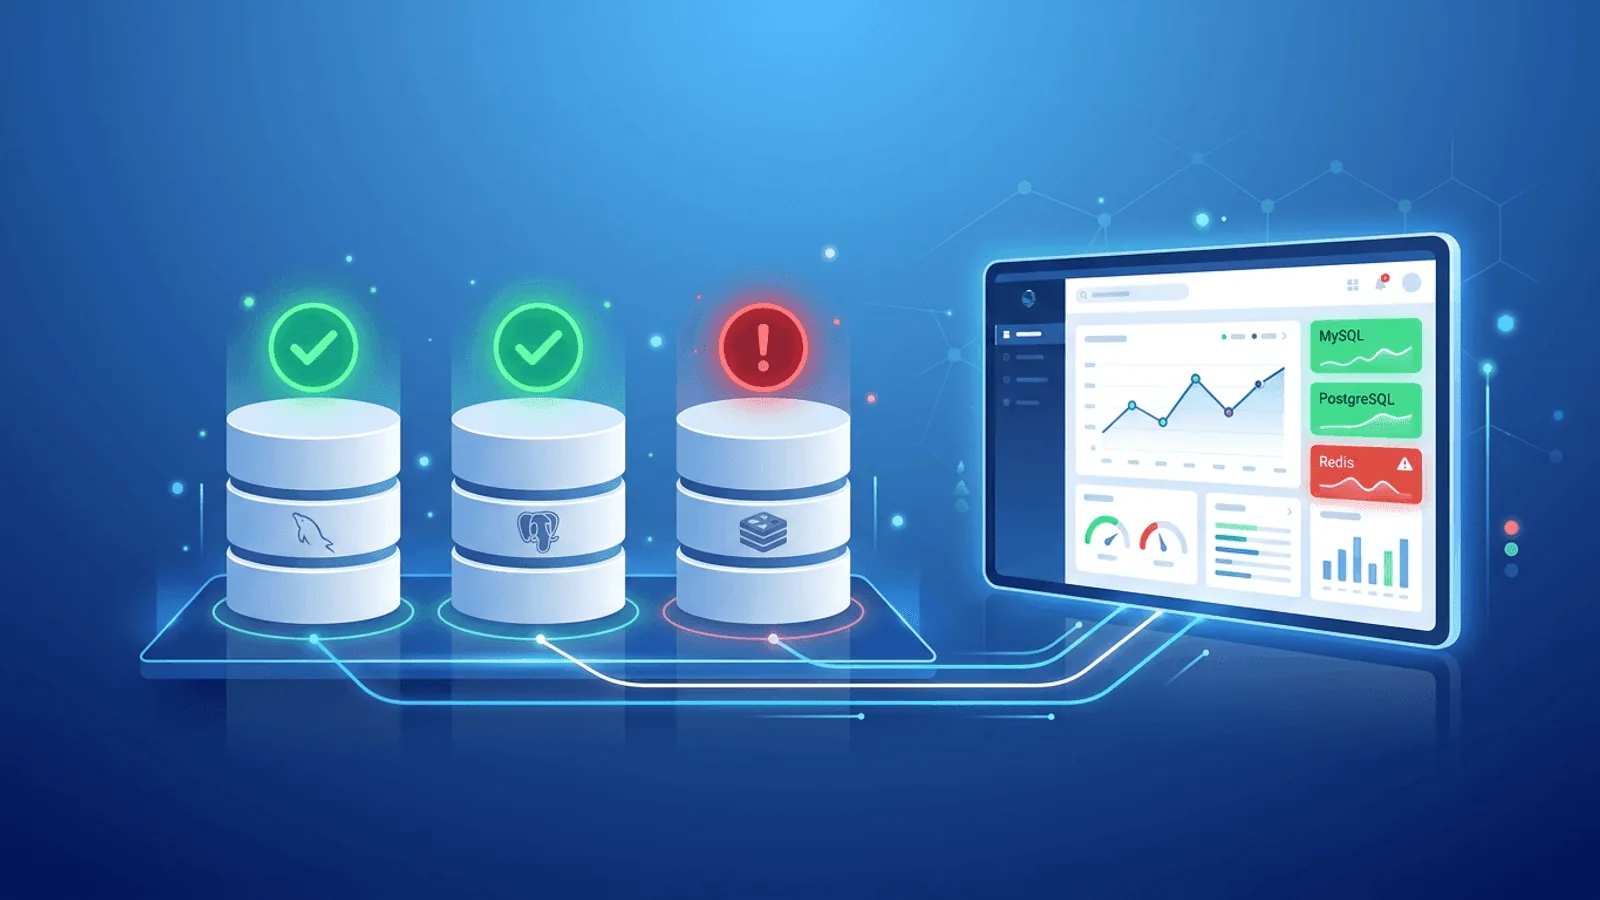
Database Monitoring: MySQL, PostgreSQL, and Redis
Build database monitoring for MySQL, PostgreSQL, and Redis with safe connectivity checks, query probes, saturation metrics, and actionable alerts.