When people say they want "server monitoring," they often mean ten different things at once.
Sometimes they mean CPU and memory graphs. Sometimes they mean knowing whether a host is reachable. Sometimes they mean checking that a web app on that server is actually responding correctly.
The problem is that teams often start with the wrong layer. They collect lots of internal metrics but still learn about outages from users. Or they monitor a homepage while ignoring the server ports and network reachability underneath it.
This guide covers the basics of server monitoring from an uptime and reachability perspective: what to monitor first, how the different check types fit together, and how to build a simple setup that catches the most common failures.
What Server Monitoring Actually Means
At the most practical level, server monitoring answers a few core questions:
- Is the server reachable on the network?
- Are the important ports accepting connections?
- Are the applications on that server responding correctly?
- Is response time getting worse before failure?
- Are background jobs and supporting services still running?
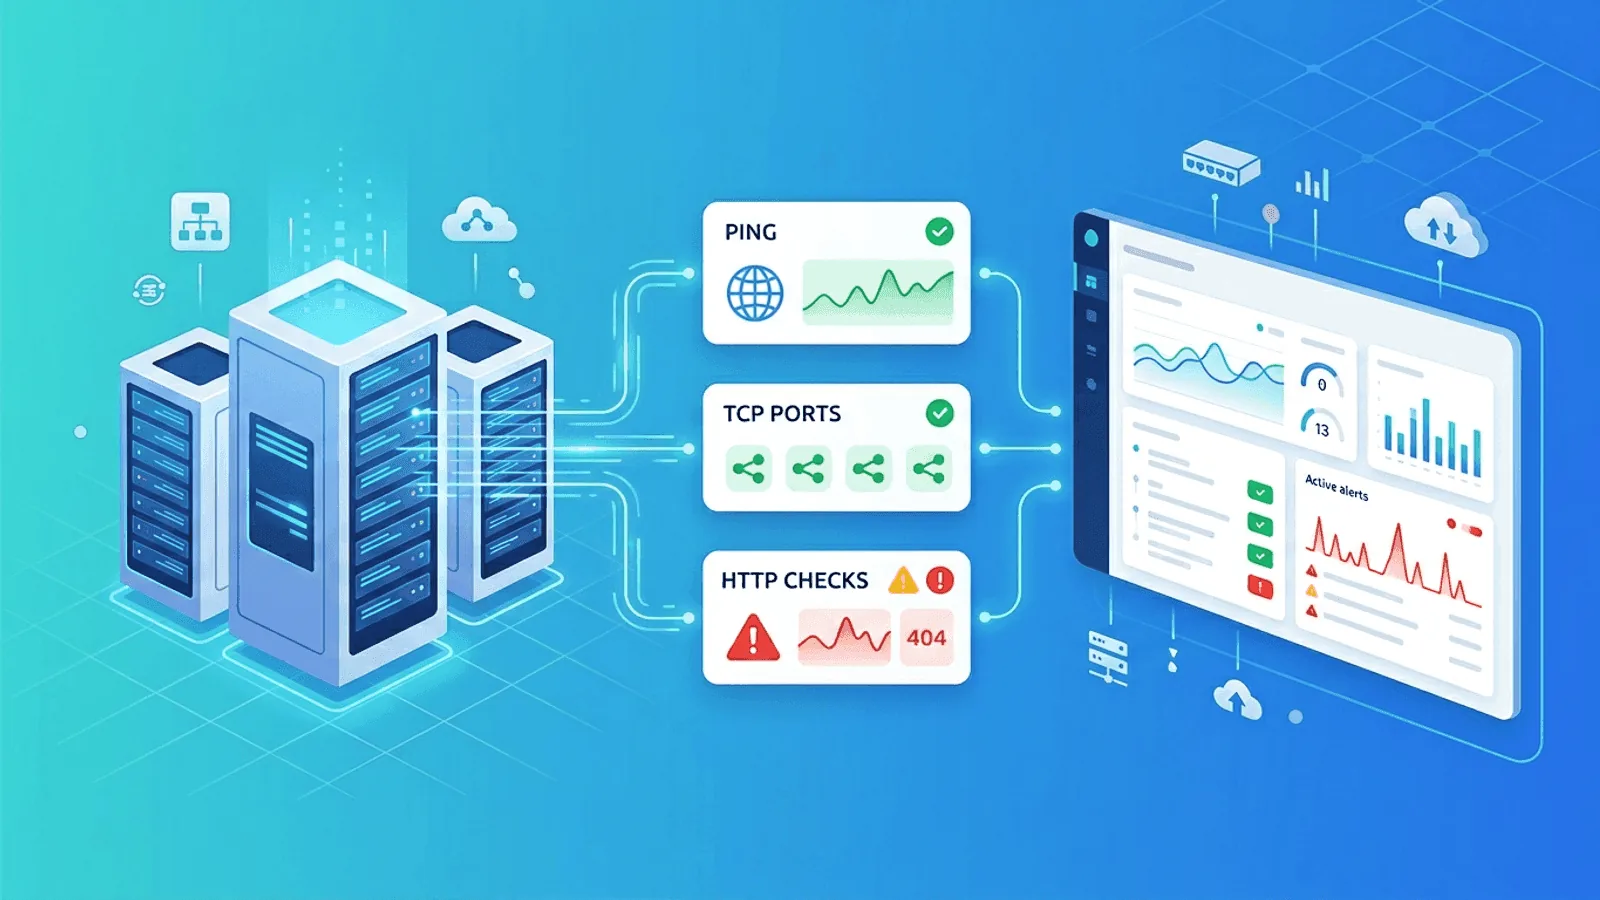
That means good server monitoring is not one single check. It is a stack of checks that cover different layers of failure.
The Server Monitoring Stack
Layer 1: Reachability
Can the host be reached at all?
This is usually monitored with:
- Ping / ICMP monitoring
- Basic network reachability tests
This catches host-level or network-level outages quickly.
Layer 2: Port availability
Is the service port open and accepting connections?
This is usually monitored with:
- TCP port checks
This catches issues where the server is online but the service you care about is not listening anymore.
Layer 3: Application response
Is the application actually returning the right response?
This is usually monitored with:
- HTTP / HTTPS checks
- Content validation
- API health checks
This catches failures where the host and port are both technically up, but the application is broken.
Layer 4: Timing and trend changes
Is the server or application getting slower before it fails?
This is usually monitored with:
- Response time tracking
- Alert thresholds
- Anomaly detection
This catches degradation before it becomes a visible outage.
Start With External Checks
One of the most common mistakes in server monitoring is relying only on internal dashboards.
If your monitoring runs only from inside the server or inside the same private network, it can miss the most important failure mode: users can no longer reach the service from the outside.
External checks matter because they tell you what the outside world sees:
- DNS resolution failures
- Firewall mistakes
- Load balancer issues
- SSL certificate problems
- Routing problems between regions
- Application responses that look fine internally but fail externally
This is why uptime and reachability checks should come first.
Check Type 1: Ping Monitoring
Ping monitoring uses ICMP to test whether a server is reachable at the network layer.
What ping tells you
- Whether the host is reachable
- Round-trip latency
- Packet loss trends
What ping does not tell you
- Whether port 443 is open
- Whether the web application works
- Whether a database is accepting queries
Ping is useful, but it is only the first layer.
When ping monitoring is most valuable
- Infrastructure hosts
- Network appliances
- VPN endpoints
- Servers that may be reachable before services are ready
If ping fails, you likely have a host-level or network-level problem.
Check Type 2: TCP Port Monitoring
TCP monitoring checks whether a specific port is open and accepting connections.
Examples:
yourserver.com:22for SSHyourserver.com:443for HTTPSyourserver.com:5432for PostgreSQLyourserver.com:3306for MySQLyourserver.com:6379for Redis
Why TCP checks matter
A server can respond to ping while the actual service is down. For example:
- The web server process crashed
- The database process stopped
- A firewall rule changed
- The application failed to bind to the expected port after restart
Ping would still pass. TCP would fail.
What TCP checks catch well
- Service process down
- Port binding failures
- Host reachable but service unavailable
- Firewall/security group mistakes
This makes TCP monitoring one of the most important checks for infrastructure services.
Check Type 3: HTTP / HTTPS Monitoring
HTTP monitoring checks the full request-response cycle for web applications and APIs.
This is the most useful check for customer-facing services because it reflects what users actually experience.
What an HTTP check can validate
- Status code (200, 301, 503, etc.)
- Response body content
- SSL certificate validity
- Redirect behavior
- Response time
Why HTTP beats simple uptime checks
An application can return HTTP 200 while still being broken. For example:
- It returns a maintenance page instead of the real site
- It returns a generic error message inside a successful response
- The page loads but critical content is missing
Content validation helps here. Instead of only checking for 200, you also check that the response contains an expected string or data pattern.
Common Server Failure Modes
Host unreachable
The server has gone offline, the network path is broken, or an infrastructure provider has an issue.
Best checks: Ping and TCP
Service process crashed
The server is online, but the application or database process is gone.
Best checks: TCP and HTTP
Reverse proxy or web server misconfiguration
Nginx, Apache, or a load balancer is online but routing is broken.
Best checks: HTTP with content validation
SSL certificate expired
The service is technically available, but browsers and clients no longer trust it.
Best checks: SSL monitoring and HTTPS checks
DNS misconfiguration
The service itself works, but the domain no longer resolves correctly.
Best checks: DNS monitoring and HTTP checks
Slow degradation before failure
CPU pressure, disk pressure, connection exhaustion, or upstream dependency problems cause rising latency before an actual outage.
Best checks: Response time tracking and anomaly detection
What to Monitor First
If you are starting from scratch, begin with the checks that catch the most expensive failures.
For a basic web server
- Ping or reachability check on the host
- TCP check on port 443
- HTTP or HTTPS check on the main URL
- SSL certificate monitoring
For an API server
- TCP check on the public port
- HTTP check on an API health endpoint
- Content validation for expected response body
- Response time alerts
For a database or internal service host
- Ping check on the host
- TCP checks on database ports
- Heartbeat checks for scheduled jobs that depend on the host
This setup covers the majority of real-world downtime scenarios without overcomplicating your stack.
A Simple Monitoring Setup by Server Type
Public website server
- Ping check
- TCP 443 check
- HTTPS homepage check
- Content validation on the homepage
- SSL expiry alert
Application server
- Ping check
- TCP 80/443 or app port check
- API health endpoint check
- Response time alert
Database server
- Ping check
- TCP 3306 / 5432 / 6379
- Application-level health endpoint that verifies query success
Worker or job server
- Ping check
- Heartbeat monitoring for scheduled tasks
- Optional TCP check for any exposed control port
How Often Should You Check?
For production systems, a good default is:
- Every 1 minute for HTTP, HTTPS, and TCP checks
- Every 1 minute or 5 minutes for ping, depending on sensitivity
- Daily or weekly for slower-moving checks like certificate review windows
Longer intervals reduce noise and cost, but they also increase detection delay.
If your checks run every 5 minutes, you may not even know an outage started until minute 4 or 5. For customer-facing systems, that is usually too slow.
Avoiding False Positives
Good monitoring is not just about detecting outages. It is also about avoiding noisy alerts.
Require consecutive failures
A single failed check can be a temporary network blip. Alerting after 2 or 3 consecutive failures filters most of that noise.
Check from multiple regions
If only one location sees a problem, that may be an issue with the monitoring node or a regional routing glitch. Multi-region validation increases confidence that the outage is real.
Use the right check for the right layer
Don't use ping to decide whether your web app is healthy. Don't use an HTTP homepage check to decide whether your database port is reachable. Match the check type to the problem you want to detect.
When Internal Metrics Matter
This guide focuses on uptime and reachability, but internal metrics still matter.
Once your external basics are in place, add internal visibility for:
- CPU saturation
- Memory pressure
- Disk usage
- Load average
- Process count
- Database connection usage
- Queue depth
These metrics are best for diagnosis and trend analysis. External monitoring is still what tells you first that users are actually impacted.
How Webalert Helps With Server Monitoring
Webalert covers the practical external checks most teams need first:
- Ping monitoring for host reachability
- TCP port monitoring for services like SSH, databases, mail, and app ports
- HTTP and HTTPS monitoring for websites and APIs
- Content validation to catch broken pages that still return 200
- SSL monitoring for expiry and trust issues
- Response time tracking for early warning on degradation
- Heartbeat monitoring for background jobs and scheduled tasks
- Multi-region checks to reduce false positives and detect regional failures
- Alerting to email, SMS, Slack, Discord, Teams, and webhooks
- On-call scheduling and escalation so the right person is notified fast
That gives you the outside-in view of your servers without requiring a complex internal observability stack on day one.
See features and pricing for the full details.
Quick Server Monitoring Checklist
- Add a ping check for the server host
- Add TCP checks for every critical port
- Add HTTP or HTTPS checks for customer-facing services
- Enable content validation for critical pages or endpoints
- Set response time thresholds
- Enable SSL monitoring if the service uses HTTPS
- Add heartbeat monitoring for scheduled jobs
- Route critical alerts to the right person with escalation
This checklist catches the most common server failures with minimal setup.
Summary
- Server monitoring is a stack, not a single check
- Ping checks answer "is the host reachable?"
- TCP checks answer "is the service port accepting connections?"
- HTTP checks answer "is the application actually working?"
- Response time monitoring catches degradation before full outages
- External monitoring should come first because it reflects what users really experience
If your current setup only tells you that a server exists, but not whether users can actually use it, you do not have enough monitoring yet.