Your Laravel app passes all tests. The deployment completes without errors. Forge or Envoyer shows a green status.
But the queue worker crashed 20 minutes ago. Password reset emails are stuck. Order confirmations are not sending. The scheduler stopped running and daily reports are missing. None of this triggers an HTTP error because the web layer is fine.
Laravel applications have components that run outside the request-response cycle — queues, scheduled tasks, background jobs, and WebSocket servers. A healthy homepage does not mean these components are working.
This guide covers what to monitor in a production Laravel app so you catch failures across every layer, not just the web routes.
Why Laravel Monitoring Needs More Than Uptime Checks
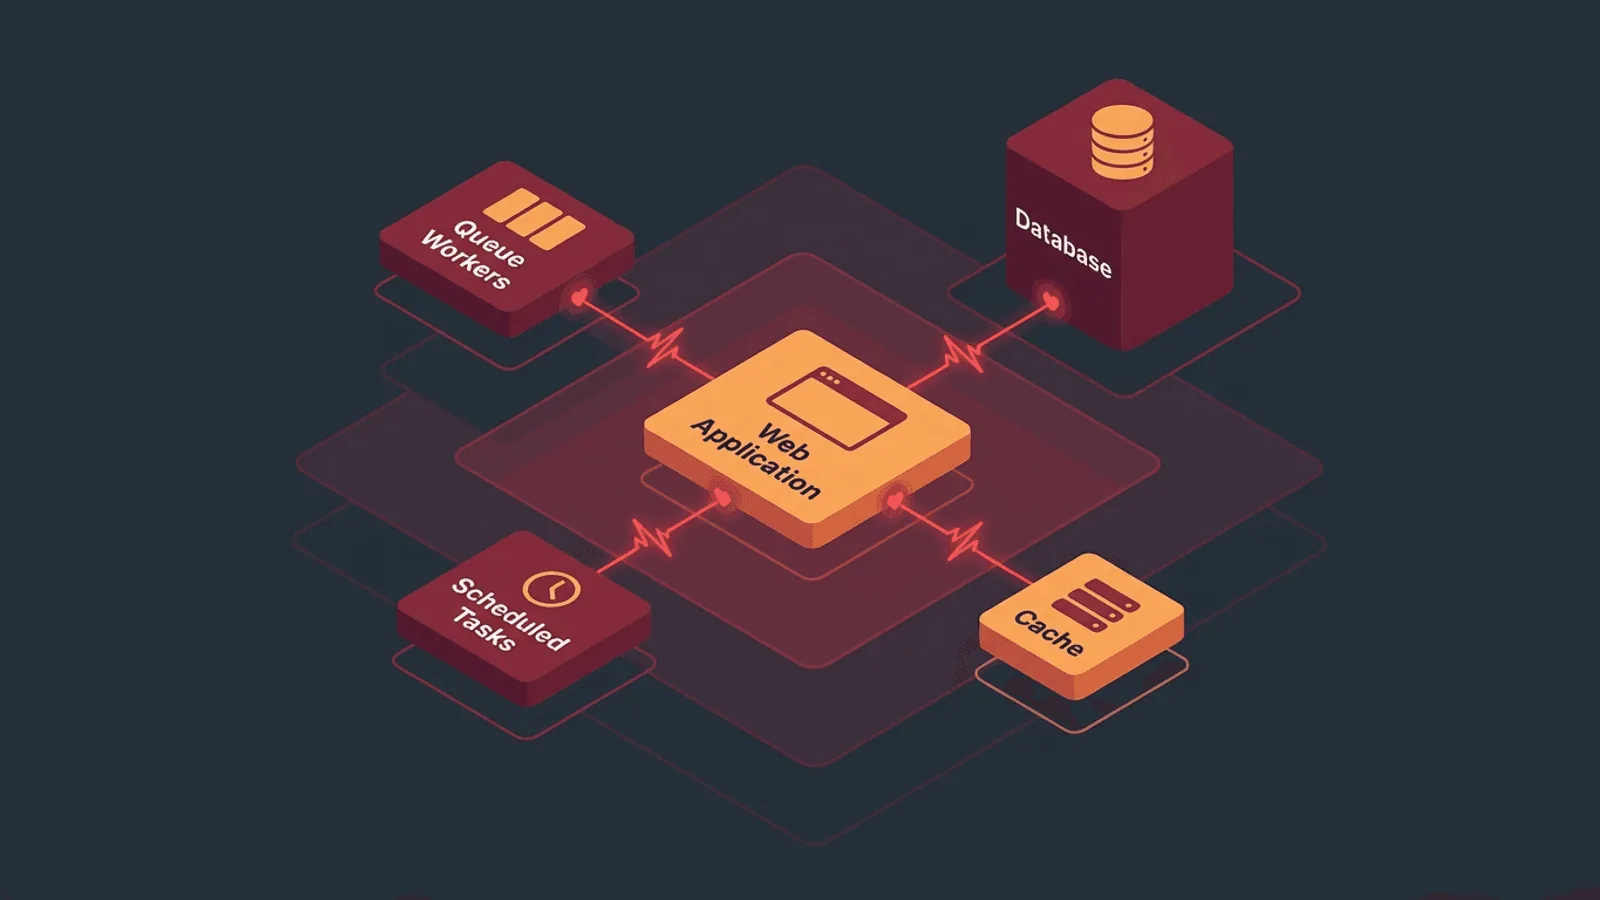
A typical Laravel app has multiple moving parts:
- Web routes — The HTTP layer users interact with
- Queue workers — Background job processing (emails, notifications, data syncing)
- Task scheduler —
php artisan schedule:runexecuting periodic tasks - Cache — Redis or Memcached storing sessions and application cache
- Database — MySQL, PostgreSQL, or SQLite
- WebSocket server — If using Laravel Echo or Reverb for real-time features
- File storage — Local disk or cloud storage (S3) for uploads
Each of these can fail independently. A basic HTTP uptime check on your homepage only validates the first item in that list.
What to Monitor
1) Web Routes and API Endpoints
The foundation — verify your app responds to HTTP requests:
- Homepage or primary landing page — Content validation, not just status code
- Login page — Verify the authentication flow renders correctly
- Key API endpoints — Test critical routes that power your frontend or integrations
- Health check endpoint — A dedicated route that tests internal dependencies
A proper health check endpoint in Laravel tests more than "the framework boots":
Route::get('/health', function () {
    try {
        DB::connection()->getPdo();
        Cache::store()->get('health-check');

        return response()->json([
            'status' => 'healthy',
            'timestamp' => now()->toISOString(),
        ]);
    } catch (\Exception $e) {
        return response()->json([
            'status' => 'unhealthy',
            'error' => $e->getMessage(),
        ], 503);
    }
});
Monitor this endpoint with response body validation — check that the response contains "status":"healthy", not just that it returns 200.
2) Queue Workers
Queue failures are the most common invisible issue in Laravel apps. When the queue worker stops:
- Emails stop sending
- Notifications are not delivered
- Background data processing halts
- Webhook handlers stop executing
- Anything dispatched with
dispatch()sits in the queue forever
How to monitor queues with heartbeat monitoring:
Add a scheduled job that pings a heartbeat endpoint every few minutes:
// In app/Console/Kernel.php
$schedule->call(function () {
    Http::get('https://heartbeat.web-alert.io/your-queue-heartbeat-id');
})->everyFiveMinutes()->onOneServer();
Dispatch this as a queued job to verify the entire queue pipeline works:
// A job that sends the heartbeat
class QueueHeartbeat implements ShouldQueue
{
    public function handle(): void
    {
        Http::get('https://heartbeat.web-alert.io/your-queue-heartbeat-id');
    }
}

// Schedule it
$schedule->job(new QueueHeartbeat)->everyFiveMinutes();
If the heartbeat does not arrive on schedule, the queue worker is down or stuck.
3) Task Scheduler
Laravel's scheduler runs via a single cron entry: * * * * * php artisan schedule:run. If this cron stops, every scheduled task stops.
Monitor the scheduler with a heartbeat:
$schedule->call(function () {
    Http::get('https://heartbeat.web-alert.io/your-scheduler-heartbeat-id');
})->everyFiveMinutes();
This verifies the cron entry is running, the artisan command can execute, and the scheduler itself is healthy.
4) Database Connectivity
Laravel's database layer can fail from:
- Connection pool exhaustion under load
- Database server running out of disk space
- Slow queries degrading performance
- Replication lag on read replicas
- Migration left the database in an inconsistent state
The health endpoint above covers basic connectivity. Additionally:
- Response time monitoring — Database slowness shows up as increased HTTP response times
- API endpoint validation — Monitor data-driven endpoints that query the database
5) Cache Health
If your Laravel app uses Redis or Memcached for sessions or caching:
- A cache failure can cause every request to hit the database directly, causing a cascade
- Session store failure logs out all users simultaneously
- Rate limiter failure (if backed by cache) can allow or block requests incorrectly
Include cache in your health check endpoint. Monitor response time to detect cache misses causing database load.
6) SSL and Domain
- SSL certificate monitoring — Alert before expiry, especially on apps with custom domains
- DNS monitoring — Verify domain resolution
- HTTPS redirect — Confirm HTTP redirects to HTTPS correctly
7) Post-Deployment Validation
Laravel deployments (via Forge, Envoyer, or CI/CD) can fail silently:
composer installfails on a dependency- Migration fails but the app still serves old cached views
.envvariables missing in the new deployment- Queue workers not restarted after deploy
- Cache not cleared, serving stale routes
After every deployment:
# In your deploy script
php artisan migrate --force
php artisan config:cache
php artisan route:cache
php artisan queue:restart

# Validate the app is working
curl -sf https://yourapp.com/health || exit 1

# Signal deploy complete
curl -fsS https://heartbeat.web-alert.io/your-deploy-heartbeat-id
Common Laravel Failure Modes
| Failure | User Impact | Detection |
|---|---|---|
| Queue worker crashed | Emails, notifications, jobs stop processing | Heartbeat monitoring on queue job |
| Scheduler cron missing | Scheduled tasks stop running | Heartbeat monitoring on scheduler |
| Database connection exhausted | 500 errors on dynamic pages | Health endpoint check + HTTP monitoring |
| Cache (Redis) down | Slow pages, session loss, rate limit failure | Health endpoint + response time alerts |
.env misconfigured after deploy |
Partial functionality, broken integrations | HTTP check + content validation post-deploy |
| Storage disk full | File uploads fail, logs stop writing | Health endpoint + error monitoring |
| Migration failed | Database schema mismatch, 500 errors | Post-deploy health check |
| SSL certificate expired | Browser blocks the site | SSL monitoring |
| Horizon not running (if used) | Queue jobs not processed despite worker config | Heartbeat from Horizon-supervised job |
| Broadcasting server down | Real-time features stop working | TCP port check on WebSocket port |
Monitoring by Hosting Setup
Laravel Forge
Forge manages your server but does not monitor your application:
- HTTP checks on all public routes
- Heartbeat for queue workers and scheduler
- SSL monitoring (Forge auto-renews, but verify)
- Response time alerts for performance regressions
- Post-deploy webhook to trigger validation checks
Laravel Vapor (Serverless)
Vapor runs on AWS Lambda, adding serverless-specific concerns:
- HTTP checks with content validation (cold start latency is expected)
- Queue monitoring via heartbeat (SQS queues can back up)
- Response time alerts with serverless-appropriate thresholds
- Environment variable validation post-deploy
Self-Hosted / Docker
- TCP port check on the web server port
- HTTP checks on all public routes
- Process monitoring — Verify PHP-FPM, Nginx, queue workers are running
- Heartbeat for queue and scheduler
- Database port check if running locally
- Disk and resource monitoring
Practical Setup
Minimum for every Laravel app
- HTTP check on homepage — 1-minute interval with content validation
- HTTP check on /health — Validate database and cache connectivity
- Heartbeat for queue worker — Dispatched job pings every 5 minutes
- Heartbeat for scheduler — Scheduled callback pings every 5 minutes
- SSL monitoring on all domains
Comprehensive setup
All of the above, plus:
- HTTP checks on critical API routes — With response body validation
- Post-deploy validation — Automated health check after each deployment
- Response time alerts — Detect database or cache performance regressions
- Multi-region checks — Verify the app works globally
- DNS monitoring — Catch domain resolution issues
- TCP port check on database — If database is separately hosted
How Webalert Helps
Webalert monitors your Laravel application across every layer:
- HTTP checks every 60 seconds from global regions — catch web layer failures fast
- Content validation — verify pages return correct content, not error screens
- Heartbeat monitoring — track queue workers and scheduled tasks
- SSL monitoring — catch certificate issues before they block users
- Response time tracking — detect database and cache performance regressions
- DNS monitoring — verify domain resolution
- Multi-channel alerts — Email, SMS, Slack, Discord, Teams, webhooks
See features and pricing for details.
Summary
- Laravel apps have components outside the request cycle — queues, scheduler, cache — that fail silently.
- HTTP uptime checks only cover the web layer. Use heartbeat monitoring for queue workers and the task scheduler.
- A dedicated
/healthendpoint should test database and cache connectivity, not just framework boot. - Monitor deployments with post-deploy validation to catch missing env vars and failed migrations.
- SSL, DNS, and response time monitoring catch infrastructure-level issues.
- Start with homepage + health endpoint + queue heartbeat + scheduler heartbeat + SSL.
Your routes handle requests. Monitoring proves the entire application is working.