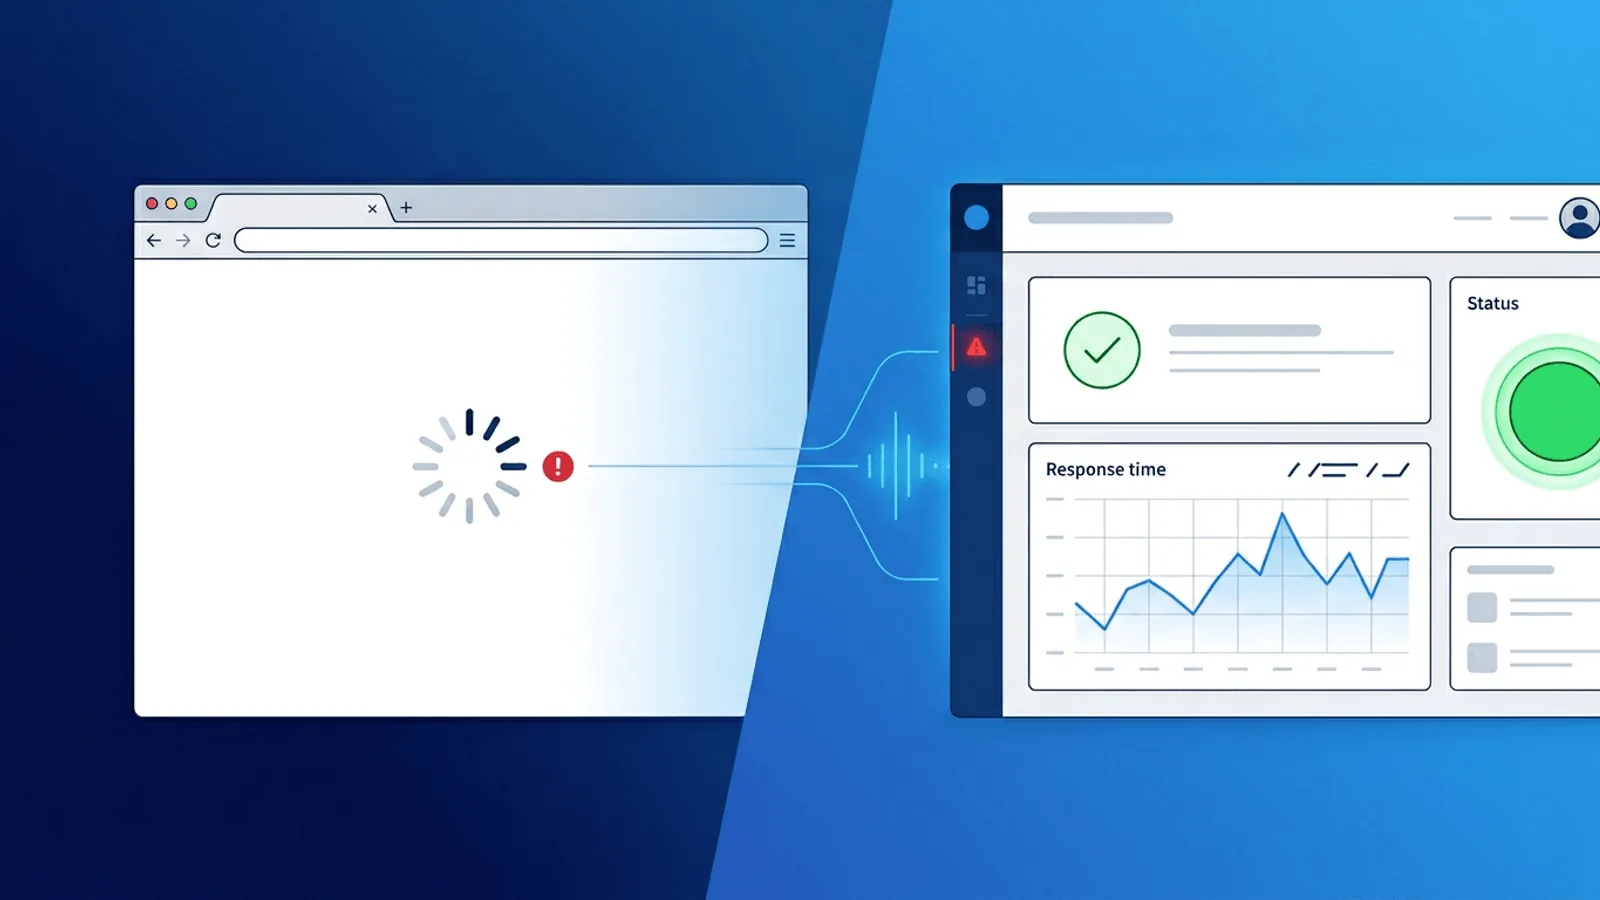
A single-page application can return 200 OK while every user sees a blank screen. Detecting that failure requires more than an HTTP probe: monitor the HTML shell, APIs and versioned assets separately, then run a real browser check that executes JavaScript and proves a critical flow works.
This guide shows how to layer cheap availability checks, browser synthetics, and real-user monitoring for React, Vue, Angular, and similar client-rendered applications.
Why SPAs Break Differently
In a traditional server-rendered application, the server builds the full HTML page. If the server fails, the response is a 500 error. Monitoring catches it immediately.
In a SPA:
- Server sends a minimal HTML shell (almost always 200 OK)
- Browser downloads JavaScript bundles
- JavaScript executes and renders the UI
- UI makes API calls to fetch data
- Data renders into the page
Failure can happen at any step after 1, and step 1 still returns 200. This means:
- Bundle download fails — CDN issue, cache invalidation problem, or deployment mismatch. Status: 200. Page: blank.
- JavaScript execution error — Runtime exception, missing polyfill, browser incompatibility. Status: 200. Page: white screen or error boundary.
- Hydration failure — SSR/SSG frameworks like Next.js can deliver HTML that fails to hydrate client-side. Status: 200. Page: static but non-interactive.
- API dependency fails — The shell loads but data endpoints return errors. Status: 200. Page: empty states or broken layouts.
- Auth token expired — User session invalid, redirect loop, or infinite loading spinner. Status: 200. Page: unusable.
A monitoring tool that only checks HTTP status codes will report "up" for all of these.
What to Monitor in a SPA
1) Validate the HTML Shell
The single most important change: validate that the response body contains expected content.
An HTTP response-body check does not execute JavaScript. Use it to verify that the server delivered the expected shell:
- The expected root element and current asset references
- Required configuration or build-version markers
- Absence of server-rendered error pages or empty responses
This catches bad HTML deployments and missing build metadata, but not JavaScript execution failures. Use a browser synthetic for rendered UI.
2) Key API Endpoints
SPAs depend on APIs for data. Monitor the critical ones directly:
- Authentication endpoint (login, token refresh)
- Primary data endpoint (dashboard data, user profile, product listing)
- Health or status endpoint if available
If the API is down, the SPA shell loads but the app is functionally broken. Monitoring both the page and its API dependencies gives you full coverage.
Use the API uptime monitoring guide to define status, schema, authentication, and latency assertions.
3) JavaScript Bundle Availability
Your SPA's JavaScript bundles are usually served from a CDN or static host. If they are unavailable, the app cannot render.
Monitor:
- The main bundle URL (check that it returns 200 with correct Content-Type)
- Critical chunk URLs if you use code splitting
After deployments, old chunk URLs may 404 if users have cached HTML pointing to previous bundle hashes. This is a common SPA failure mode.
4) Client-Side Route Checks
SPAs use client-side routing. A URL like /dashboard or /settings does not correspond to a server-side route — the server returns the same HTML shell for every path.
This means:
- A broken route handler returns 200 with an empty or error view
- Navigation between routes can fail without any server-side signal
- Deep links can break after deployments if route configuration changes
Monitor key routes by requesting them and validating that route-specific content appears in the response. For SSR/SSG apps (Next.js, Nuxt), the server pre-renders route content — validate that the expected content is present.
5) Authentication Flows
SPAs handle authentication client-side. Monitor:
- Login page renders correctly
- Token refresh endpoint responds
- Protected routes redirect properly when unauthenticated
Auth failures in SPAs often manifest as infinite redirect loops or perpetual loading spinners — both invisible to status-code-only checks.
Run One Browser Check for the Critical Journey
Use Playwright, WebDriver, or a managed browser monitor to load the page as a user would:
- Open a clean browser context with no cached assets or session.
- Navigate to a critical deep link, not only
/. - Wait for a stable user-visible element such as the dashboard heading.
- Fail on uncaught page errors, failed critical requests, or a known error boundary.
- Perform one valuable action—search, add to cart, or open account settings.
- Record a screenshot, console output, and failed-request list on failure.
Keep the journey short and deterministic. Browser checks are slower and more brittle than HTTP checks, so use them for rendering and interaction while direct API and asset probes provide fast diagnosis. The transaction monitoring guide covers multi-step design in more detail.
SPA Failure Modes and Detection
| Failure Mode | What Users See | Detection Method |
|---|---|---|
| Bundle download failure | Blank white page | Browser synthetic + direct asset probe |
| JavaScript runtime error | White screen or error boundary | Browser synthetic + client error telemetry |
| Hydration failure (SSR) | Static page, no interactivity | Browser interaction assertion |
| API dependency down | Empty data, broken layouts | Direct API endpoint monitoring |
| CDN outage | Slow or failed asset loading | Bundle URL monitoring + response time |
| Stale chunk after deploy | ChunkLoadError for some users | Monitor versioned chunk URLs post-deploy |
| Auth token expiry | Redirect loops, login failures | Auth endpoint monitoring + content validation |
| CORS misconfiguration | API calls blocked, data missing | API endpoint checks from external origin |
| Environment variable missing | App renders with broken config | Content validation for config-dependent UI |
Framework-Specific Tips
React (Create React App, Vite)
- Check for the root element content: if
<div id="root"></div>is empty, the app failed to mount - Monitor for React error boundary messages in production builds
- After deployments, verify that hashed bundle URLs resolve
Next.js / Remix (SSR/SSG)
- Pre-rendered pages should contain full HTML content — validate it
- Monitor both the page response and the
/_next/data/API routes - Check that ISR (Incremental Static Regeneration) pages are fresh
- Verify middleware redirects work correctly after deployment
Vue / Nuxt
- Check for the
<div id="app">mount point containing rendered content - For Nuxt, validate SSR output includes route-specific data
- Monitor
/_nuxt/asset paths after deployments
Angular
- Verify the
<app-root>element contains rendered content - Monitor lazy-loaded module chunk availability
- Check that service worker updates do not serve stale shells
Practical Setup: 15-Minute Version
For immediate coverage of a SPA:
- Homepage check with content validation — Verify your app name or a known UI element appears in the response body. Run every minute from multiple regions.
- Critical API endpoint check — Monitor your primary data API with auth headers. Validate response shape.
- Auth endpoint check — Verify login or token refresh returns expected response.
- Post-deploy bundle check — After each deployment, confirm the new main bundle URL resolves.
- Response time alert — Set a threshold at 2-3x your normal p95. SPAs with slow bundles degrade UX before they fully break.
This catches blank pages, API outages, auth failures, and broken deployments.
How Webalert Helps
Webalert catches the SPA failures that status-code-only tools miss:
- Content validation — Check that response bodies contain expected text, catching blank pages and render failures
- HTTP/HTTPS checks with custom headers for authenticated routes
- Response time monitoring — Detect slow bundle loading and API latency
- Multi-region checks — Catch CDN and routing issues that affect specific geographies
- Heartbeat monitoring — Verify build and deployment pipelines complete
- Multi-channel alerts — Email, SMS, Slack, Discord, Teams, webhooks
- Status pages — Communicate frontend incidents clearly to users
See features and pricing for details.
For implementation details, continue with Core Web Vitals monitoring and synthetic monitoring versus RUM.
Primary Sources
- Playwright: Writing tests — browser navigation, locators, and user-visible assertions.
- MDN: Performance APIs — browser performance measurement primitives.
- web.dev: Web Vitals — current LCP, INP, and CLS field-performance guidance.
- W3C: Navigation Timing Level 2 — normative navigation timing model.
Summary
- SPAs return 200 OK even when completely broken — status code checks are insufficient.
- Use content validation to verify the app actually renders expected UI.
- Monitor critical API endpoints that the SPA depends on for data.
- Check JavaScript bundle availability, especially after deployments.
- Validate key client-side routes, not just the homepage.
- Monitor authentication flows for redirect loops and token failures.
- Start with 4-5 targeted checks: homepage with content validation, primary API, auth endpoint, bundle URL, and response time threshold.
The best SPA monitoring verifies what users see, not what the server sends.