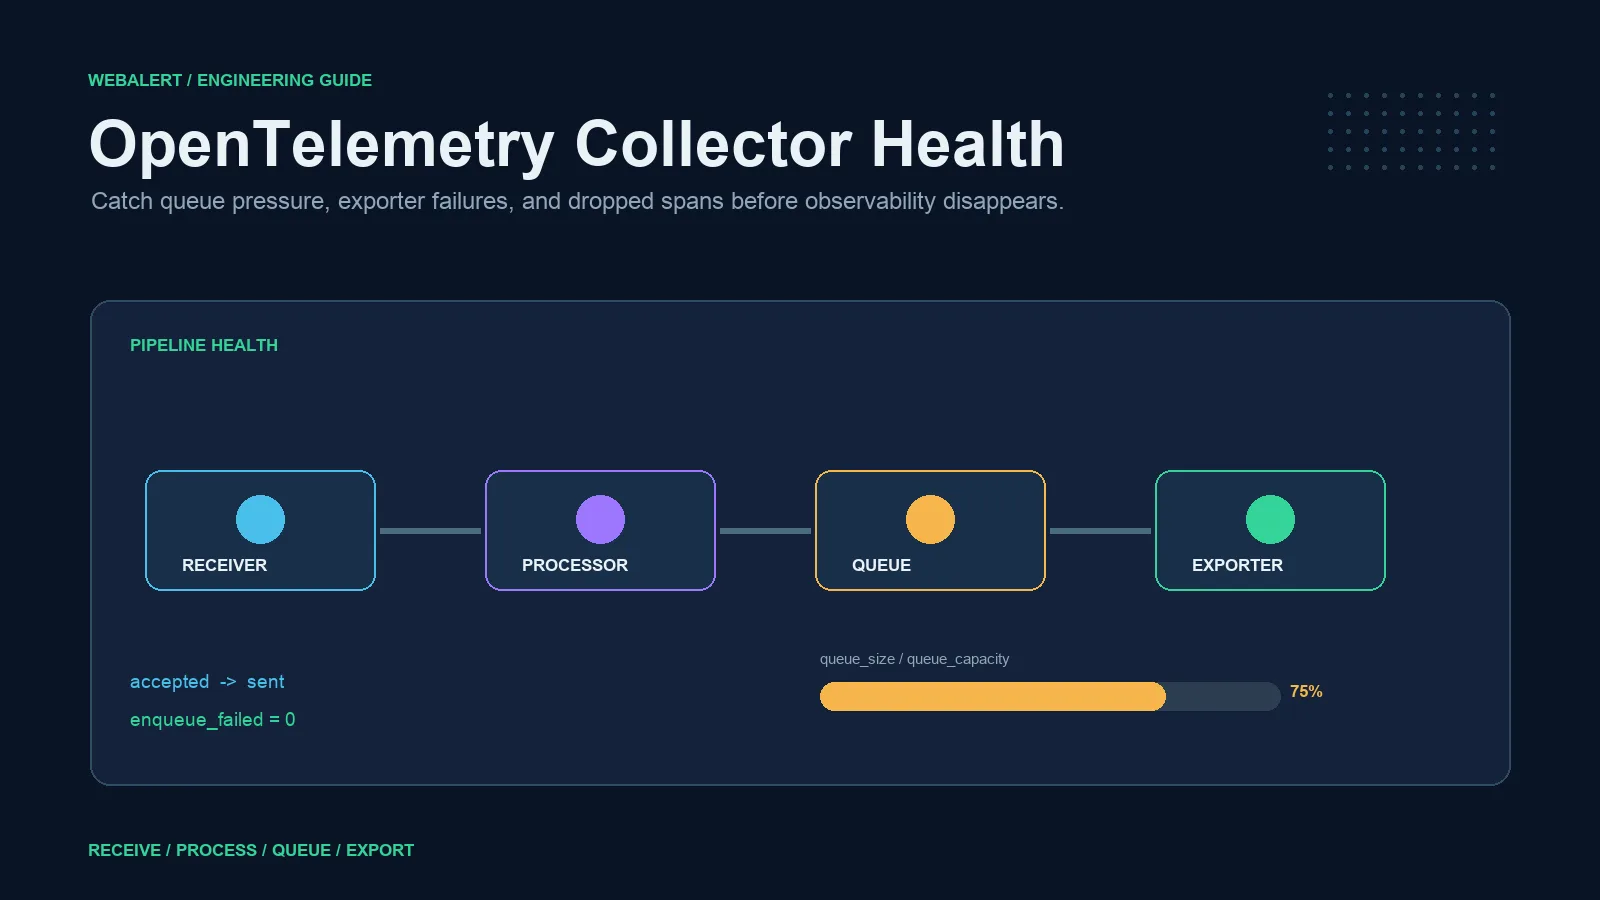
Short answer: Monitor the OpenTelemetry Collector as a pipeline: accepted telemetry in, refused or dropped telemetry, queue utilization, export successes and failures, process resources, and end-to-end arrival. Alert on sustained loss or queue saturation with traffic context, not every retry. OpenTelemetry defines the Collector as the component that receives, processes, and exports data in its official overview; see the full OpenTelemetry production guide.
Your application can be healthy, your backend can be reachable, and your observability dashboard can still be lying by omission. An OpenTelemetry Collector accepts spans, metrics, and logs, queues them, processes them, and exports them to a backend. If the exporter slows down, the queue fills, the memory limiter refuses data, or the Collector itself becomes unreachable, telemetry disappears at the exact moment you need it most.
OpenTelemetry Collector monitoring is the practice of watching the Collector's own internal telemetry so you know whether data is being received, processed, queued, exported, or dropped. The general OpenTelemetry monitoring guide explains the signals in the wider observability stack; this guide focuses on the Collector as a production dependency and the metrics that reveal pipeline health before a missing trace becomes a missing diagnosis.
The most important idea is simple: monitor the gaps between pipeline stages, not just the application signals downstream. A backend showing fewer spans does not tell you whether traffic fell, instrumentation broke, the Collector dropped data, or the exporter cannot reach its destination. The Collector's internal metrics can distinguish those cases.
The Collector pipeline in one view
An OpenTelemetry Collector pipeline normally has four logical stages:
- Receiver — accepts telemetry from applications, agents, or another Collector.
- Processor — batches, filters, samples, enriches, or limits data.
- Exporter — sends telemetry to a backend, queue, or another service.
- Queue and retry layer — buffers data when the destination is temporarily slow or unavailable.
The topology can be more complex than this: multiple pipelines may process traces, metrics, and logs separately; gateways may fan out to several backends; and tail sampling may hold spans until a trace is complete. But the health questions remain the same:
- Is the Collector receiving the volume we expect?
- Is a processor refusing or dropping data?
- Is the exporter sending what it receives?
- Is the queue growing?
- Is the destination rejecting or delaying exports?
- Is the Collector itself running out of memory or restarting?
Answer those questions continuously and you can tell the difference between a quiet application and a broken telemetry pipeline.
The internal metrics that matter
The Collector exposes internal metrics when its telemetry is configured. Metric names can vary slightly by Collector version and signal type, so confirm the exact names in the version you run. The most useful families are:
Receiver acceptance and refusal
otelcol_receiver_accepted_spans, otelcol_receiver_accepted_metric_points, and otelcol_receiver_accepted_log_records show how much data enters a pipeline. Their refused counterparts show data rejected at the receiver boundary.
Use these as the first reference point. If receiver acceptance drops at the same time application traffic is steady, investigate instrumentation, network reachability, receiver limits, or the Collector itself.
Exporter sent and failed data
otelcol_exporter_sent_spans, otelcol_exporter_sent_metric_points, and otelcol_exporter_sent_log_records show successful export. otelcol_exporter_send_failed_* counters show attempts that failed because the destination rejected the request, the network failed, or the export timed out.
An increase in send failures is a destination or exporter problem even if the Collector process is still healthy. Look at the failure rate by exporter and signal rather than only creating one global counter.
Queue size and capacity
otelcol_exporter_queue_size is the current number of queued batches. otelcol_exporter_queue_capacity is the configured maximum. The useful signal is the ratio:
queue utilization = queue_size / queue_capacity
When utilization stays above roughly 60–70%, the exporter is not keeping up with the incoming rate or the backend is recovering slowly. At 80% and above, data loss is near if the condition persists. The exact threshold depends on burst size, retry policy, memory limits, and the time your team can tolerate delayed telemetry.
Queue utilization is an early-warning signal. A queue at 95% is not the first moment to investigate; it is the last visible stage before enqueue failures begin.
Enqueue failures
otelcol_exporter_enqueue_failed_spans and its metric and log equivalents count data that could not enter the sending queue. A non-zero rate means the queue or pipeline rejected data before the exporter could send it. This is data loss, not merely latency.
Alert on the rate and total increase. A queue can recover after a short backend blip, but an enqueue-failure counter should still create an incident or at least a high-priority event because the missing telemetry cannot be reconstructed by a later retry.
Processor refusals and drops
The memory_limiter processor can refuse telemetry when the Collector approaches its memory thresholds. Sampling, filtering, batch shutdown, and other processors can also affect signal counts. Track otelcol_processor_refused_* and the relevant dropped or filtered counters for each pipeline.
Processor drops are not automatically bad — intentional sampling is expected — but unexpected changes are. A tail-sampling rule that suddenly drops every trace is an outage in observability even if the Collector's CPU and memory look normal.
Build a receiver-to-exporter coverage check
The most useful dashboard view compares the flow through the pipeline:
| Stage | Signal | What a gap suggests |
|---|---|---|
| Application into Collector | receiver_accepted_* |
Instrumentation or receiver reachability issue |
| Processor output | processor accepted/refused/dropped metrics | Sampling, filtering, or memory pressure |
| Export queue | queue_size / queue_capacity |
Backpressure or slow destination |
| Export success | exporter_sent_* |
Healthy delivery |
| Export failure | exporter_send_failed_* |
Backend, network, or credentials problem |
| Data backend | spans/logs/metrics received | Destination ingestion or indexing issue |
Do not compare raw cumulative counters without converting them into rates over the same window. A receiver may accept 100,000 spans while the exporter sends 90,000 because the Collector is still draining a queue; that is different from a steady-state 10% loss. Use rate, ratio, and queue age together.
A basic delivery ratio for a stable interval is:
export ratio = rate(exporter_sent_spans[5m])
               / rate(receiver_accepted_spans[5m])
Interpret it with care when sampling or filtering is configured. The ratio should be explained by known processors; an unexplained drop is the alert.
Queue health and backpressure alerts
Queue alerts should distinguish early pressure from actual data loss:
Warning: queue pressure
Alert when queue_size / queue_capacity stays above 0.7 for five minutes. This usually means the exporter cannot keep up, the backend is slow, or the Collector needs more consumers. It is an opportunity to scale or fix the destination before data is rejected.
High: export failures
Alert when rate(otelcol_exporter_send_failed_spans[5m]) is above zero for a sustained window, especially when it is isolated to one exporter. Include the exporter name, signal type, destination, and recent response or timeout logs.
Critical: enqueue failures
Page when rate(otelcol_exporter_enqueue_failed_spans[5m]) is above zero. The queue is full or unavailable and spans are being lost before delivery. The immediate response is to protect the Collector and restore export capacity, not to wait for the backend dashboard to become empty.
Critical: Collector unavailable
Monitor the Collector's own health endpoint or process availability from outside the cluster. Internal telemetry cannot report a failure if the Collector is down or its network path is broken. This is the same reason outside-in monitoring complements application telemetry.
Use consecutive-failure confirmation and multi-region or multi-zone checks where appropriate. A single probe failure can be a network event; a sustained failure from independent locations is an availability incident.
Memory limiter, batching, and queues
Collector components interact. Fixing one metric without understanding the pipeline can make another worse.
Put memory_limiter early
The memory limiter should generally appear early in a pipeline, before components that can expand or buffer telemetry. It protects the process from uncontrolled growth, but when it refuses data, that refusal is an observable loss signal. Set alerts on it; do not hide it by simply increasing the memory limit.
Use sending queues and retry
Exporter queues absorb temporary destination failures. Queued retry can preserve data during short interruptions, but it does not create infinite durability. A queue that remains full will eventually reject data, and an in-memory queue disappears when the Collector restarts. For data that must survive a long outage, use an appropriate durable buffer or Kafka-style architecture rather than treating an in-memory queue as a database.
Tune batch size and consumers together
Large batches can improve throughput but hit backend request limits or create longer latency before data is exported. More consumers can drain a queue faster but also increase backend load and connection pressure. Tune batch timeout, batch size, queue capacity, and consumer count from measured traffic rather than copying defaults.
Be careful with tail sampling
Tail sampling holds spans until enough of a trace is available to make a decision. Scaling collectors without trace-aware load balancing can split a trace across replicas and produce incomplete sampling decisions. Monitor both Collector capacity and trace completeness when you scale a tail-sampling pipeline.
A production dashboard
A useful Collector dashboard has four panels:
- Input and output rate — accepted, refused, sent, and failed by signal and pipeline.
- Queue utilization — current size, capacity, and the oldest pending data if your queue exposes age.
- Data-loss counters — enqueue failures, processor refusals, and receiver refusals.
- Process health — memory, CPU, restarts, scrape availability, and configuration errors.
Add dimensions that help locate ownership: service, pipeline, receiver, processor, exporter, namespace, and cluster. Avoid uncontrolled high-cardinality labels such as raw URLs or user IDs on every metric. The dashboard should answer “which pipeline is losing data?” without becoming another telemetry-cost incident.
Logs remain useful for configuration and lifecycle failures. Search for messages such as queue-full drops, exporter timeouts, authentication failures, and memory-limiter refusals, then correlate them with the internal metrics. Metrics show the shape; logs often show the reason.
Kubernetes deployment considerations
When the Collector runs in Kubernetes, monitor more than the pod's Running state:
- Collector restarts and crash-loop behavior.
- Readiness and liveness probe success.
- CPU throttling and memory pressure.
- Queue utilization per exporter.
- Number of replicas versus incoming load.
- Rolling-update overlap and drain behavior.
- Service discovery and network policy changes.
The Collector can be “up” from Kubernetes' perspective while it is dropping telemetry because the exporter queue is full. Conversely, a readiness failure may be the correct safety behavior while the backend is unavailable. Keep the container health signal separate from pipeline delivery health.
For pod-level context, see Kubernetes monitoring and health checks. For probe design, see health-check endpoint design.
Troubleshooting playbook
When spans disappear, work from the edges inward:
- Confirm application traffic. Did request volume or instrumentation change?
- Check receiver acceptance. If it fell, inspect the OTLP endpoint, service discovery, certificates, and network policy.
- Check processor refusals. Memory pressure, filters, and sampling rules may be rejecting data.
- Check queue utilization. A growing queue points to backpressure, not missing instrumentation.
- Check exporter failures. Look for destination timeouts, authentication, rate limits, or payload-size errors.
- Check the backend. The Collector may send successfully while the backend rejects, indexes slowly, or hides data through sampling.
- Check Collector restarts. In-memory queues and tail-sampling state are lost during a crash.
Do not begin by increasing queue capacity blindly. A larger queue can delay the visible failure while consuming the memory needed to keep the Collector alive. Find the bottleneck first, then change capacity, consumers, batch settings, or backend limits deliberately.
Practical monitoring baseline
- Compare accepted receiver volume with exported volume by signal and pipeline over the same window.
- Alert on queue utilization trend, refused data, permanent export failure, OOM/restarts, and source silence.
- Send a known trace, metric, and log canary through the complete path and verify backend arrival.
How Webalert fits
Internal Collector metrics are the white-box signal for pipeline health. Webalert provides an independent outside-in check for the Collector's public or private health endpoint, OTLP gateway, or observability status endpoint:
- Detect when DNS, TLS, routing, firewall, or load-balancer changes make the Collector unreachable.
- Assert that a health endpoint contains the expected healthy state instead of accepting any 200 response.
- Monitor response time and certificate expiry on the telemetry gateway.
- Keep alerting independent from the backend that may be missing data.
Start uptime monitoring — free. Combine internal otelcol_* metrics for drops and queue pressure with an external check that tells you when the pipeline itself cannot be reached.
Frequently Asked Questions
What should I monitor on an OpenTelemetry Collector?
Monitor receiver accepted and refused telemetry, processor refusals and drops, exporter sent and failed data, exporter queue size and capacity, enqueue failures, memory, CPU, restarts, and the Collector health endpoint. Compare receiver input with exporter output to find unexplained gaps.
How do I detect dropped spans?
Alert on otelcol_exporter_enqueue_failed_spans, receiver refusal counters, processor refusal or drop counters, and persistent exporter send failures. Also compare the rate of receiver-accepted spans with exporter-sent spans, accounting for intentional sampling and filtering.
What does OpenTelemetry Collector queue utilization mean?
Queue utilization is otelcol_exporter_queue_size / otelcol_exporter_queue_capacity. Sustained utilization around 60–70% is an early backpressure warning; utilization near capacity means enqueue failures and telemetry loss may follow. Tune the threshold to your traffic and recovery budget.
Should the Collector health endpoint check the backend?
Keep process liveness shallow so a temporary backend outage does not restart every Collector. Use readiness or separate pipeline-delivery metrics to represent exporter and backend health. Alert on queue pressure and send failures rather than hiding them inside a liveness probe.
Can uptime monitoring detect missing telemetry?
An external uptime check cannot see individual dropped spans. It can detect that the Collector or gateway is unreachable, slow, or returning an unhealthy response. Pair it with the Collector's internal metrics for a complete view of reachability and delivery.