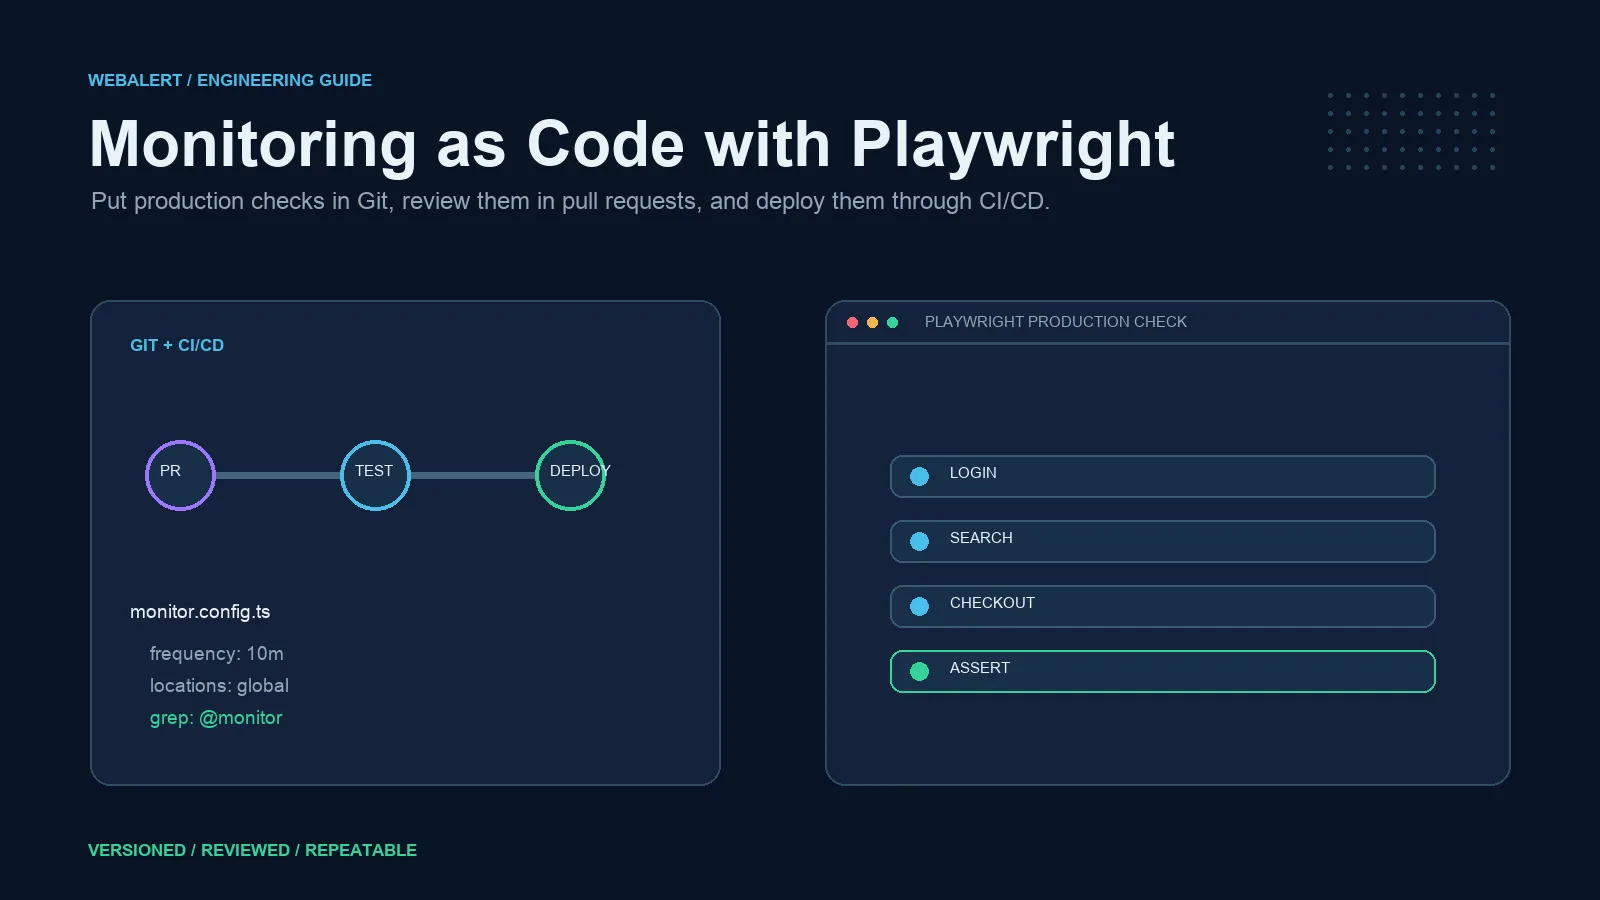
Monitoring as code manages production checks through versioned files, review, automated validation, and controlled deployment. Playwright contributes browser-level proof for a deliberately small set of customer journeys; it does not turn a broad CI regression suite into a reliable production monitor by itself.
With Playwright, the same browser skills used for end-to-end testing can validate a small set of critical production journeys: open the login page, authenticate with a dedicated account, search for a known item, add it to a cart, and verify the confirmation page. A failed run includes the browser evidence needed to diagnose the broken step. The important distinction is not “tests versus monitoring.” It is one-time validation versus continuous production validation.
This guide explains how monitoring as code works, where Playwright fits, which journeys deserve continuous checks, how to structure a repository, and how to prevent test data, selectors, cost, and alerting from turning a useful monitor into operational noise.
What monitoring as code means
Monitoring as code (MaC) means that monitoring configuration is defined in files, stored in version control, reviewed like application code, and deployed through an automated pipeline. Depending on the platform, the repository may contain:
- HTTP and API check definitions.
- Playwright or browser journeys.
- Locations and run frequency.
- Environment-specific variables and secrets references.
- Alert destinations and escalation rules.
- Maintenance windows and ownership metadata.
The benefit is reproducibility. A dashboard-only monitor can be edited by anyone with access, drift away from the application, and disappear from institutional memory. A Git-managed monitor has a history: who changed the selector, which commit changed the checkout flow, when the frequency increased, and which deployment added the alert.
Monitoring as code is not the same thing as running a full end-to-end suite every few minutes. CI tests may cover hundreds of scenarios; production monitors should cover the small set of journeys whose failure would be declared an incident. Keep broad coverage in CI and focused, fast checks in production.
Why Playwright Fits Browser-Level Monitoring
Playwright provides browser automation across Chromium, Firefox, and WebKit, with locators, auto-waiting, screenshots, traces, network controls, and device contexts. Its official guidance covers web-first assertions, continuous integration, and the Trace Viewer. Those capabilities map well to synthetic monitoring:
- Locators express the user action without depending on brittle DOM paths.
- Assertions verify outcomes such as a URL, heading, visible confirmation, or response.
- Traces and screenshots preserve evidence when a check fails.
- Projects and tags let you select only the flows that should run in production.
- Fixtures provide dedicated accounts and reusable setup.
- CI compatibility makes the local-to-production workflow familiar to development teams.
Playwright is not automatically the right answer for every monitor. An HTTP check is faster, cheaper, and more reliable for status, latency, SSL, and response-body validation. Use a browser only when the outcome depends on JavaScript execution, DOM interaction, client-side routing, or a third-party browser integration. This layered approach is the foundation of good synthetic monitoring.
The production monitor lifecycle
A maintainable monitoring-as-code workflow has five stages:
- Author — write a small Playwright test for a critical user journey.
- Validate — run it locally and in CI against a production-like environment.
- Review — inspect the monitor change in the same pull request as the application change when possible.
- Deploy — publish the selected test or suite to the synthetic monitoring provider.
- Operate — alert on confirmed failures, inspect traces, and update the monitor when the product intentionally changes.
The lifecycle matters because a monitor is production software. It has dependencies, credentials, failure modes, release versions, and an owner. “We created a browser check once” is not a monitoring strategy.
Which journeys should run continuously?
Continuous browser monitoring is expensive relative to an HTTP check, so choose flows by business impact:
1. Login
Login is a high-leverage journey for SaaS products. Test a dedicated account, verify that authentication succeeds, and assert that the post-login page renders the expected identity or dashboard marker. Do not use a real customer's account or a user with destructive permissions.
2. Signup
Signup failures are silent conversion failures. Use a disposable or test-domain address, verify the confirmation state, and clean up the account if the flow creates persistent data. If email verification is part of the real path, use a controlled mailbox or test mode rather than waiting on a personal inbox.
3. Search
Search can return a successful page while the underlying index is empty, stale, or unreachable. Search for a stable fixture and verify that the expected result appears. Use test data that is intentionally protected from normal cleanup jobs.
4. Checkout
Checkout is the classic browser-monitoring journey: cart, address, payment test mode, and confirmation. Never run a live charge. Use the provider's test environment or a dedicated zero-value path, and make the flow idempotent so retries do not create duplicate orders.
5. A critical form or workflow
For a booking, support, provisioning, or quote workflow, verify the business outcome rather than only the button click. A click that does nothing can technically succeed in an automation script unless the next state is asserted.
For each journey, write down the user outcome, the data it creates, the cleanup method, the acceptable duration, and the owner before deploying it.
A practical Playwright structure
Keep production journeys separate from broad regression tests. A simple tagging convention makes that explicit:
import { test, expect } from '@playwright/test';

test('@monitor login reaches the dashboard', async ({ page }) => {
  await page.goto(`${process.env.MONITOR_BASE_URL}/login`);
  await page.getByLabel('Email').fill(process.env.MONITOR_EMAIL!);
  await page.getByLabel('Password').fill(process.env.MONITOR_PASSWORD!);
  await page.getByRole('button', { name: 'Sign in' }).click();

  await expect(page).toHaveURL(/dashboard/);
  await expect(page.getByRole('heading', { name: /dashboard/i })).toBeVisible();
});
The important details are the stable @monitor tag, environment-provided credentials, and an outcome assertion. Do not commit secrets. Do not make every test in the repository a production monitor by default.
A production configuration can select only the tagged tests:
import { defineConfig, devices } from '@playwright/test';

export default defineConfig({
  use: {
    baseURL: process.env.MONITOR_BASE_URL,
    trace: 'retain-on-failure',
    screenshot: 'only-on-failure',
  },
  projects: [
    {
      name: 'production-monitors',
      grep: /@monitor/,
      use: { ...devices['Desktop Chrome'] },
    },
  ],
});
The exact deployment syntax varies by monitoring provider. The principle is stable: define a deliberate production subset, keep failure evidence, and make the target environment explicit.
Selectors that survive production changes
The most common source of false alerts is selector drift. A UI refactor changes a CSS class and the monitor starts failing even though users can still complete the journey. Prefer selectors in this order:
- Accessible roles and labels that describe the user action.
- Dedicated
data-testidordata-monitorattributes with an ownership convention. - Stable text when the text is part of the user contract.
- CSS selectors only when they represent a stable semantic boundary.
Avoid selectors such as div:nth-child(3) > button, generated class names, and coordinates. If a component is critical enough to monitor, make its test contract explicit in the markup. A small stable attribute is cheaper than debugging a monitor that breaks on every redesign.
Assertions should also be meaningful. “The button exists” proves less than “the confirmation page contains the order reference.” Assert the result users need, not only the steps the script performed.
Secrets, test data, and side effects
Production browser checks interact with real systems, so test isolation is a reliability requirement:
- Store credentials in the monitoring provider's secret store or CI secret manager.
- Use a dedicated account with the minimum permissions required.
- Use payment-provider test mode or a deliberately non-settling payment path.
- Create unique test identifiers when the journey writes data.
- Clean up records after the assertion, or use a fixture that expires automatically.
- Tag synthetic traffic so analytics and fraud systems can distinguish it from customers.
- Block destructive paths such as account deletion, real email sends, or live refunds.
If a journey cannot be made safe and repeatable, it should not run continuously against production. Keep it in a staging or pre-production test suite and cover production reachability with an HTTP or API check instead.
CI/CD Deployment Patterns and Guardrails
There are three practical ways to deploy monitoring as code:
Deploy monitors from the application pipeline
The application repository contains the Playwright tests and the monitoring configuration. A successful main-branch build publishes the selected monitors. This keeps the monitor and the UI it exercises aligned, but the pipeline needs guardrails so a broken monitor cannot replace the last known-good version.
Use a dedicated monitoring repository
A separate repository owns production checks for many services. This works well for platform teams and agencies, but changes need coordination with application owners. Link the monitor change to the application release and keep ownership metadata next to each flow.
Run a provider CLI in CI
A provider CLI can validate locally, package the selected checks, and deploy them with an API token. Protect the deploy step behind the main branch, require review, and use a dry-run or validation command before publishing.
Whichever model you choose, keep the deployment state observable. Record the monitor version, target environment, last deployment commit, and owner so an on-call engineer can tell whether a failure is an application regression or a stale monitor.
For GitHub Actions, set explicit least-privilege permissions, pin or deliberately update third-party actions, protect the production environment, and prevent untrusted pull-request code from receiving deployment credentials. When the provider supports it, GitHub recommends OpenID Connect for short-lived cloud credentials instead of long-lived secrets. Grant id-token: write only to the job that performs the exchange.
Alert on Customer Impact, Not Test Noise
Browser checks are slower and more failure-prone than HTTP checks, so alert policy matters:
- Require two consecutive failed runs before paging for a single-location check.
- Use multiple locations for customer-facing flows.
- Attach the failing step, screenshot, trace, console errors, and URL to the incident.
- Send a notification when a monitor is disabled or its deployment fails.
- Route checkout failures to the owning team rather than a generic channel.
- Separate monitor maintenance failures from customer-impacting application failures.
- Set a maximum runtime so a hanging browser does not consume every run.
Do not hide every transient failure with retries. One retry can distinguish a short network blip from a real failure; repeated retries can delay detection and mask a broken flow. Combine short retry behavior with consecutive-run confirmation and regional comparison. See alert flapping detection for the broader alerting pattern.
Monitoring as Code Versus CI Test Suites
The two should share tools and conventions, but they have different optimization targets:
| Concern | CI end-to-end tests | Production monitors |
|---|---|---|
| Coverage | Broad regression coverage | Small set of critical journeys |
| Environment | Preview, staging, or test | Production |
| Frequency | On changes or scheduled builds | Every few minutes |
| Data | Disposable fixtures | Safe, repeatable production fixtures |
| Failure response | Blocks a release | Opens an incident |
| Runtime | Can be long | Must fail quickly |
| Evidence | Test report | Alert, trace, screenshot, owner |
Reusing a test is valuable only when the test is safe, fast, deterministic, and meaningful in production. Copying the entire regression suite into a synthetic scheduler usually creates cost, latency, and maintenance problems without improving detection.
How Webalert fits
Monitoring as code is best for the browser journeys that need code-level control. Webalert provides the independent outside-in layer underneath them: HTTP, response-time, SSL, content, and multi-region checks that run even when the CI system, application telemetry, or browser-monitoring provider is unavailable.
- Keep broad URL and API availability coverage separate from expensive browser journeys.
- Detect DNS, TLS, routing, and origin failures before a browser script can even start.
- Validate response content so a 200 error page is not marked healthy.
- Use an external monitor for the public health endpoint of the CI or monitoring system itself.
Start uptime monitoring — free. Put a simple, independent signal around every critical endpoint, then use monitoring as code for the few user journeys that need browser-level proof.
Frequently Asked Questions
What is monitoring as code?
Monitoring as code means defining checks, locations, schedules, assertions, secrets references, and alerting in version-controlled files. Pull requests review changes, CI/CD validates them, and a deployment publishes the monitors to run continuously.
Is monitoring as code the same as synthetic monitoring?
No. Synthetic monitoring describes the behavior: controlled checks run against a live system. Monitoring as code describes how those checks are managed: in Git, reviewed, tested, and deployed through automation. A synthetic monitor can be dashboard-managed or code-managed.
Can I use Playwright for production monitoring?
Yes, for safe and repeatable browser journeys such as login, search, signup, and test-mode checkout. Use dedicated accounts, non-destructive data, stable selectors, time limits, and cleanup. Use HTTP checks for simpler availability and API assertions.
Should production monitors reuse CI tests?
Reuse the stable parts and the domain knowledge, but select a small production subset. CI tests optimize for broad regression coverage; production monitors optimize for fast, reliable detection of the few failures that would affect customers.
How do I prevent Playwright monitors from becoming noisy?
Use stable selectors, assert business outcomes, isolate test data, retain traces on failure, run from more than one location, and require consecutive failures before paging. Give every monitor an owner and update it in the same workflow as intentional UI changes.