Your website loads fine. Your API returns 200. Everything looks green.
But your database port just stopped accepting connections, and your app is about to start throwing errors at every user. You have maybe 30 seconds before the connection pool drains and the whole thing falls over.
Port monitoring catches these failures — the ones that happen below the HTTP layer, where most uptime monitors don't look.
This guide explains what port monitoring is, why it matters, which ports you should be watching, and how to set it up.
What Is Port Monitoring?
Port monitoring (or TCP port monitoring) checks whether a specific network port on a server is open and accepting connections. It works at the TCP layer — lower than HTTP — by attempting to establish a TCP connection to a given host and port number.
If the connection succeeds, the port is open and the service behind it is running. If it fails or times out, something is wrong.
How it differs from HTTP monitoring
| HTTP Monitoring | Port Monitoring | |
|---|---|---|
| Layer | Application (Layer 7) | Transport (Layer 4) |
| What it checks | Full request/response cycle | TCP connection only |
| Requires | A web server or API | Any service listening on a port |
| Use case | Websites, APIs, web apps | Databases, mail servers, caches, queues, SSH |
| Response validation | Status code, body, headers | Connected or not connected |
HTTP monitoring is ideal for web-facing services. Port monitoring fills the gap for everything else — the infrastructure services that keep your application running but don't speak HTTP.
Why Port Monitoring Matters
Your app depends on more than a web server
A typical production stack looks like this:
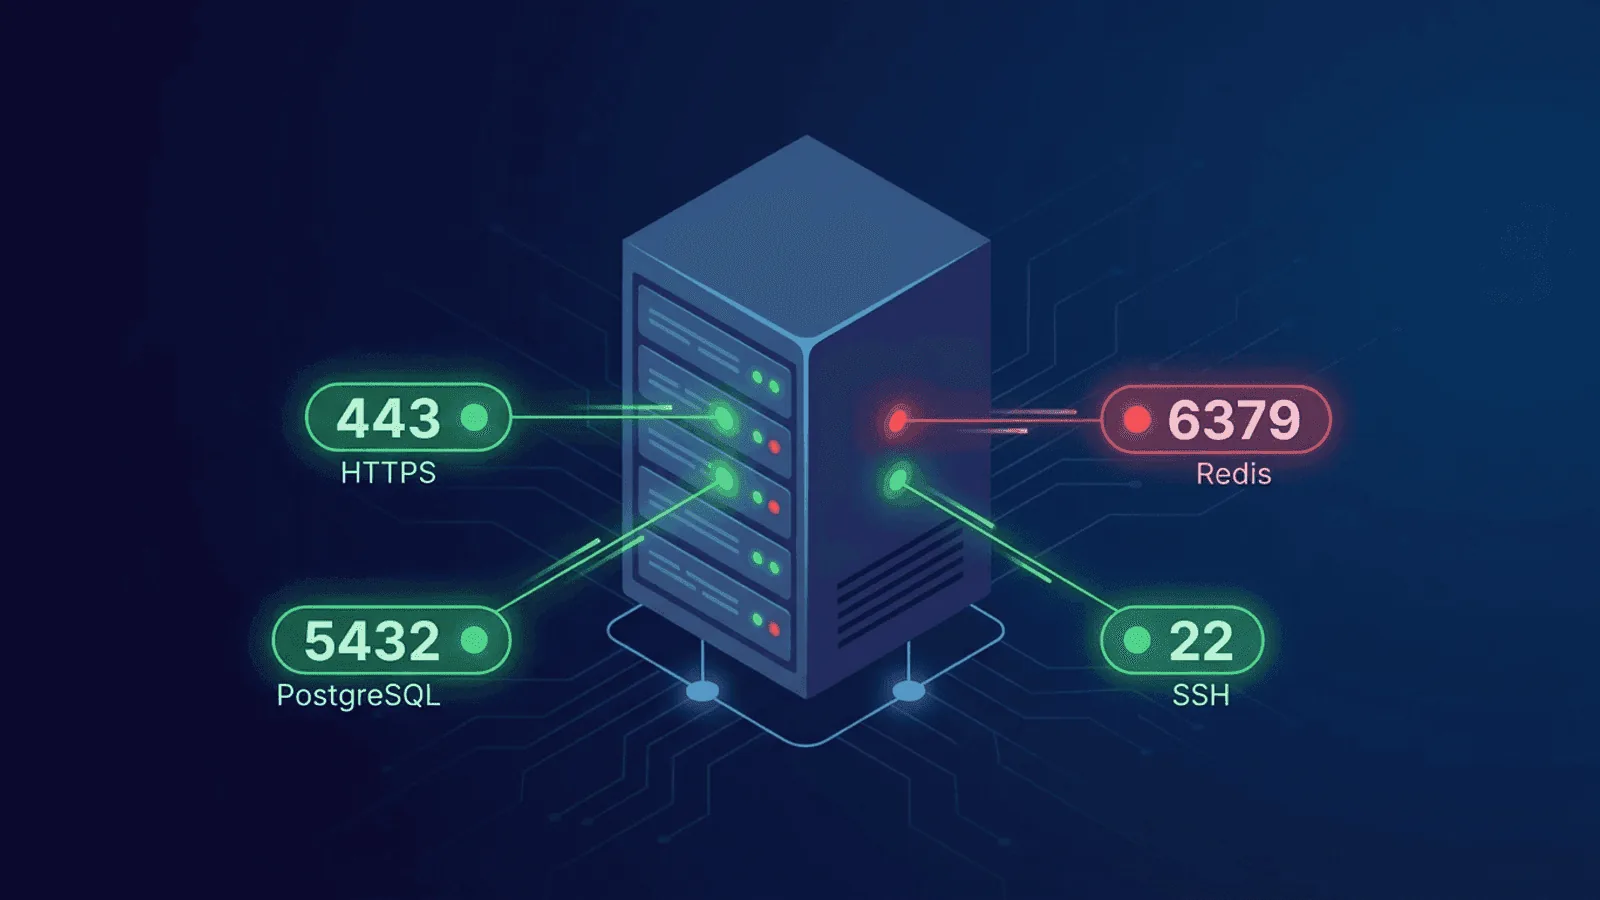
- Web server (port 443/80) — serves your site
- Database (port 5432/3306/27017) — stores your data
- Cache (port 6379) — Redis or Memcached for fast reads
- Message queue (port 5672/15672) — RabbitMQ, for async processing
- Mail server (port 25/587/993) — sends and receives email
- SSH (port 22) — your access to the server
If any of these stop accepting connections, your application breaks — even if the web server itself is still running.
HTTP checks can't see infrastructure failures
An HTTP monitor hitting your homepage won't know that Redis is down until your app starts returning errors. By then, users are already affected. A TCP check on port 6379 catches the Redis failure instantly — before it cascades.
Port closures happen silently
Ports can stop responding for reasons that don't trigger obvious alarms:
- A service crashed but the container is still "running"
- A firewall rule changed and blocked the port
- The process hit its connection limit
- A security patch restarted the service
- The disk filled up and the database stopped accepting writes
Without active port monitoring, these failures sit undetected until something downstream breaks loudly.
Common Ports to Monitor
Here are the ports you'll want to watch, organized by service type.
Databases
| Port | Service | Why monitor it |
|---|---|---|
| 5432 | PostgreSQL | Connection refusal = app errors within seconds |
| 3306 | MySQL/MariaDB | Same — your primary data store can't go down silently |
| 27017 | MongoDB | Especially critical if running without replicas |
| 6379 | Redis | Cache failures cause cascading slowdowns |
| 11211 | Memcached | Similar to Redis — silent degradation |
Web and application servers
| Port | Service | Why monitor it |
|---|---|---|
| 80 | HTTP | Basic web traffic |
| 443 | HTTPS | Encrypted web traffic — your primary entry point |
| 8080/8443 | App server | Tomcat, Node.js, or other application servers behind a proxy |
| 3000 | Dev/staging servers | Common for Node.js, Rails, React dev servers |
| Port | Service | Why monitor it |
|---|---|---|
| 25 | SMTP | Outbound mail delivery |
| 587 | SMTP (submission) | Authenticated mail sending |
| 993 | IMAPS | Encrypted mail retrieval |
| 110 | POP3 | Legacy mail retrieval |
Infrastructure
| Port | Service | Why monitor it |
|---|---|---|
| 22 | SSH | If SSH is down, you can't access the server to fix anything else |
| 53 | DNS | Your own DNS resolver (if self-hosted) |
| 5672 | RabbitMQ | Message queue availability |
| 9092 | Kafka | Event stream availability |
| 2181 | ZooKeeper | Coordination service for distributed systems |
Security rule of thumb
Only monitor ports that should be open. If a port monitoring check succeeds on a port you didn't expect to be open, that's a security finding worth investigating.
What Causes Ports to Stop Responding
1. Service crash
The process behind the port crashed or was killed. The port is closed because nothing is listening anymore. This is the most common cause and the easiest to detect.
2. Connection limit reached
Services like PostgreSQL and Redis have maximum connection limits. Once reached, the port is technically open but new connections are rejected. TCP monitoring may still succeed (the handshake completes) but application-level checks would fail.
3. Firewall changes
A firewall rule was added or modified, blocking inbound connections on the port. Common after security audits or automated hardening scripts.
4. Resource exhaustion
The server ran out of memory, disk space, or file descriptors. Services stop accepting connections even though they haven't technically crashed.
5. Network issues
Routing changes, network partitions, or cloud provider networking incidents can make a port unreachable from certain locations while it works fine from others.
6. TLS certificate issues
For ports that require TLS (like 443 or 993), an expired or misconfigured certificate can prevent successful connections even though the service itself is running.
Port Monitoring Best Practices
Monitor from outside your network
Checking ports from the same server or network only tells you the service is running locally. It doesn't catch firewall rules, routing problems, or cloud networking issues that affect external access. Always monitor from external locations.
Check at the right frequency
- Critical services (database, cache, primary web server): Every 1-2 minutes
- Supporting services (mail, SSH, queue): Every 5 minutes
- Non-critical services (dev/staging): Every 10-15 minutes
Set appropriate timeouts
A port that takes 10 seconds to accept a connection is effectively broken, even if it eventually responds. Set timeouts that match real-world expectations:
- Database ports: 5-second timeout
- Web ports: 3-second timeout
- SSH: 5-second timeout
If the connection takes longer than this, treat it as a failure.
Alert on the right conditions
Don't alert on a single failed check — transient network blips happen. Alert after 2-3 consecutive failures to avoid false alarms. But for critical services (like your primary database), consider alerting after the first failure.
Pair with HTTP monitoring
Port monitoring and HTTP monitoring complement each other:
- Port monitoring tells you the service is accepting connections.
- HTTP monitoring tells you the service is responding correctly.
A port can be open while the application behind it is returning errors. Use both for complete visibility.
Monitor from multiple regions
A port might be reachable from one data center but blocked from another — especially if you use cloud security groups or geo-based firewalling. Multi-region checks catch these discrepancies.
Port Monitoring vs. Other Monitoring Types
| Monitoring Type | What It Catches | Blind Spots |
|---|---|---|
| HTTP monitoring | Web server down, application errors, slow responses | Infrastructure services, non-HTTP ports |
| Port monitoring | Service unreachable, port closed, firewall blocks | Application-level errors, response correctness |
| Ping monitoring | Host unreachable, network down | Individual services on the host |
| DNS monitoring | Resolution failures, wrong records | Everything after DNS resolves |
Each layer catches different failure modes. A robust monitoring setup uses all of them.
Real-World Scenario: Why Port Monitoring Would Have Helped
The situation: A SaaS application runs on a typical stack — Nginx reverse proxy, Node.js app server, PostgreSQL database, Redis cache.
What happened: A routine security update restarted the PostgreSQL service. The restart was supposed to take 2 seconds. Instead, a corrupted WAL file caused PostgreSQL to enter recovery mode, taking 8 minutes.
What HTTP monitoring saw: Nothing — for 45 seconds. Then the app started returning 500 errors as the connection pool drained. The HTTP monitor fired an alert at the 2-minute mark (after 2 consecutive failures).
What port monitoring would have seen: Port 5432 stopped accepting connections immediately. An alert would have fired within 1-2 minutes of the failure — before users were affected.
The difference: 2+ minutes of head start to investigate and communicate, and immediate clarity that the database (not the app, not the network, not DNS) was the problem.
How Webalert Monitors Ports
Webalert includes TCP port monitoring alongside HTTP, ping, and DNS checks:
- Any port, any host — Monitor databases, caches, mail servers, or any TCP service.
- Multi-region checks — Verify port reachability from global locations, not just one.
- Configurable timeouts — Set connection timeout thresholds that match your expectations.
- Smart alerting — Get notified via email, SMS, Slack, Discord, or webhooks when a port stops responding.
- Unified dashboard — See HTTP, TCP, DNS, and ping monitors in one place, so you know exactly which layer has the problem.
- Response time tracking — Track TCP connection times to catch degradation before it becomes a full failure.
See features and pricing for the full list of monitoring capabilities.
Summary
Port monitoring watches the infrastructure layer that HTTP monitoring can't see. Your databases, caches, queues, and mail servers all listen on specific ports — and when those ports stop responding, your application breaks.
- Monitor the ports your app depends on — database, cache, queue, mail, SSH.
- Check from outside your network — internal checks miss firewall and routing issues.
- Pair TCP checks with HTTP checks — together they give you full visibility.
- Alert on consecutive failures — avoid false alarms from transient network blips.
- Set tight timeouts — a slow connection is almost as bad as a refused one.
The services behind the web server are the foundation of your application. Monitor them before they fail silently.