Skip to content
apm application-performance-monitoring tools comparison observability 2026

Best APM Tools 2026: Datadog, New Relic & More

The best APM tools in 2026 compared — Datadog, New Relic, Dynatrace, AppDynamics, and Honeycomb — by use case, pricing, and uptime fit.

Webalert Team
July 27, 2026
13 min read

Best APM Tools 2026: Datadog, New Relic & More

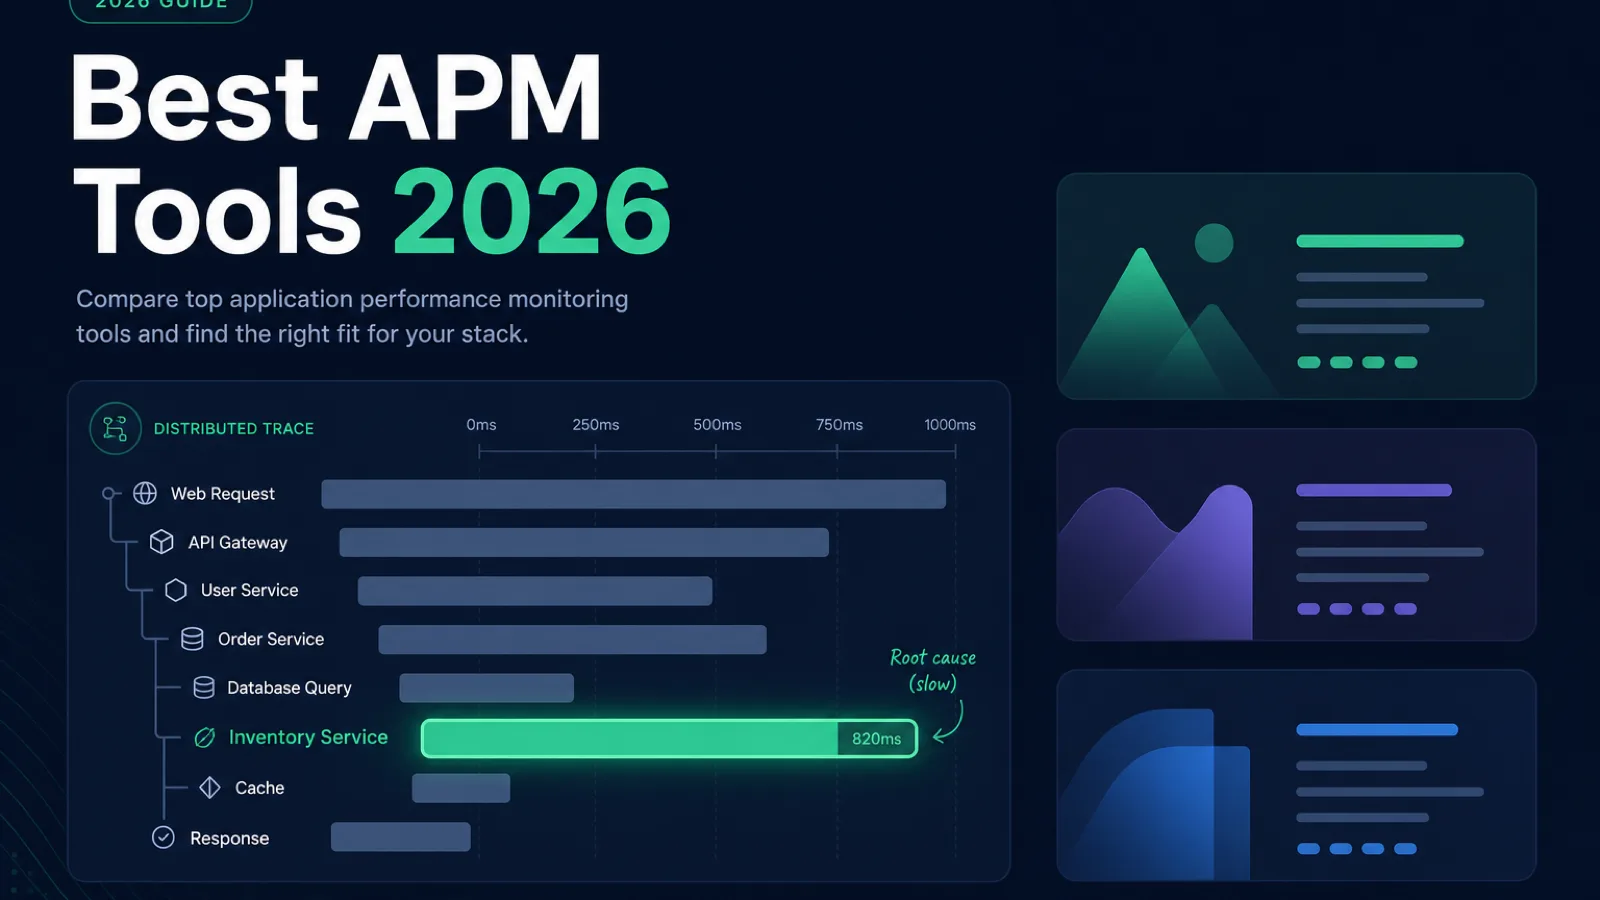
Application Performance Monitoring (APM) is the deepest monitoring layer — the one that instruments your code at the function level, traces requests across service boundaries, and tells you exactly which span of which service made a request slow. It is also the most expensive and operationally heavy layer, and the most common mistake in 2026 is adopting it before the team needs it: paying platform-scale bills and carrying agent overhead for an app where uptime monitoring plus error tracking would cover 90% of the cases. For a conceptual primer on what APM is and when it earns its cost, see what APM is. This guide compares the best APM tools in 2026 so you can match the platform to your stack and your actual bottleneck — not to a vendor's sales deck.

In 2026 the APM field has settled into clear tiers: a cloud-native managed platform of record, a pricing-predictable consumption-priced alternative, an enterprise AI-automation specialist, a business-transaction enterprise pick, and a developer-first entry point. This is not a ranked list where one tool wins. It is a comparison by use case, because the right APM depends entirely on whether you need breadth, pricing predictability, AI root cause, business-transaction depth, or developer-first simplicity.


The Two Questions That Decide Your Tier

What is your stack's center of gravity?

  • Cloud-native, broad integrations — Datadog, the platform of record for teams with complex or heterogeneous infrastructure.
  • OpenTelemetry-first, pricing-predictable — New Relic, for mid-size teams who want to defend the bill to finance.
  • Enterprise, hybrid, AI-automated — Dynatrace, for large-scale environments where manual configuration is the bottleneck.
  • Java-heavy, Cisco ecosystem, business-transaction — AppDynamics, for traditional three-tier enterprise workloads.

What is your team's real bottleneck?

  • "We can't localize cross-service latency" — you need distributed tracing. Any platform here solves it; pick by stack fit and cost.
  • "Our APM bill is unpredictable" — you need consumption pricing. New Relic is the most defensible to a finance department.
  • "We need root cause automated, not manual" — you need AI-driven causal analysis. Dynatrace's Davis AI is the leader.
  • "We want developer-first, error + performance in one" — you need a lightweight entry point. Sentry or Honeycomb.

Answer those two and the field narrows to one or two platforms.


Tier 1: The Cloud-Native Platform of Record

Datadog APM

The broadest platform on the market, with 700+ integrations and the strongest developer experience. If your stack includes anything niche — a vintage database, a SaaS product without published OpenTelemetry instrumentation — Datadog probably has a turnkey integration. Distributed tracing, log ingestion, and the unified UI across metrics, logs, and traces are genuinely best-in-class.

  • Pricing: per-host, modular. Infrastructure from ~$15/host/month (Pro, annual), APM ~$31/host/month (Standard), APM Enterprise ~$40/host/month. The structural catch: APM cannot be purchased standalone — every APM host requires a paired Infrastructure plan, so the real per-host cost of adding tracing is roughly $46/host/month at the Pro/Standard tiers. Logs billed separately at $0.10/GB ingested plus $1.70/million indexed events.
  • Best for: cloud-native teams at scale that want the broadest integration ecosystem and unified metrics/logs/traces in one UI.
  • Watch out for: the bill that looked reasonable in pilot often triples or quadruples at production scale. Per-product, per-host pricing with separate line items for custom metrics, log retention, synthetic, and RUM is the single most common reason teams reconsider their Datadog spend. See our Datadog alternative guide.

New Relic

The price-performance winner for mid-size teams and the easiest commercial APM to defend to a finance department. New Relic rebuilt itself around a consumption-based pricing model: all telemetry — traces, metrics, logs, synthetic checks — flows through one ingest pipeline, priced per GB rather than per host. The free tier (100 GB/month of data ingest, one full-platform user) is unusually generous.

  • Pricing: $0.30/GB of data ingested above the 100 GB free tier, plus a user-based component ($49–$99 per Full-Platform User/month). For teams with disciplined data hygiene, a mid-size SaaS team has reported bills as low as ~$5,000/month at 200-host scale.
  • Best for: mid-size teams that want pricing predictability and OpenTelemetry-first instrumentation; teams where the APM bill has to survive a finance review.
  • Watch out for: at very high scale the ingest model can produce surprising bills if you fire-hose verbose logs without filtering, and the integration breadth still trails Datadog. See our New Relic alternative guide.

Best for: teams that want a managed APM platform matched to their stack's center of gravity. Watch out for: both bill by usage at scale — Datadog per-host/per-product, New Relic per-GB — and neither catches the outages that produce zero traces. That gap is what outside-in uptime monitoring fills.


Tier 2: Enterprise AI Automation

Dynatrace

The enterprise choice for AI-automated root cause analysis. Dynatrace's Davis AI performs causal analysis on the full dependency graph and surfaces the root cause of a degradation without manual investigation — the differentiator that defines the platform. Its OneAgent auto-instruments and auto-discovers the topology, which removes the manual configuration burden that consumes APM teams at enterprise scale.

  • Pricing: consumption-based unit model (DPS) that bundles full-stack monitoring. Generally the most expensive option here, but often justifies its cost for complex, large-scale hybrid environments by reducing manual configuration and toil.
  • Best for: large-scale, hybrid environments where the bottleneck is manual configuration and root-cause investigation, not platform breadth.
  • Watch out for: the cost, and that the AI automation is most valuable in environments complex enough to need it — smaller stacks won't see the ROI.

Splunk AppDynamics (Cisco)

The enterprise pick for business-transaction monitoring and teams heavily invested in the Cisco ecosystem or traditional three-tier, Java-heavy applications. AppDynamics models transactions as business-meaningful flows (a checkout, a trade, a claim) rather than generic spans, which is the right framing for teams that tie application performance to business KPIs.

  • Pricing: per CPU core or per agent; enterprise sales motion.
  • Best for: Java-heavy enterprise workloads and Cisco shops that monitor business transactions as a product KPI.
  • Watch out for: for cloud-native or polyglot teams, Datadog or New Relic give more breadth for less operational overhead.

Best for: enterprise teams whose bottleneck is automation and business-transaction depth, not breadth. Watch out for: the cost and the operational maturity required to act on the AI output — an APM that automates root cause is only valuable if your team has the discipline to act on it.


Tier 3: Developer-First and High-Cardinality

Sentry

The developer-first entry point — error tracking and performance tracing in one product, with the lowest friction to start. Sentry's strength is the workflow from "user hit an error" to "pull request with a fix," and its performance monitoring is a natural extension of its error tracking rather than a separate platform. For teams that want tracing without standing up a full APM, Sentry is the path of least resistance. For a deeper comparison of where Sentry sits relative to pure error trackers, see our best error tracking tools guide.

  • Pricing: per-event, with a free tier (5,000 errors/month) and Team plans from ~$26/month. Event-based pricing scales with volume, not team size.
  • Best for: developer-first teams that want error tracking plus performance tracing in one surface without a full APM platform.
  • Watch out for: Sentry is not a full-stack APM — it doesn't replace Datadog or Dynatrace for infrastructure and logs. It replaces the need for one when your app is simple enough that errors + performance are all you need.

Honeycomb

The high-cardinality specialist. Honeycomb's event-based model lets you slice on any dimension (user_id, request_id, feature_flag) without pre-defining indexes, which is the right tool for teams that need to ask arbitrary questions of high-volume, high-cardinality data — the kind of investigation that breaks traditional metric indexes.

  • Pricing: event-based, with a generous free tier and usage-based pricing on top.
  • Best for: teams running high-cardinality, high-volume systems where the bottleneck is "we can't ask arbitrary questions of our telemetry," not "we need dashboards."
  • Watch out for: Honeycomb is a structured-events tool, not a logs platform — teams that need log search alongside traces should pair it with a dedicated log tool (see our best log monitoring tools guide).

Best for: teams that want tracing depth without a full APM platform's overhead. Watch out for: neither Sentry nor Honeycomb is a full observability platform — pair them with outside-in uptime monitoring for the failures that produce no telemetry.


Tier 4: Open-Source, OTel-Native

Elastic APM / SigNoz / Grafana Tempo

The open-source path for teams that want an OpenTelemetry-native stack without managed-platform cost. Elastic APM brings Elasticsearch's full-text search to traces; SigNoz is an OTel-native, self-hostable APM built on ClickHouse; Grafana Tempo is the trace backend for the Grafana/Prometheus stack. All three let you own your trace data and avoid per-host or per-GB licensing.

  • Best for: teams that want cost transparency, data ownership, and an OTel-native pipeline, and have the operational capacity to run a self-hosted backend.
  • Watch out for: self-hosting is operational overhead — you run the storage, the upgrades, the retention. For teams without that capacity, a managed platform is cheaper in engineer-time than it is in dollars.

The gap every APM leaves

Every platform in this list shares one blind spot, and it is the reason this guide lives on a site about uptime monitoring: APM only records a trace when your code runs and the agent reaches the backend. A large class of real outages never produce a trace, because the failure happens before your code runs or outside your application boundary:

  • Total outages — the server is down, no requests reach the app, no spans are emitted.
  • DNS and CDN edge failures — no request reaches your origin, no application code executes. See Cloudflare monitoring.
  • Third-party API outages — Stripe is down, your integration degrades, no span fires, but checkout is broken. See third-party dependency monitoring.
  • The APM agent itself going down — if the agent can't reach its backend, your traces silently stop and your dashboard goes flat, indistinguishable from "no load."

The pattern: absence of slow traces is not presence of health. APM is an inside-out signal that depends on your code running. Uptime monitoring is an outside-in signal that depends on nothing but the user's perspective. The two are complements — page on outside-in (users are affected), triage with inside-out (which span caused it). For the full treatment of why running only one is a blind spot, see error monitoring vs uptime monitoring.


How to Choose

If you want the broadest managed platform and can absorb per-host pricing

Datadog. The integration ecosystem and unified UI are best-in-class; the cost is the platform contract. Adopt it when the breadth pays for itself, not because the sales deck said observability is non-negotiable.

If you want pricing predictability and OTel-first instrumentation

New Relic. The consumption model is the most defensible to finance, and the 100 GB free tier lets you evaluate it on real volume before committing.

If you need AI-automated root cause at enterprise scale

Dynatrace. Davis AI is the leader, and the OneAgent auto-discovery removes the manual configuration that consumes APM teams at scale. Justify the cost when your environment is complex enough that automation pays for itself.

If you're Java-heavy or a Cisco shop monitoring business transactions

AppDynamics. The business-transaction model is the right framing when application performance is tied to business KPIs.

If you want developer-first tracing without a full APM

Sentry (error + performance in one) or Honeycomb (high-cardinality structured events). Both give you tracing depth without platform overhead — and both leave the outside-in gap that uptime monitoring fills.

If you want to own your data and run OTel-native

Elastic APM, SigNoz, or Grafana Tempo. The tradeoff is operational overhead; the payoff is cost transparency and no vendor lock-in.

The honest hybrid

Most mature teams run an APM for the inside-out code signal and a separate outside-in uptime monitor for the user-availability signal — because no APM catches the outages that produce zero traces. That hybrid is the standard, not a compromise. See monitoring for startups for the "reliability before scale" framing of when to add each layer.


Frequently Asked Questions

What is the best APM tool in 2026?

There is no single best — it depends on your stack and bottleneck. For broad cloud-native integrations, Datadog. For pricing predictability and OTel-first, New Relic. For enterprise AI root cause, Dynatrace. For business-transaction enterprise, AppDynamics. For developer-first tracing, Sentry or Honeycomb. For self-hosted OTel-native, Elastic APM, SigNoz, or Grafana Tempo.

Is free APM enough?

For a small app, sometimes — New Relic's 100 GB/month free tier and Honeycomb's free tier cover evaluation and low-volume use. The moment you need enterprise integrations, AI root cause, or high-volume production tracing, you outgrow the free tier. Most production APM is paid.

Why is APM so expensive?

APM platforms bill per host (Datadog, Dynatrace), per GB ingested (New Relic), per event (Sentry, Honeycomb), or per CPU core (AppDynamics) — and telemetry volume scales with traffic, not team size. A high-traffic app generates millions of spans per incident. The defense against bill shock is disciplined data hygiene (filter verbose logs, sample high-volume traces) and committing only to baseline usage, not peak.

Do I need APM and uptime monitoring?

Yes, if you have users. APM tells you which span made the request slow; uptime monitoring tells you that the site is broken for users. They catch different failure classes — APM is blind to outages that produce no traces, and uptime monitoring can't localize the slow span. Run both. See error monitoring vs uptime monitoring.

Can I self-host an APM?

Yes — SigNoz, Elastic APM, and Grafana Tempo are open-source and self-hostable, built on OpenTelemetry. The tradeoff is operational overhead: you maintain the storage, upgrades, and retention. For teams that want cost transparency and data ownership and have the operational capacity, self-hosted OTel-native APM is the standard.


Pick the Tier That Matches Your Bottleneck

The most expensive mistake in APM is buying a platform when you needed a specialist, or a specialist when you needed the platform — and the second most expensive is assuming your APM catches outages it doesn't.

Start uptime monitoring — free. Multi-region outside-in checks, status pages, and on-call in one product — the outside-in complement to whichever APM you pick, so the outages that produce zero traces still get caught in minutes.

Catch outages before your customers do — free, no credit card required.

Start Free Monitoring

Written by

Webalert Team

The Webalert team is dedicated to helping businesses keep their websites online and their users happy with reliable monitoring solutions.

Stop guessing about downtime

Start monitoring your website in under a minute — free, no credit card required.

Start Free Monitoring